Asking the right questions during Tableau interviews can be challenging yet rewarding. It helps to identify the most skilled and suitable candidates who can transform your data into actionable insights, much like how a business intelligence analyst does.
This blog post provides a comprehensive list of Tableau interview questions tailored for different expertise levels. From junior analysts to top-tier professionals, you'll find questions that assess a wide range of skills, from data visualization to dashboard creation.
Utilizing these questions will streamline your hiring process and ensure you bring on board the best talent for your organization. Complement these questions with our Tableau Online Test to further vet candidates' skills before the interview.
Table of contents
Top 8 Tableau questions to ask in interviews

To effectively gauge a candidate's proficiency in Tableau and their ability to interpret data insights, consider these top 8 questions. These queries are designed to help you identify whether your applicants have the right skills and experience to excel in data visualization and analysis.
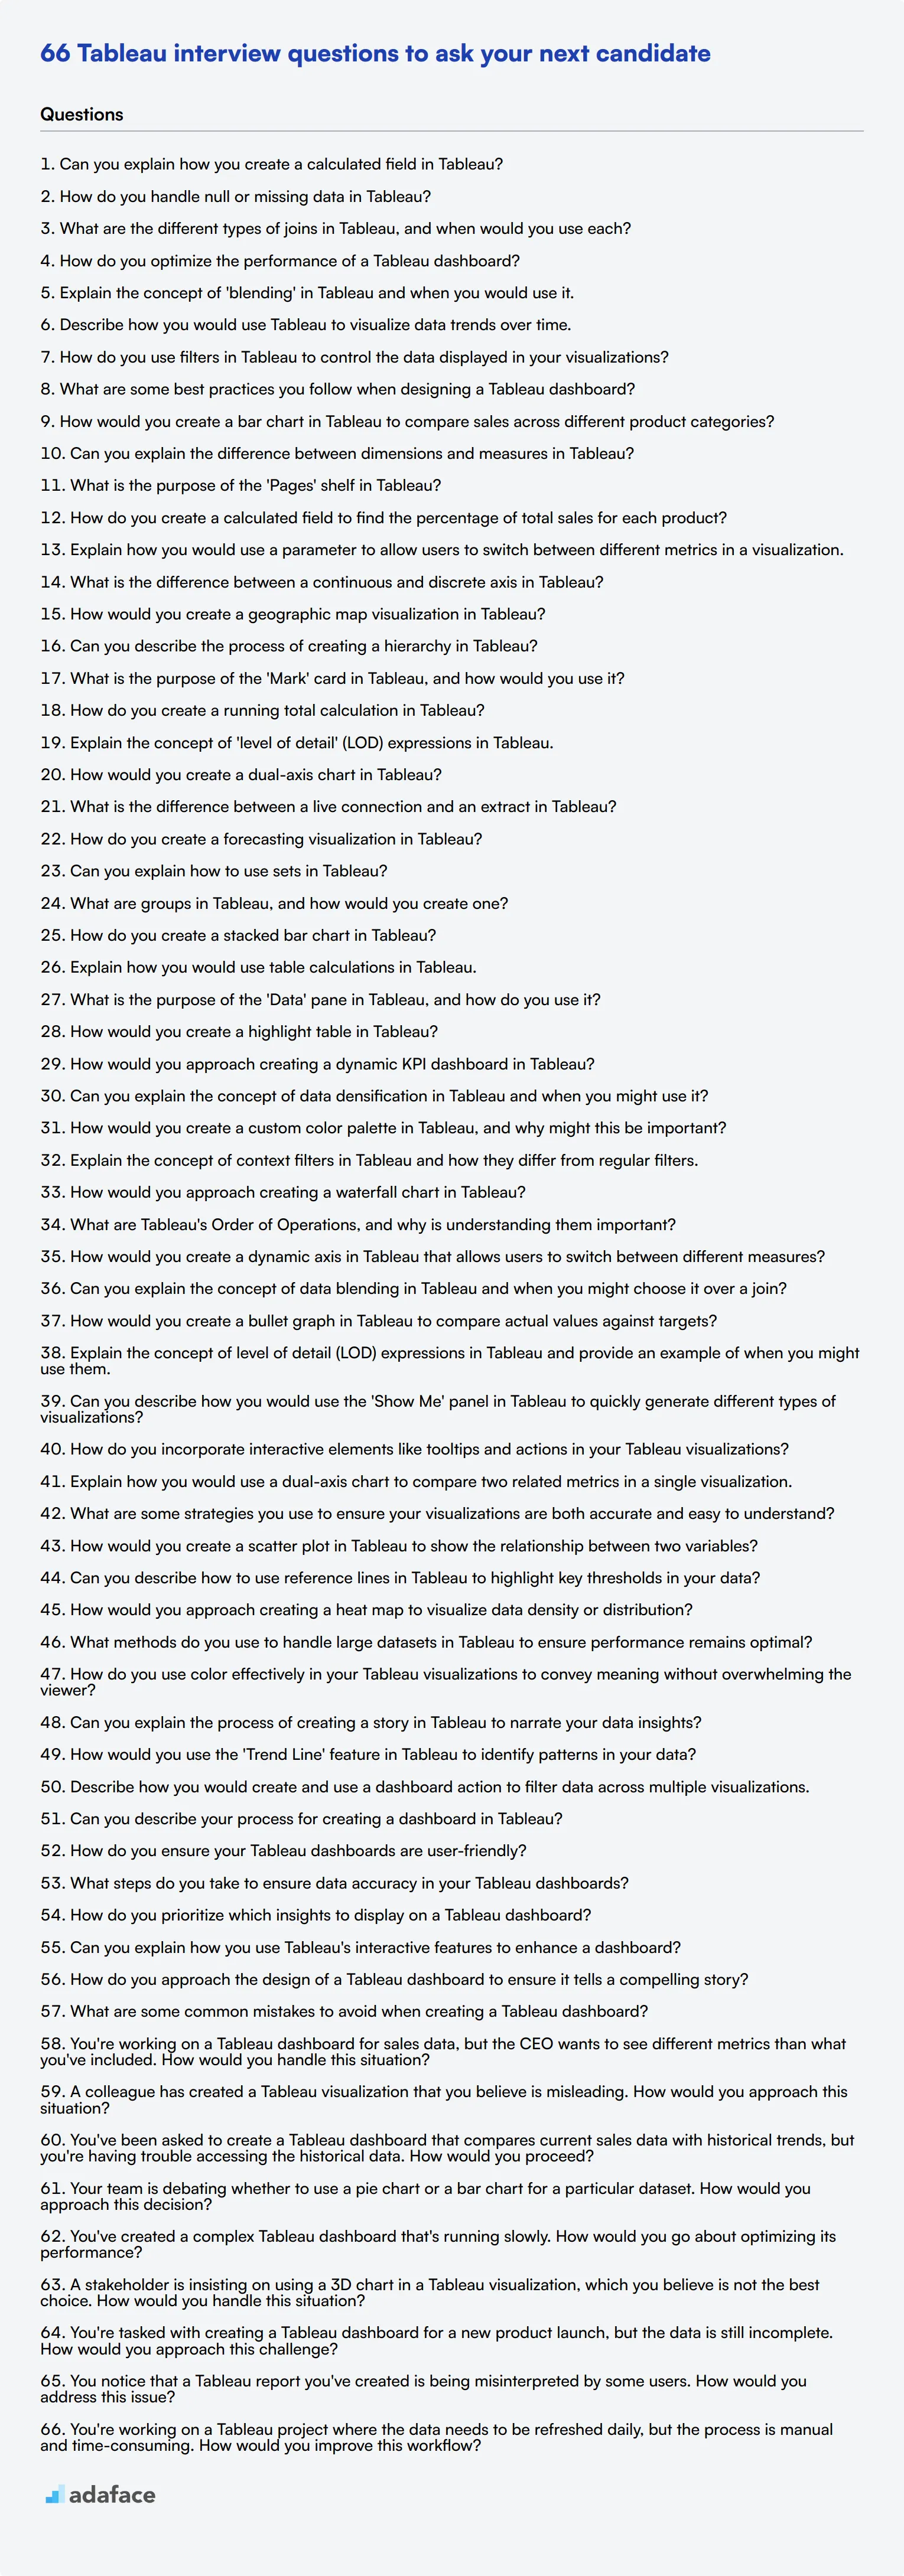
1. Can you explain how you create a calculated field in Tableau?
To create a calculated field in Tableau, you start by going to the Data pane, right-click on the desired data source, and select 'Create Calculated Field'. From there, you can enter your desired calculation using the available fields and functions.
Candidates should demonstrate familiarity with commonly used functions and calculations in Tableau, such as string manipulations, arithmetic calculations, and logical testing within the calculated field. Look for a candidate's ability to explain the practical application of their calculated fields in real-world scenarios.
2. How do you handle null or missing data in Tableau?
Handling null or missing data in Tableau can be done by using calculated fields to replace null values with a default value or through data preparation steps such as data cleansing or filtering. Techniques such as using the ZN() function to convert nulls to zeros in calculations are quite common.
An ideal candidate will not only mention these techniques but should also be able to discuss why handling null data is important for accurate data analysis and share examples of how they have managed missing data in their past projects.
3. What are the different types of joins in Tableau, and when would you use each?
Tableau supports several types of joins: Inner, Left, Right, and Full Outer joins. Each type is used based on the requirement to combine data from two tables.
For instance, an inner join returns only the matching rows from both tables, while a left join returns all rows from the left table and the matched rows from the right table. A right join does the opposite, and a full outer join returns all rows when there is a match in either table.
Candidates should understand the implications of each join type on their data, and ideally, provide examples of scenarios where they have used each type effectively.
4. How do you optimize the performance of a Tableau dashboard?
Optimizing the performance of a Tableau dashboard can involve several strategies including reducing the number of sheets, minimizing the use of complex calculations and filters, and using extracts instead of live connections where possible.
It also helps to optimize data sources by selecting only the necessary fields and aggregating data appropriately. Efficient use of context filters and avoiding high-cardinality filters can also improve performance.
Look for candidates who can discuss their hands-on experience with performance tuning and their ability to diagnose and address common performance issues.
5. Explain the concept of 'blending' in Tableau and when you would use it.
'Blending' in Tableau refers to combining data from different data sources in the same view. It is particularly useful when you have data stored in different sources, such as different databases or spreadsheets, and you need to analyze them together.
Data blending is done by defining a primary data source and then linking a secondary data source using common fields. This allows for integrated analysis without physically merging the data.
Candidates should understand the limitations of data blending compared to joining and be able to provide examples of when and why they chose to blend data in their projects.
6. Describe how you would use Tableau to visualize data trends over time.
To visualize data trends over time in Tableau, you can use time series charts such as line charts or area charts. By placing a date field on the columns shelf and the measure you want to analyze on the rows shelf, you can easily create a time trend visualization.
Additionally, using features like trend lines, forecasting, and reference lines can provide further insights into the data trends.
Candidates should demonstrate their understanding of different time-series visualizations and discuss any advanced techniques they've used to enhance their analysis, such as seasonality decomposition or moving averages.
7. How do you use filters in Tableau to control the data displayed in your visualizations?
Filters in Tableau can be applied at various levels, including at the data source, context, dimension, and measure levels. They allow you to control and refine the data displayed in your visualizations according to specific criteria.
You can create filters by dragging fields to the Filters shelf and customizing the filter conditions. Filters can be interactive, providing users with the ability to modify the displayed data dynamically.
Candidates should highlight their experience with different types of filters, such as quick filters, context filters, and cascading filters, and explain how they've used them to create more focused and relevant visualizations.
8. What are some best practices you follow when designing a Tableau dashboard?
Designing an effective Tableau dashboard involves several best practices such as maintaining simplicity and clarity, ensuring a logical flow, and focusing on the key metrics and insights that the end-users need.
Other best practices include using consistent color schemes, providing interactive elements like filters and tooltips, and optimizing for performance and responsiveness.
An ideal candidate will speak to their experience with user-centric design and their ability to iterate based on feedback, ensuring the dashboard meets the functional and aesthetic needs of its audience.
20 Tableau interview questions to ask junior analysts
When interviewing junior data analysts, use these Tableau questions to assess their foundational knowledge and practical skills. These questions help you gauge a candidate's ability to work with Tableau's core features and create basic visualizations.
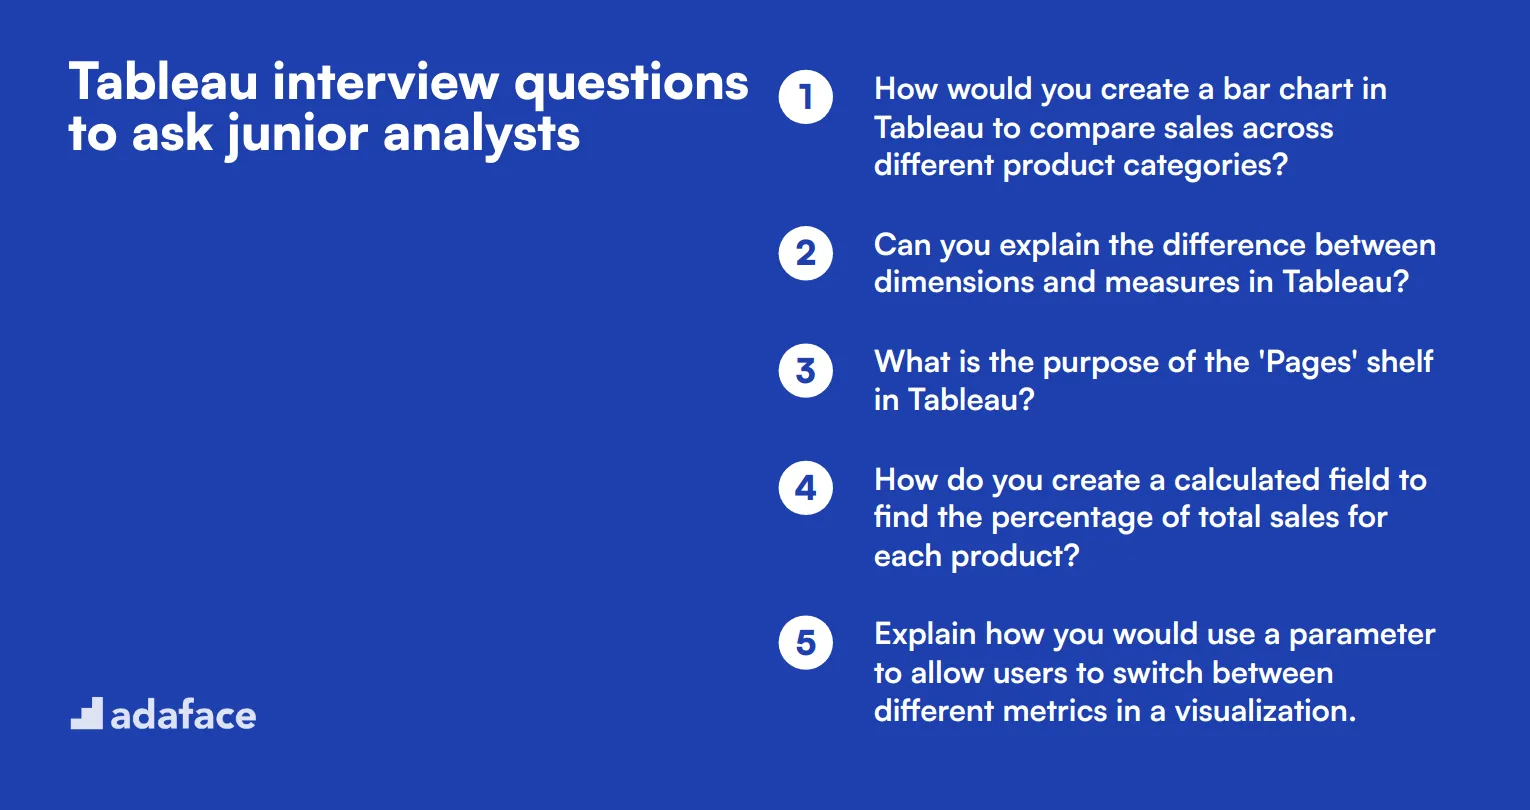
- How would you create a bar chart in Tableau to compare sales across different product categories?
- Can you explain the difference between dimensions and measures in Tableau?
- What is the purpose of the 'Pages' shelf in Tableau?
- How do you create a calculated field to find the percentage of total sales for each product?
- Explain how you would use a parameter to allow users to switch between different metrics in a visualization.
- What is the difference between a continuous and discrete axis in Tableau?
- How would you create a geographic map visualization in Tableau?
- Can you describe the process of creating a hierarchy in Tableau?
- What is the purpose of the 'Mark' card in Tableau, and how would you use it?
- How do you create a running total calculation in Tableau?
- Explain the concept of 'level of detail' (LOD) expressions in Tableau.
- How would you create a dual-axis chart in Tableau?
- What is the difference between a live connection and an extract in Tableau?
- How do you create a forecasting visualization in Tableau?
- Can you explain how to use sets in Tableau?
- What are groups in Tableau, and how would you create one?
- How do you create a stacked bar chart in Tableau?
- Explain how you would use table calculations in Tableau.
- What is the purpose of the 'Data' pane in Tableau, and how do you use it?
- How would you create a highlight table in Tableau?
10 intermediate Tableau interview questions and answers to ask mid-tier analysts
Ready to level up your Tableau interview game? These 10 intermediate questions are perfect for assessing mid-tier analysts. They'll help you gauge candidates' deeper understanding of Tableau's capabilities and their ability to apply data visualization techniques effectively. Use these questions to spark insightful discussions and uncover your next Tableau superstar!
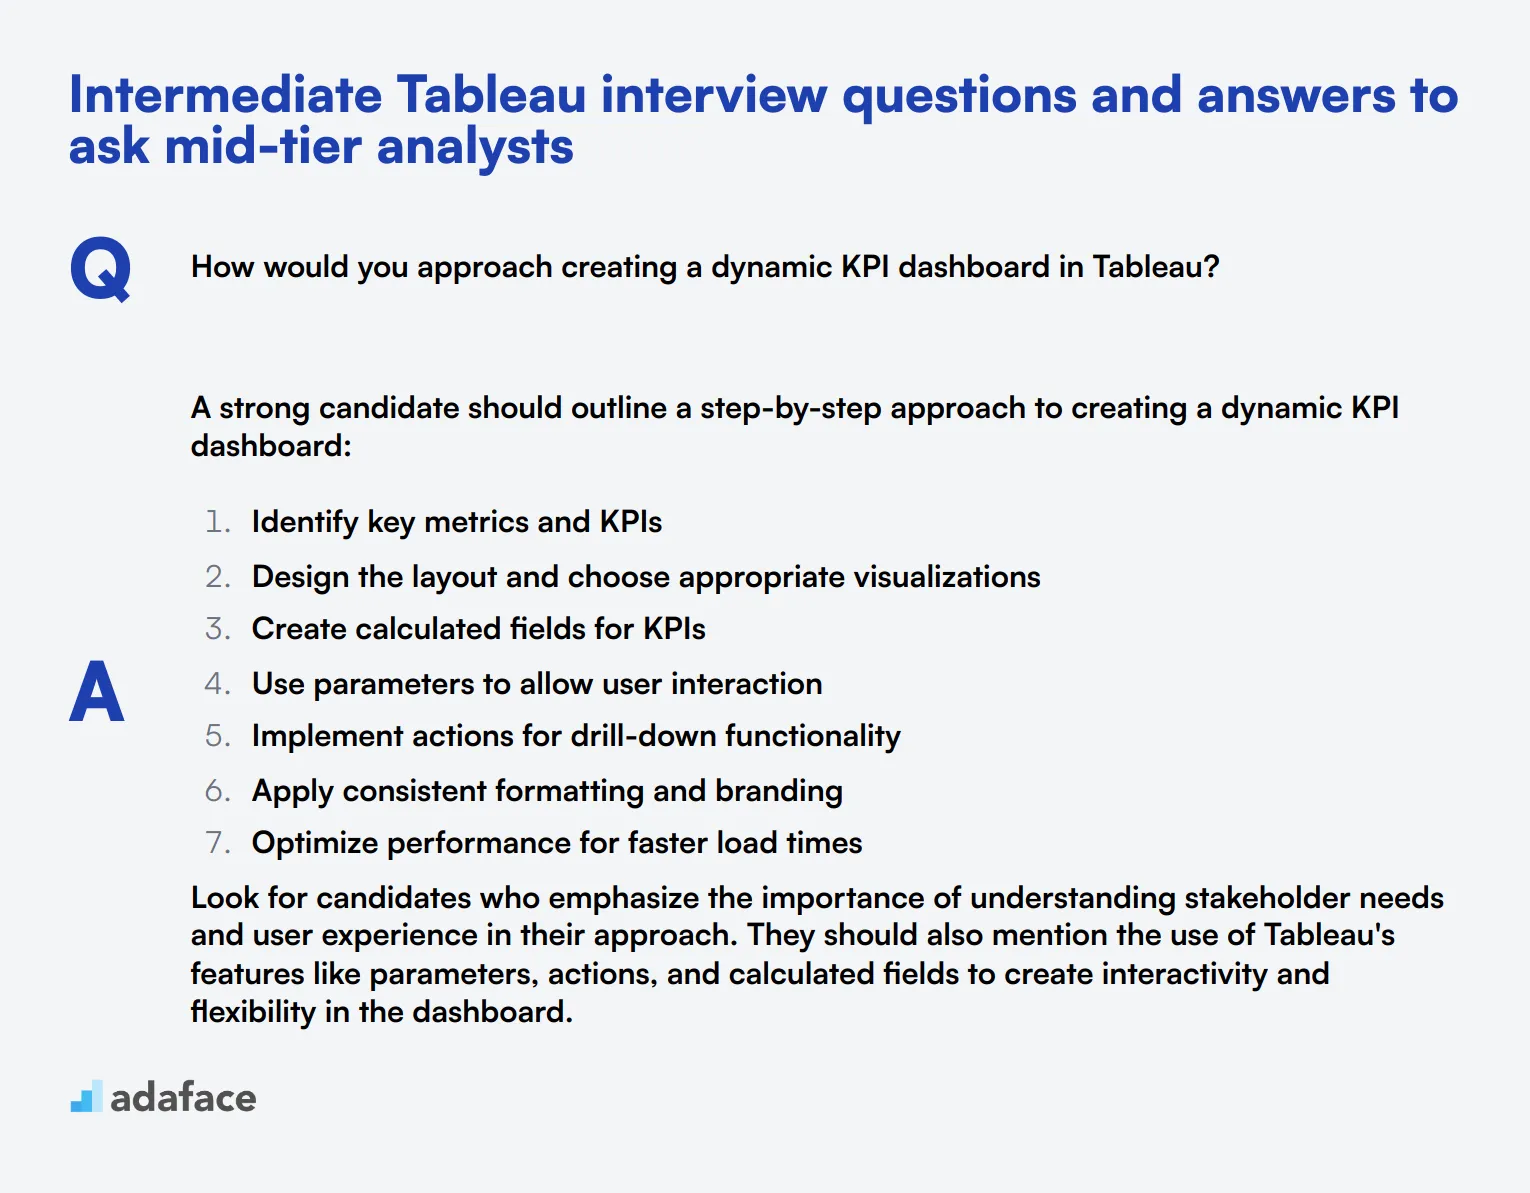
1. How would you approach creating a dynamic KPI dashboard in Tableau?
A strong candidate should outline a step-by-step approach to creating a dynamic KPI dashboard:
- Identify key metrics and KPIs
- Design the layout and choose appropriate visualizations
- Create calculated fields for KPIs
- Use parameters to allow user interaction
- Implement actions for drill-down functionality
- Apply consistent formatting and branding
- Optimize performance for faster load times
Look for candidates who emphasize the importance of understanding stakeholder needs and user experience in their approach. They should also mention the use of Tableau's features like parameters, actions, and calculated fields to create interactivity and flexibility in the dashboard.
2. Can you explain the concept of data densification in Tableau and when you might use it?
Data densification in Tableau refers to the process of adding additional data points to a visualization to fill in gaps or create a more complete view. It's particularly useful when working with time-based data or when you need to show all possible combinations of dimensions, even if some combinations don't exist in the original data.
Some common scenarios where data densification is helpful include:
- Showing a continuous time axis with missing dates filled in
- Creating a complete cross-product of dimension members
- Generating additional marks for smoother line charts or area charts
Look for candidates who can explain how data densification works under the hood and provide specific examples of when they've used it to solve real-world visualization challenges. They should also be aware of potential performance implications when using this technique extensively.
3. How would you create a custom color palette in Tableau, and why might this be important?
To create a custom color palette in Tableau, candidates should describe the following steps:
- Create a .tps file (Tableau Preferences File)
- Define the color palette using XML syntax
- Specify a type (categorical, sequential, or diverging) and name for the palette
- Save the file in the Tableau Repository's Preferences folder
- Restart Tableau to apply the new palette
The importance of custom color palettes lies in:
- Maintaining brand consistency across visualizations
- Improving accessibility for color-blind users
- Enhancing the overall aesthetic appeal of dashboards
- Tailoring color schemes to specific data types or industry standards
Strong candidates will emphasize the importance of color theory in data visualization and discuss how thoughtful color choices can impact data interpretation and user engagement. They might also mention the ability to share custom palettes across a team for consistent reporting.
4. Explain the concept of context filters in Tableau and how they differ from regular filters.
Context filters in Tableau are a special type of filter that creates a temporary subset of data before other filters are applied. They differ from regular filters in several key ways:
- Processing order: Context filters are processed first, creating a smaller dataset for other filters to work with.
- Performance impact: They can significantly improve performance for large datasets by reducing the amount of data being processed.
- Functionality: Context filters affect calculations and table calculations, while regular filters do not.
- Persistence: Once set, context filters remain in place until explicitly removed.
Look for candidates who can explain scenarios where context filters are beneficial, such as when working with very large datasets or when certain filters need to be applied before others for accurate results. They should also be aware of potential drawbacks, like increased initial load time when setting the context.
5. How would you approach creating a waterfall chart in Tableau?
Creating a waterfall chart in Tableau involves several steps:
- Prepare the data with running totals and individual contributions
- Create calculated fields for the start and end points of each bar
- Use a Gantt chart as the base for the waterfall chart
- Adjust the chart to show positive and negative changes
- Format the chart with appropriate colors and labels
Key aspects to consider:
- Using table calculations for running totals
- Creating a calculated field to determine bar colors (positive/negative)
- Adding total and subtotal bars as needed
- Ensuring clear labeling for each step in the waterfall
Strong candidates will discuss the importance of data preparation and may mention alternative methods, such as using floating bars. They should also touch on best practices for making waterfall charts easily interpretable, such as consistent color coding and clear annotations.
6. What are Tableau's Order of Operations, and why is understanding them important?
Tableau's Order of Operations, also known as the Query Pipeline, determines the sequence in which Tableau executes various operations when processing a visualization. The general order is:
- Extract Filters
- Data Source Filters
- Context Filters
- Filters on Dimensions
- Filters on Measures
- Table Calculations
Understanding this order is crucial because it affects how data is processed and displayed in visualizations. It can impact:
- Performance optimization
- Accuracy of calculations and aggregations
- Behavior of filters and their interactions
- Troubleshooting unexpected results
Look for candidates who can provide examples of how the Order of Operations influences real-world scenarios in Tableau. They should be able to explain how changing the order of certain operations (e.g., moving a filter to context) can alter the final visualization or improve performance.
7. How would you create a dynamic axis in Tableau that allows users to switch between different measures?
To create a dynamic axis in Tableau that allows users to switch between measures, candidates should describe the following approach:
- Create a parameter with a list of measure names
- Create a calculated field that returns the appropriate measure based on the parameter selection
- Use the calculated field in the visualization
- Add the parameter control to the dashboard for user interaction
The calculated field might look something like this: CASE [Measure Parameter] WHEN 'Sales' THEN [Sales] WHEN 'Profit' THEN [Profit] WHEN 'Quantity' THEN [Quantity] END
Strong candidates will discuss the benefits of this approach, such as increased interactivity and reduced dashboard clutter. They might also mention potential enhancements like dynamically updating axis titles and formatting based on the selected measure. Look for candidates who consider user experience and performance implications when implementing dynamic elements.
8. Can you explain the concept of data blending in Tableau and when you might choose it over a join?
Data blending in Tableau is a method of combining data from multiple sources at the aggregate level, rather than at the row level like traditional joins. It's useful when:
- Data sources have different levels of granularity
- You need to combine data from different database types
- You want to avoid duplicating data across sources
Key characteristics of data blending:
- It's performed after aggregation, which can improve performance
- It uses a left join logic by default
- It allows for linking fields that don't necessarily match exactly
- It can handle mismatched aggregation levels
Look for candidates who can compare data blending to joining and explain scenarios where each is more appropriate. They should be aware of limitations, such as the inability to use blended fields in calculations at the data source level. Strong answers will include real-world examples of when they've used data blending to solve specific data analysis challenges.
9. How would you create a bullet graph in Tableau to compare actual values against targets?
Creating a bullet graph in Tableau involves several steps:
- Set up the data with actual values, targets, and potentially qualitative ranges
- Create a dual-axis chart with a bar for the actual value and a line for the target
- Add reference lines or bands for qualitative ranges (e.g., poor, satisfactory, good)
- Synchronize the axes and adjust the size of the bars and lines
- Format the chart for clarity, potentially using color to highlight performance
Key considerations:
- Using calculated fields to determine performance categories
- Ensuring the scale appropriately represents the data and targets
- Adding clear labels and a legend for easy interpretation
- Potentially using parameters for dynamic targets or thresholds
Strong candidates will discuss the advantages of bullet graphs for compact, information-rich comparisons. They might mention variations like horizontal layouts or multiple metrics in a single view. Look for answers that emphasize the importance of clear visual communication and the ability to quickly convey performance against goals.
10. Explain the concept of level of detail (LOD) expressions in Tableau and provide an example of when you might use them.
Level of Detail (LOD) expressions in Tableau allow you to compute values at a level of granularity different from the view's current level of detail. They come in three types:
- FIXED: Computes a value at a specified level, regardless of the view's LOD
- INCLUDE: Adds dimensions to the view's LOD for the calculation
- EXCLUDE: Removes dimensions from the view's LOD for the calculation
An example use case for an LOD expression might be calculating the percent of total sales for each product within its category: {FIXED [Category], [Product]: SUM([Sales])} / {FIXED [Category]: SUM([Sales])}
Look for candidates who can explain the syntax and behavior of LOD expressions clearly. They should be able to provide multiple examples of when LOD expressions solve problems that are difficult or impossible with standard aggregations. Strong answers will also touch on performance considerations and potential alternatives to LOD expressions in certain scenarios.
12 Tableau interview questions about data visualization
To evaluate whether candidates possess the necessary data visualization skills in Tableau, you can use these targeted interview questions. This list is designed to help recruiters and hiring managers identify applicants' proficiency and creativity in visualizing data effectively.
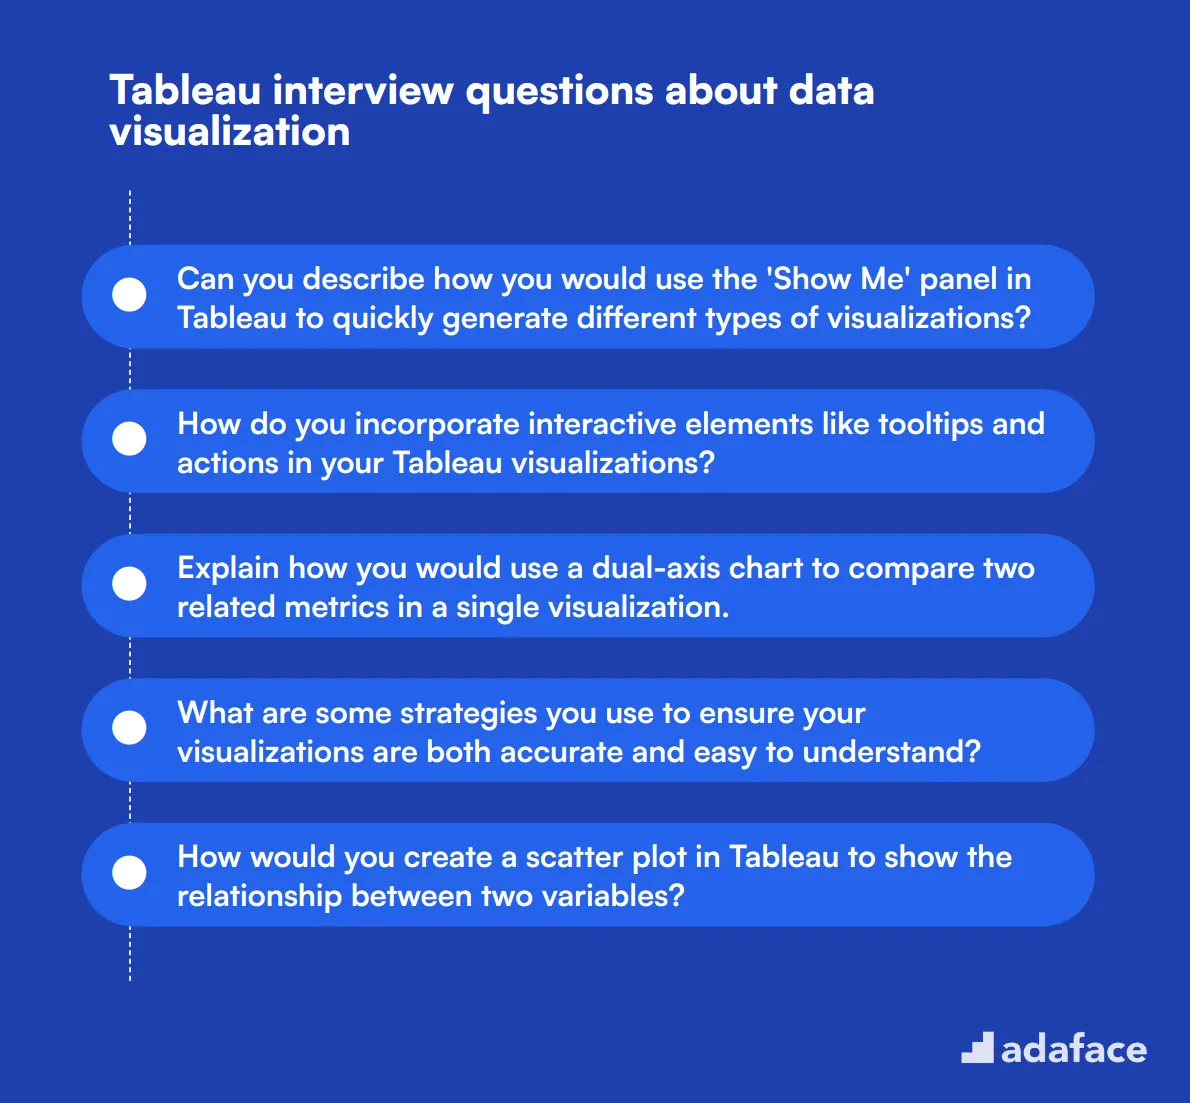
- Can you describe how you would use the 'Show Me' panel in Tableau to quickly generate different types of visualizations?
- How do you incorporate interactive elements like tooltips and actions in your Tableau visualizations?
- Explain how you would use a dual-axis chart to compare two related metrics in a single visualization.
- What are some strategies you use to ensure your visualizations are both accurate and easy to understand?
- How would you create a scatter plot in Tableau to show the relationship between two variables?
- Can you describe how to use reference lines in Tableau to highlight key thresholds in your data?
- How would you approach creating a heat map to visualize data density or distribution?
- What methods do you use to handle large datasets in Tableau to ensure performance remains optimal?
- How do you use color effectively in your Tableau visualizations to convey meaning without overwhelming the viewer?
- Can you explain the process of creating a story in Tableau to narrate your data insights?
- How would you use the 'Trend Line' feature in Tableau to identify patterns in your data?
- Describe how you would create and use a dashboard action to filter data across multiple visualizations.
7 Tableau interview questions and answers related to dashboard creation
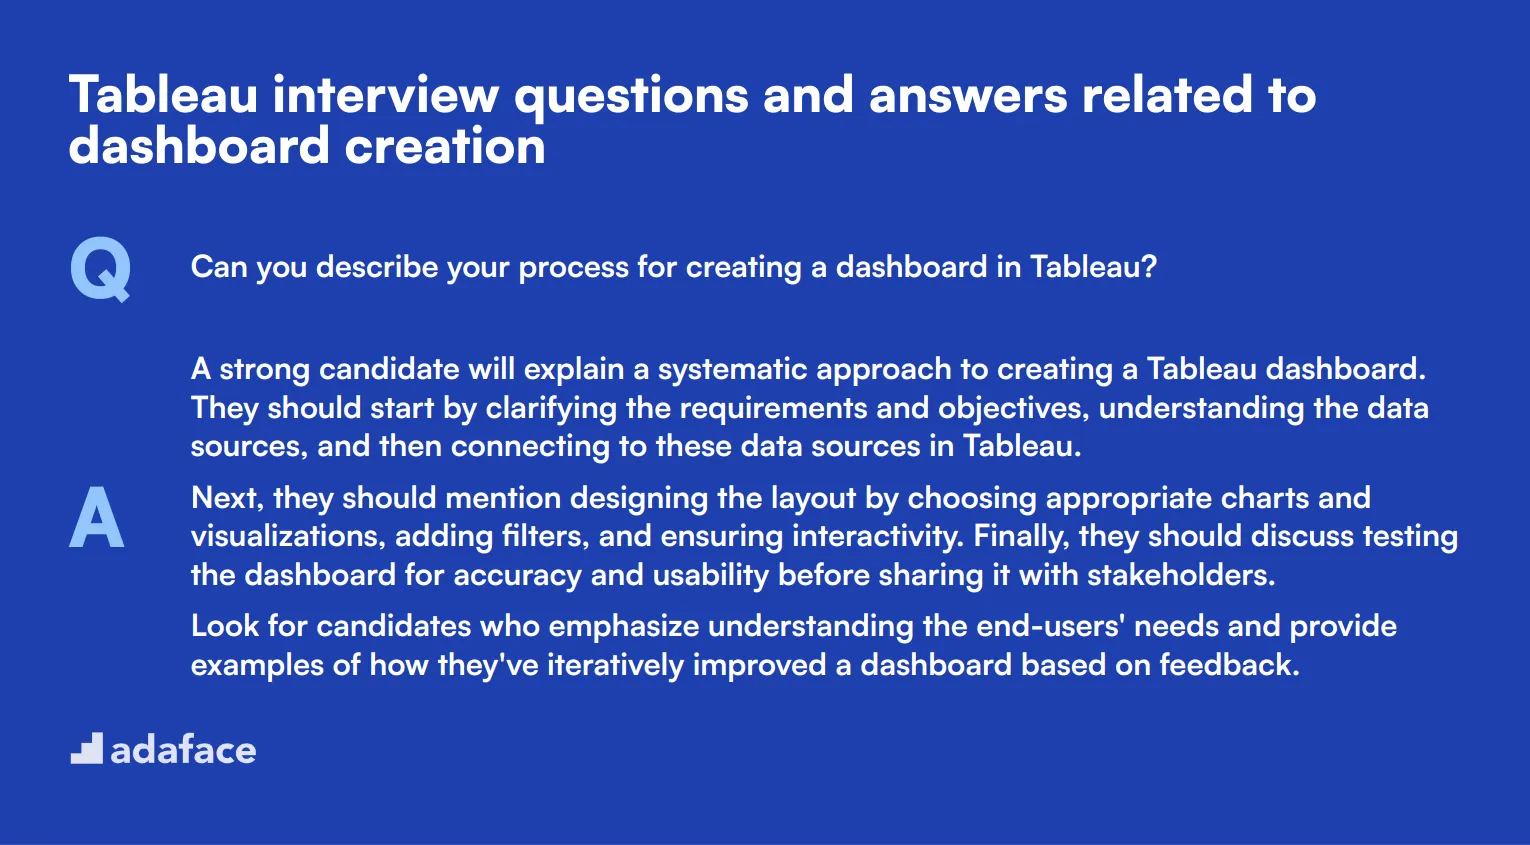
To make sure your candidates can create effective and insightful Tableau dashboards, use these interview questions. They will help you evaluate their skills in designing and implementing dashboards that not only look good but also deliver valuable insights.
1. Can you describe your process for creating a dashboard in Tableau?
A strong candidate will explain a systematic approach to creating a Tableau dashboard. They should start by clarifying the requirements and objectives, understanding the data sources, and then connecting to these data sources in Tableau.
Next, they should mention designing the layout by choosing appropriate charts and visualizations, adding filters, and ensuring interactivity. Finally, they should discuss testing the dashboard for accuracy and usability before sharing it with stakeholders.
Look for candidates who emphasize understanding the end-users' needs and provide examples of how they've iteratively improved a dashboard based on feedback.
2. How do you ensure your Tableau dashboards are user-friendly?
Candidates should focus on several key aspects such as intuitive design, clear labeling, and logical flow. They should mention using consistent colors, fonts, and spacing to make the dashboard aesthetically pleasing and easy to read.
They should also discuss the importance of user testing, gathering feedback, and making iterative improvements to enhance usability. Additionally, candidates may talk about using filters and interactive features to allow users to drill down into the data.
An ideal response will include specific strategies they use to make dashboards user-friendly and examples of feedback they've acted upon to improve usability.
3. What steps do you take to ensure data accuracy in your Tableau dashboards?
Candidates should explain the importance of validating data sources and performing data quality checks before building the dashboard. They might mention cross-referencing data with other reliable sources and using Tableau's data blending features to combine data accurately.
They should also highlight the importance of regularly updating data connections to ensure the dashboard reflects the latest information. Using calculated fields and filters carefully to avoid data misinterpretation is another crucial step.
Look for candidates who demonstrate a thorough understanding of data validation techniques and emphasize the importance of ongoing data accuracy checks.
4. How do you prioritize which insights to display on a Tableau dashboard?
A good candidate will discuss the importance of understanding the dashboard's audience and their specific needs. They should prioritize displaying insights that are most relevant to the key questions or objectives identified by stakeholders.
They might mention using key performance indicators (KPIs) and focusing on actionable insights. Ensuring that the most critical data is easily accessible and highlighting trends or outliers that require attention is also essential.
Ideal responses will include examples of how they've worked with stakeholders to determine the most important insights and how they've adjusted dashboards based on feedback.
5. Can you explain how you use Tableau's interactive features to enhance a dashboard?
Candidates should mention various interactive features like filters, parameters, and actions. They might explain how filters allow users to view specific subsets of data and how parameters can be used to switch between different metrics or views.
They should also discuss using dashboard actions, such as highlight actions, filter actions, and URL actions, to create a more engaging and dynamic user experience.
Look for candidates who provide examples of how they've used these features to make dashboards more interactive and user-friendly, enhancing the overall value of the insights provided.
6. How do you approach the design of a Tableau dashboard to ensure it tells a compelling story?
Candidates should describe starting with a clear objective or key message that the dashboard needs to convey. They should organize the dashboard in a logical flow that guides the user through the data story, using charts and visualizations that are easy to interpret.
They might mention using annotations and tooltips to provide additional context and ensuring that the design is clean and not cluttered with unnecessary elements. Consistent use of colors and fonts to maintain a professional look is also important.
An ideal response will include examples of dashboards they've designed that effectively told a story and how the design elements contributed to the narrative.
7. What are some common mistakes to avoid when creating a Tableau dashboard?
Candidates should mention avoiding common pitfalls such as overloading the dashboard with too many visualizations, using inconsistent or overly bright colors, and failing to test the dashboard with actual users.
They should also highlight the importance of not ignoring performance considerations—like optimizing queries and avoiding complex calculations that slow down the dashboard. Ensuring the dashboard is mobile-friendly is another common oversight to avoid.
Look for candidates who can identify these mistakes and provide examples of how they've addressed them in their previous work, demonstrating a proactive approach to creating effective dashboards.
9 situational Tableau interview questions with answers for hiring top analysts
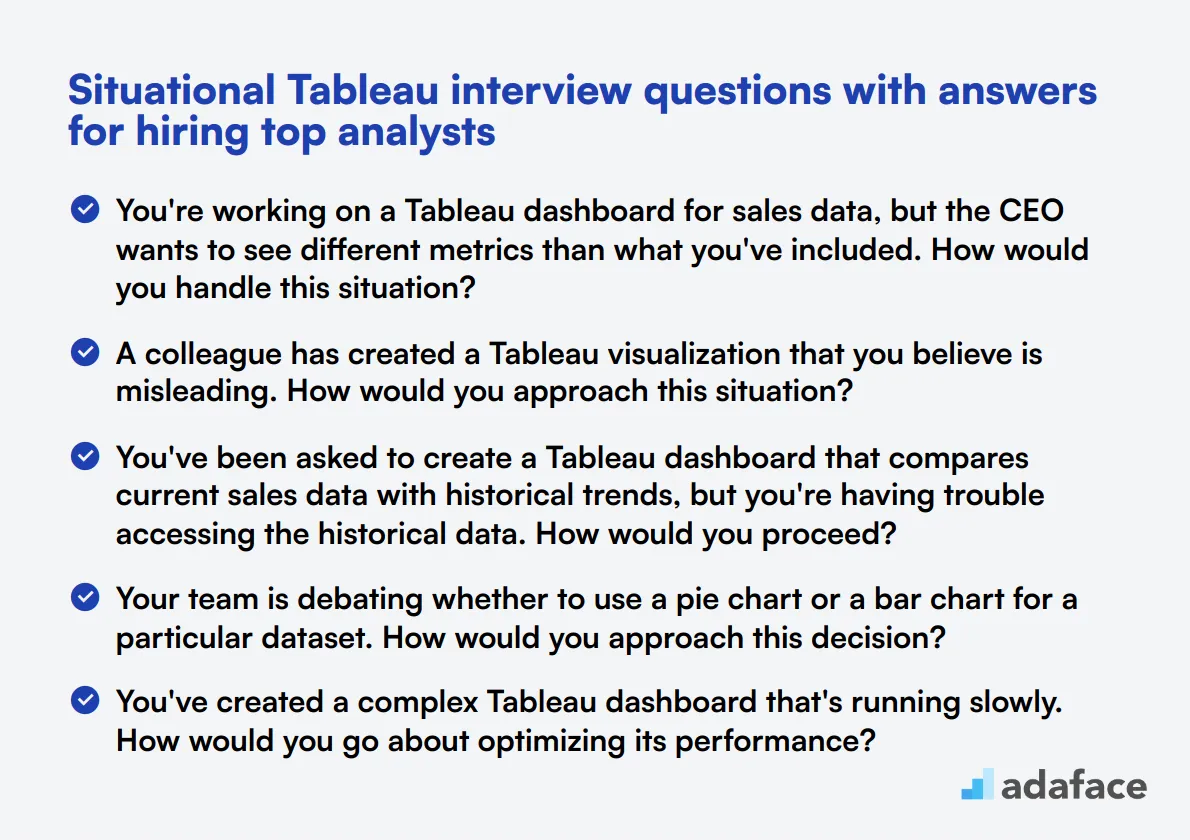
To assess whether your Tableau analyst candidates can handle real-world scenarios and make informed decisions, consider using these 9 situational interview questions. These questions will help you evaluate a candidate's problem-solving skills, creativity, and ability to apply Tableau knowledge in practical contexts. Remember, the best data analysts can not only crunch numbers but also think on their feet.
1. You're working on a Tableau dashboard for sales data, but the CEO wants to see different metrics than what you've included. How would you handle this situation?
A strong candidate should demonstrate flexibility and a customer-centric approach. They might respond with something like:
- Schedule a meeting with the CEO to understand their specific requirements and the reasoning behind them.
- Review the current dashboard and identify areas where the CEO's desired metrics can be incorporated.
- Create a prototype or mockup of the revised dashboard to present to the CEO for feedback.
- Implement the changes after getting approval, ensuring that the new metrics are accurately represented and easy to understand.
- Set up a follow-up meeting to walk the CEO through the new dashboard and gather any final feedback.
Look for candidates who emphasize the importance of communication, understanding stakeholder needs, and iterative development. A great response would also mention the possibility of creating custom views or using parameters to allow for dynamic metric selection, showcasing their advanced Tableau skills.
2. A colleague has created a Tableau visualization that you believe is misleading. How would you approach this situation?
An ideal response should demonstrate diplomacy, attention to detail, and a commitment to data integrity. A good answer might include:
- Carefully review the visualization to identify specific areas of concern.
- Gather relevant data and best practices to support your perspective.
- Approach the colleague privately and respectfully to discuss your observations.
- Offer constructive suggestions for improvement, focusing on enhancing the clarity and accuracy of the visualization.
- If necessary, collaborate with the colleague to revise the visualization.
Look for candidates who emphasize the importance of maintaining positive working relationships while ensuring data accuracy. A strong answer might also mention the possibility of seeking a second opinion from another team member or suggesting a peer review process for future visualizations to prevent similar issues.
3. You've been asked to create a Tableau dashboard that compares current sales data with historical trends, but you're having trouble accessing the historical data. How would you proceed?
A competent candidate should demonstrate problem-solving skills and resourcefulness. A good response might include:
- Identify the specific historical data needed and potential sources within the organization.
- Reach out to the IT department or data management team to understand any access issues.
- Explore alternative data sources or proxies that could provide similar insights.
- Consider using Tableau's data blending or join features to combine available current data with any accessible historical data.
- If necessary, create a prototype dashboard using available data and clearly communicate any limitations to stakeholders.
Look for candidates who show initiative in finding solutions and clear communication skills. A strong answer might also mention the importance of documenting the process and any workarounds used, as well as suggesting improvements to data access procedures for future projects.
4. Your team is debating whether to use a pie chart or a bar chart for a particular dataset. How would you approach this decision?
A knowledgeable candidate should demonstrate an understanding of data visualization best practices. A good answer might include:
- Analyze the nature of the data: Is it showing parts of a whole (pie chart) or comparing categories (bar chart)?
- Consider the number of categories: Pie charts work best with fewer categories (ideally 5-7), while bar charts can handle more.
- Evaluate the importance of precise comparisons: Bar charts allow for more accurate comparisons between categories.
- Think about the audience and their familiarity with different chart types.
- Create prototypes of both chart types and compare their effectiveness in conveying the intended message.
Look for candidates who emphasize the importance of choosing visualizations that best communicate the data's story. A strong answer might also mention the possibility of using alternative chart types, such as a treemap or stacked bar chart, depending on the specific data and goals of the visualization.
5. You've created a complex Tableau dashboard that's running slowly. How would you go about optimizing its performance?
An experienced candidate should demonstrate knowledge of Tableau performance optimization techniques. A good response might include:
- Analyze the dashboard using Tableau's Performance Recorder to identify bottlenecks.
- Simplify complex calculations by pre-aggregating data or moving calculations to the data source level.
- Use extracts instead of live connections where possible to improve query performance.
- Implement filters efficiently, using context filters for large datasets.
- Reduce the number of marks displayed by aggregating data or using parameters to limit the view.
- Optimize the underlying data source by creating appropriate indexes or materialized views.
Look for candidates who show a systematic approach to problem-solving and a deep understanding of Tableau's functionality. A strong answer might also mention the importance of balancing performance with user experience and data granularity, as well as suggesting ongoing performance monitoring and optimization.
6. A stakeholder is insisting on using a 3D chart in a Tableau visualization, which you believe is not the best choice. How would you handle this situation?
A tactful candidate should demonstrate the ability to educate stakeholders while maintaining positive relationships. A good answer might include:
- Listen to the stakeholder's reasoning for wanting a 3D chart and acknowledge their perspective.
- Explain the potential drawbacks of 3D charts, such as difficulty in accurate data interpretation and potential visual distortion.
- Present alternative 2D visualization options that effectively convey the same information.
- Create side-by-side comparisons of the 3D chart and proposed alternatives to demonstrate the differences in clarity and accuracy.
- If the stakeholder still insists, consider creating both versions and conducting a small user test to gather feedback.
Look for candidates who can balance diplomacy with data visualization best practices. A strong answer might also mention the importance of understanding the stakeholder's underlying goals for the visualization and suggesting ways to achieve those goals without resorting to 3D charts.
7. You're tasked with creating a Tableau dashboard for a new product launch, but the data is still incomplete. How would you approach this challenge?
A resourceful candidate should demonstrate the ability to work with limited data while planning for future improvements. A good response might include:
- Identify the key metrics and data points essential for the product launch dashboard.
- Use available data to create an initial version of the dashboard, clearly indicating any data gaps.
- Implement placeholder visualizations or text boxes for missing data, explaining what will be shown once the data is available.
- Design the dashboard with flexibility in mind, allowing for easy addition of new data sources or metrics.
- Create a plan for updating the dashboard as new data becomes available, including automated refresh schedules if possible.
Look for candidates who emphasize clear communication with stakeholders about data limitations and future improvements. A strong answer might also mention the use of Tableau's data blending features to combine available data from multiple sources, or the possibility of using predictive analytics to estimate missing data points where appropriate.
8. You notice that a Tableau report you've created is being misinterpreted by some users. How would you address this issue?
A responsible candidate should demonstrate a commitment to clear communication and user understanding. A good answer might include:
- Gather specific feedback from users to understand where and how the misinterpretation is occurring.
- Review the report design, focusing on areas that may be causing confusion.
- Consider adding explanatory text, tooltips, or legends to clarify potentially ambiguous elements.
- Simplify complex visualizations or break them down into multiple, easier-to-understand views.
- Create a brief user guide or conduct a short training session to walk users through the correct interpretation of the report.
Look for candidates who prioritize user comprehension and are willing to iterate on their designs. A strong answer might also mention the importance of user testing during the design phase to catch potential misinterpretations early, as well as suggesting the implementation of a feedback mechanism for ongoing improvement.
9. You're working on a Tableau project where the data needs to be refreshed daily, but the process is manual and time-consuming. How would you improve this workflow?
An efficient candidate should demonstrate knowledge of automation and data management best practices. A good response might include:
- Evaluate the current data refresh process to identify bottlenecks and inefficiencies.
- Explore Tableau's built-in scheduling and automation features for data refreshes.
- Consider using Tableau Server or Tableau Online for automated extract refreshes.
- Investigate the possibility of setting up direct database connections with live queries where appropriate.
- Look into using APIs or scripting languages (e.g., Python) to automate data preprocessing and loading.
Look for candidates who show initiative in improving processes and have a good understanding of data pipeline concepts. A strong answer might also mention the importance of documenting the new automated process, setting up monitoring and error notifications, and considering the impact on server resources when implementing automated refreshes.
Which Tableau skills should you evaluate during the interview phase?
While it's challenging to fully gauge a candidate's capabilities in a single interview, focusing on key Tableau skills can provide a clear snapshot of their competence. This section will outline the essential skills to assess during the Tableau interview phase, ensuring a candidate not only understands the tool but can also effectively utilize it to drive business insight.
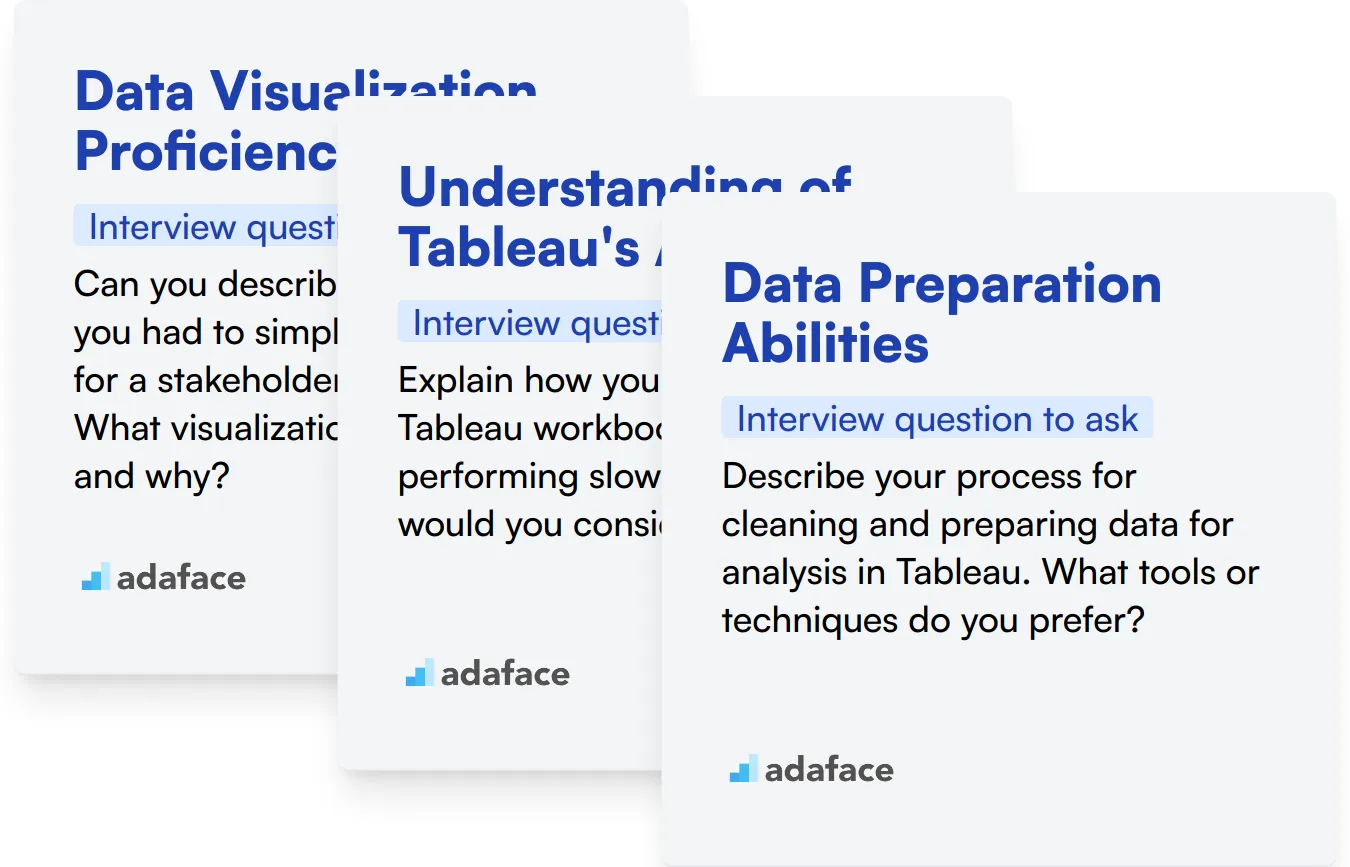
Data Visualization Proficiency
To preliminarily assess this skill, consider implementing a multiple-choice quiz that tests the understanding of various chart types, best practices in visualization, and interpretation of data visualizations. Our Tableau Online Test could be an excellent tool for this purpose.
In addition to MCQs, it's beneficial to ask direct questions about data visualization during the interview to evaluate the candidate's practical skills and creative thinking.
Can you describe a time when you had to simplify complex data for a stakeholder using Tableau? What visualization did you choose and why?
Look for detailed explanations about choice of visualization based on the data type and audience. The candidate should demonstrate not only technical know-how but also an understanding of how visual data can influence decision-making.
Understanding of Tableau's Architecture
A set of well-structured MCQs can help identify candidates with a strong grasp of Tableau’s backend processes, including server management and data connectors. This skill assessment is crucial for roles requiring advanced Tableau usage.
To delve deeper into their architectural knowledge, pose scenario-based questions that reveal their depth of understanding.
Explain how you would optimize a Tableau workbook that is performing slowly. What factors would you consider?
The response should demonstrate the candidate’s ability to diagnose performance issues and their knowledge of Tableau’s workings, such as data extraction and efficient design of dashboards.
Data Preparation Abilities
In the interview, ask specific questions aimed at understanding their expertise in preparing data for detailed analyses.
Describe your process for cleaning and preparing data for analysis in Tableau. What tools or techniques do you prefer?
Candidates should demonstrate a methodical approach to data preparation, highlighting their knowledge of Tableau’s data blending and cleaning features, and possibly SQL or Python scripts for data manipulation.
Effective Strategies for Leveraging Tableau Interview Questions
Before you begin to put the insights from this post into practice, here are some strategic tips to make the most of Tableau interview questions in your hiring process.
1. Pre-interview Skills Testing
Initiating the interview process with a skills test can significantly streamline candidate evaluation. By assessing applicants' Tableau skills beforehand, you ensure only qualified candidates reach the interview stage.
Consider using assessments like the Tableau Online Test or related evaluations such as the Data Analysis Test to gauge essential skills. These tests provide a practical understanding of the candidates' abilities, helping you focus on top prospects.
Integrating these tests into your recruitment workflow allows you to validate candidate proficiency in a controlled, measurable way. Once candidates pass this stage, the interview can then explore deeper into their strategic and situational thinking abilities.
2. Curating Targeted Interview Questions
With limited time during interviews, selecting the right questions is key to effectively evaluating candidates. Focus on questions that address crucial Tableau skills and consider integrating queries that test related competencies.
For roles involving extensive data manipulation, consider incorporating questions from the SQL Interview Questions or Data Science Interview Questions. These can help you assess candidates' ability to interact with and analyze data beyond their Tableau expertise.
This approach helps you understand how candidates might handle real-world challenges, ensuring they not only have the technical skills but also the critical thinking needed for the role.
3. The Importance of Follow-Up Questions
Relying solely on initial responses can be misleading, as candidates may prepare surface-level answers. Follow-up questions help you dive deeper and see how well candidates truly understand Tableau and its applications.
For instance, if a candidate describes a complex visualization they created, follow up by asking about the specific data challenges they faced and how they overcame them. This reveals their problem-solving process and adaptability, key traits for any analyst.
Leveraging Tableau Skills Tests to Identify Top Talent
When hiring for roles requiring Tableau expertise, it's important to verify candidates' skills effectively. The most reliable method to assess these skills is through specialized Tableau Online Tests. These assessments help ensure candidates possess the necessary proficiency before moving further in the hiring process.
Upon employing the Tableau skills test, recruiters can efficiently shortlist the most qualified candidates for interviews. For further steps in your recruitment process, consider visiting our sign-up page to streamline and enhance your hiring strategy.
Tableau Online Test
Download Tableau interview questions template in multiple formats
Tableau Interview Questions FAQs
Questions for junior analysts often focus on basic Tableau functionalities, data visualization principles, and familiarity with the tool’s interface.
You can ask them to explain their previous work, conduct a live demo, or solve a specific problem using Tableau during the interview.
Ask questions that present real-world scenarios to understand how candidates apply Tableau to solve data problems, create dashboards, and derive insights.
Dashboard creation is a critical feature of Tableau. Asking about it helps assess a candidate's ability to synthesize data and present it effectively.
Advanced questions might include topics like advanced calculations, performance optimization, complex data blending, and managing Tableau Server.
Hands-on experience is very important as it demonstrates practical knowledge and the ability to apply Tableau skills to real-world data challenges.

40 min skill tests.
No trick questions.
Accurate shortlisting.
We make it easy for you to find the best candidates in your pipeline with a 40 min skills test.
Try for freeRelated posts
Free resources


