
Statistics interview questions for freshers
1. What's a p-value? Imagine you're explaining it to a friend who doesn't know stats.
2. Tell me about a time you saw a graph or chart in the news that seemed misleading. What made it seem that way?
3. What's the difference between mean, median, and mode? Can you give me an example where one is better to use than the others?
4. Explain what standard deviation is in simple terms.
5. What is the Central Limit Theorem? Why is it important?
6. How would you explain the difference between correlation and causation to someone?
7. What are Type I and Type II errors in hypothesis testing?
8. Describe a situation where you might use a t-test.
9. What does it mean for data to be normally distributed?
10. What's the difference between descriptive and inferential statistics?
11. If you have a dataset with missing values, what are some ways you could handle them?
12. What is a confidence interval? How do you interpret it?
13. What are some common statistical software packages or programming languages used in data analysis?
14. How would you design a simple survey to collect data on customer satisfaction?
15. What is regression analysis? Give an example of when it might be used.
16. What are outliers? How can they affect your analysis?
17. Explain the concept of variance.
18. Why is sampling important in statistics?
19. What are some different types of data (e.g., nominal, ordinal, interval, ratio)?
20. How do you know if a statistical test is appropriate for a given situation?
21. Describe a time you used data to solve a problem.
22. What are some common data visualization techniques?
23. Explain the meaning of degrees of freedom.
Statistics interview questions for juniors
1. What does 'average' mean, and how do you find it?
2. Imagine you have a bag of candies, some red and some blue. How do you figure out which color you're more likely to pick without looking?
3. What's a 'graph', and what can it show you?
4. If someone says something is 'random', what does that mean?
5. Can you explain the difference between a bar chart and a pie chart?
6. What does it mean if something is 'likely' to happen?
7. If you roll a dice, are you more likely to get a 6 or another number?
8. What does it mean to 'predict' something?
9. How would you describe data in simple terms?
10. What is a survey, and what is it used for?
11. If you see a trend, what does it tell you?
12. Explain what a percentage means.
13. Have you ever used a spreadsheet and can you explain how?
14. If I give you a set of numbers, how would you arrange them to make sense of them?
15. Can you explain the term 'more than' and 'less than'?
16. What does it mean for something to be 'most common'?
17. What does 'probability' mean in a simple way?
18. Explain what a line graph shows.
19. How would you show the number of boys and girls in your class, in a simple graph?
20. If you were counting the number of cars that pass by, how would you note it down so you can show your friend later?
21. Explain the difference between qualitative and quantitative data.
22. If you have a lot of data, what is one way to summarize it?
23. What is a 'sample', and why do we use it?
24. What does 'correlation' mean?
25. How would you describe what 'statistics' is, to someone who has never heard of it?
26. Why is it important to collect data carefully?
Statistics intermediate interview questions
1. Explain the difference between type I and type II errors in hypothesis testing. Can you provide an example of when each type of error might occur in a real-world scenario?
2. Describe what multicollinearity is and how it can affect a regression model. How can you detect and address multicollinearity?
3. What are the assumptions of linear regression, and how can you check if these assumptions are met in a given dataset?
4. Explain the concept of p-value and its role in hypothesis testing. What are some common misconceptions about p-values?
5. Differentiate between frequentist and Bayesian approaches to statistics. What are the advantages and disadvantages of each approach?
6. Describe the Central Limit Theorem and its significance in statistics. How is it used in statistical inference?
7. What is the difference between correlation and causation? How can you determine if a relationship between two variables is causal?
8. Explain the concept of confidence intervals. How does the confidence level affect the width of the interval?
9. What are the different types of sampling methods? Provide examples of when each method might be appropriate.
10. Describe the concept of statistical power and its relationship to sample size and effect size. How can you increase the power of a statistical test?
11. Explain what regularization is in the context of machine learning. Describe L1 and L2 regularization and their differences.
12. How would you handle missing data in a statistical analysis? Discuss different imputation methods and their potential biases.
13. What is the curse of dimensionality, and how does it affect statistical modeling? What techniques can be used to mitigate it?
14. Describe the difference between parametric and non-parametric statistical tests. When would you use each type of test?
15. Explain the concept of A/B testing and its application in business decision-making. What are some potential pitfalls to avoid when conducting A/B tests?
16. What are some common data visualization techniques, and how can they be used to explore and communicate statistical findings effectively?
17. Describe the concept of time series analysis. What are some common time series models, and when are they appropriate to use?
18. Explain the concept of bootstrapping and its applications in statistical inference. How does it differ from traditional resampling methods?
19. What is survival analysis, and what types of questions can it answer? Describe some common survival analysis techniques.
20. Explain what is the role of statistics in experimentation and design? What are the key components of a well-designed experiment?
Statistics interview questions for experienced
1. How would you explain p-values to a non-technical stakeholder, and what are some common misconceptions about them?
2. Describe a situation where you used Bayesian inference. What were the benefits and drawbacks compared to a frequentist approach?
3. How do you handle multicollinearity in a regression model, and what impact does it have on the model's interpretability?
4. Explain the difference between Type I and Type II errors. How do you balance the risk of each in a real-world scenario?
5. Describe your experience with time series analysis. What models have you used, and how did you evaluate their performance?
6. How do you approach outlier detection and treatment in a dataset, and what considerations guide your decisions?
7. What is survival analysis, and in what types of situations would you apply it?
8. Explain the concept of the Central Limit Theorem and its importance in statistical inference. Can you give me a real-world example?
9. How would you design an A/B test to compare two different website designs, and what metrics would you track?
10. Describe your experience with different types of statistical distributions (e.g., normal, Poisson, binomial). When would you use each?
11. How do you assess the goodness-of-fit of a statistical model, and what methods do you use to improve it?
12. What are the key assumptions of linear regression, and how do you check if they are met?
13. Explain the concept of regularization in machine learning. How do L1 and L2 regularization differ, and when would you use each?
14. Describe a situation where you had to deal with missing data. What imputation techniques did you use, and why?
15. How do you approach feature selection in a high-dimensional dataset, and what criteria do you use to evaluate the selected features?
16. Explain the concept of statistical power and its importance in hypothesis testing. How do you calculate the required sample size for a study?
17. How do you validate a statistical model to ensure it generalizes well to new data?
18. Describe your experience with causal inference. What methods have you used to estimate causal effects, and what are the limitations of each?
19. How do you handle imbalanced datasets in classification problems, and what metrics do you use to evaluate model performance?
20. Explain the difference between parametric and non-parametric statistical methods. When would you use each?
21. How would you explain hierarchical modeling to someone without a statistics background, and what are its advantages?
22. Describe a time when you had to communicate complex statistical results to a non-technical audience. What strategies did you use?
23. What are some ethical considerations when working with statistical data, and how do you ensure responsible data analysis?
24. Explain what a statistical interaction is, and how you would test for one in a regression model.
25. Describe a challenging statistical problem you faced and how you overcame it.
26. How do you stay up-to-date with the latest developments in the field of statistics?
27. What is the difference between fixed and random effects in a statistical model, and when is each appropriate?
28. Explain the concept of propensity score matching and how it can be used to reduce bias in observational studies.
29. How would you design a statistical model to predict customer churn for a subscription-based service?

Statistics is the grammar of data science and a critical skill for many roles; recruiters need to assess candidates effectively to ensure they are hiring the right talent. Hiring managers often need a curated list of questions to gauge candidates' aptitude in this field, especially given the importance of excel in business.
This blog post provides a categorized list of statistics interview questions, ranging from freshers to experienced professionals, including MCQs. It is designed to provide interviewers with a structured approach to evaluating candidates' statistical knowledge and problem-solving abilities.
By using these questions, you can better assess a candidate’s fit for the role and their ability to contribute meaningfully to your team. Consider using Adaface's statistics online test to filter candidates before the interview.
Table of contents
Statistics interview questions for freshers
Statistics interview questions for juniors
Statistics intermediate interview questions
Statistics interview questions for experienced
Statistics MCQ
Which Statistics skills should you evaluate during the interview phase?
Streamline Your Statistics Hiring with Skills Tests and Targeted Questions
Download Statistics interview questions template in multiple formats
Statistics interview questions for freshers
1. What's a p-value? Imagine you're explaining it to a friend who doesn't know stats.
Imagine you're flipping a coin and trying to figure out if it's fair. A p-value is like asking: "If the coin were fair, how likely would I be to see results as weird (or even weirder) than what I actually got?" A small p-value (usually less than 0.05) means your results are pretty unlikely if the coin were fair, so you might start to suspect the coin is biased.
So, basically, it helps you decide if your observations are just random chance, or if something real might be going on. Lower the p-value, stronger the evidence against the assumption that nothing is really happening (the 'null hypothesis').
2. Tell me about a time you saw a graph or chart in the news that seemed misleading. What made it seem that way?
I once saw a bar chart on a news website comparing crime rates in different cities. The y-axis, representing the crime rate, didn't start at zero. This visually exaggerated the differences between the cities, making some seem far more dangerous than they actually were relative to others. By truncating the y-axis, a small difference in crime rate appeared much larger.
Specifically, if city A had a crime rate of 10 per 1000 people and city B had a crime rate of 12 per 1000 people, and the y-axis started at 8, the bar for city B would appear much more than just 20% taller than city A's bar. It's a common tactic to manipulate perception.
3. What's the difference between mean, median, and mode? Can you give me an example where one is better to use than the others?
Mean, median, and mode are all measures of central tendency in a dataset. The mean is the average (sum of all values divided by the number of values). The median is the middle value when the data is sorted. The mode is the value that appears most frequently.
The median is often preferred over the mean when the data has outliers. For example, consider a dataset of salaries: $40,000, $50,000, $60,000, $70,000, $1,000,000. The mean is $244,000, which is heavily skewed by the outlier. The median is $60,000, which is a more representative measure of the typical salary.
4. Explain what standard deviation is in simple terms.
Standard deviation is a number that tells you how spread out a set of data is. A low standard deviation means the numbers are close to the average (mean), while a high standard deviation means the numbers are more spread out.
Think of it like this: If everyone in a class scored almost the same on a test, the standard deviation would be low. But if some students scored very high and others scored very low, the standard deviation would be high, indicating greater variability in the scores.
5. What is the Central Limit Theorem? Why is it important?
The Central Limit Theorem (CLT) states that the distribution of sample means approximates a normal distribution as the sample size gets larger, regardless of the population's distribution. This holds true even if the population is not normally distributed, as long as the sample size is sufficiently large (typically n > 30). Importantly, the mean of the sample means will be equal to the population mean, and the standard deviation of the sample means (standard error) will be equal to the population standard deviation divided by the square root of the sample size.
It's important because it allows us to make inferences about a population without needing to know its exact distribution. For example, we can use the CLT to perform hypothesis testing, construct confidence intervals, and estimate population parameters, even when the population distribution is unknown or non-normal. It's a fundamental tool in statistical analysis and data science.
6. How would you explain the difference between correlation and causation to someone?
Correlation and causation are often confused, but they represent different relationships between variables. Correlation simply means that two variables are related or move together. For example, ice cream sales and crime rates might both increase during the summer. This doesn't mean eating ice cream causes crime, or vice versa. There might be a lurking variable such as temperature which is the actual cause for both. It could also be spurious, or a chance relationship.
Causation, on the other hand, means that one variable directly causes a change in another. If you increase the amount of fertilizer a plant receives (all other things being equal), and the plant grows taller as a result, you can infer causation. Establishing causation often requires controlled experiments, where you manipulate one variable and observe its effect on another, while controlling for other factors.
7. What are Type I and Type II errors in hypothesis testing?
Type I and Type II errors occur in hypothesis testing when we make incorrect conclusions about the null hypothesis. A Type I error (also known as a false positive) happens when we reject the null hypothesis even though it's actually true. Think of it as claiming there's an effect when there isn't one. The probability of making a Type I error is denoted by α (alpha).
Conversely, a Type II error (also known as a false negative) occurs when we fail to reject the null hypothesis when it is actually false. In other words, we miss a real effect. The probability of making a Type II error is denoted by β (beta).
8. Describe a situation where you might use a t-test.
A t-test is used to determine if there is a significant difference between the means of two groups. For example, you might use a t-test to compare the average test scores of students who received a new teaching method versus those who received the traditional method. The independent variable would be the teaching method (new vs. traditional), and the dependent variable would be the test scores. We are trying to see if the difference in test scores is large enough to be statistically significant, implying the new method has an effect.
9. What does it mean for data to be normally distributed?
For data to be normally distributed, it means that the values tend to cluster around a central average. When plotted as a histogram or curve, it forms a bell shape, symmetrical around the mean. Most data points are close to the mean, with fewer points trailing off symmetrically in both directions.
Key characteristics include:
- Symmetry: The left and right sides of the distribution are mirror images.
- Mean, Median, and Mode are Equal: The average, middle value, and most frequent value are all the same.
- Bell Shape: The curve is highest in the middle and tapers off gradually towards the tails.
- Standard Deviation: A measure of how spread out the data is from the mean. Approximately 68% of the data falls within one standard deviation of the mean, 95% within two, and 99.7% within three.
10. What's the difference between descriptive and inferential statistics?
Descriptive statistics involve summarizing and presenting data in a meaningful way. This includes calculating measures like mean, median, mode, standard deviation, and creating charts and graphs. Descriptive statistics describe the characteristics of a dataset without making inferences beyond the data at hand.
Inferential statistics, on the other hand, use sample data to make predictions or generalizations about a larger population. This involves techniques like hypothesis testing, confidence intervals, and regression analysis. Inferential statistics infer conclusions about a population based on a sample.
11. If you have a dataset with missing values, what are some ways you could handle them?
There are several ways to handle missing values in a dataset. Some common techniques include:
- Deletion: You can remove rows or columns with missing values. This is suitable if the missing data is a small percentage of the total dataset and doesn't introduce bias. However, be cautious, as you might lose valuable information.
- Imputation: You can replace missing values with estimated values. Common imputation methods include:
- Mean/Median Imputation: Replacing missing values with the mean or median of the column. Simple but can distort distributions.
- Mode Imputation: Replacing missing values with the mode (most frequent value) of the column. Useful for categorical features.
- Regression Imputation: Using regression models to predict missing values based on other features.
- K-Nearest Neighbors (KNN) Imputation: Imputing missing values based on the values of similar data points.
- Using Algorithms that Handle Missing Data: Some machine learning algorithms (like XGBoost) can naturally handle missing values without requiring imputation.
- Creating a Missing Value Indicator: You can create a new binary feature that indicates whether a value was missing or not. This can help the model learn if the missingness itself is informative.
The best approach depends on the nature of the missing data, the size of the dataset, and the goals of the analysis. Always analyze the potential bias introduced by your chosen method.
12. What is a confidence interval? How do you interpret it?
A confidence interval is a range of values that, with a certain degree of confidence, contains the true population parameter. It's a way to estimate the uncertainty associated with a sample statistic.
For example, a 95% confidence interval means that if we were to take many samples and calculate confidence intervals for each sample, approximately 95% of those intervals would contain the true population parameter. It does not mean there's a 95% chance the true parameter falls within this specific calculated interval. It reflects the reliability of the estimation process, not a probability about the parameter itself.
13. What are some common statistical software packages or programming languages used in data analysis?
Several statistical software packages and programming languages are widely used in data analysis. Some common options include:
- R: A powerful programming language and environment specifically designed for statistical computing and graphics. It offers a vast collection of packages for various statistical techniques.
- Python: A versatile general-purpose programming language with libraries like NumPy, Pandas, Scikit-learn, and Statsmodels that are extensively used for data manipulation, analysis, and machine learning.
- SAS: A comprehensive statistical software suite often used in business and academic settings.
- SPSS: A user-friendly statistical software package with a graphical interface, popular for social sciences and market research.
- Stata: Another statistical software package commonly used in econometrics and biostatistics.
- MATLAB: A numerical computing environment and programming language that is useful for complex calculations and simulations.
These tools offer a range of functionalities, from basic descriptive statistics to advanced modeling techniques. The choice of tool depends on factors like the complexity of the analysis, the size of the dataset, user preference, and available resources.
14. How would you design a simple survey to collect data on customer satisfaction?
To design a simple customer satisfaction survey, I would focus on brevity and clarity. The core of the survey would involve a few key questions using a rating scale (e.g., 1-5 stars, or "Very Dissatisfied" to "Very Satisfied"). Key questions include: "Overall, how satisfied were you with your experience?", "How likely are you to recommend us to a friend?", and "How would you rate the quality of our product/service?".
I'd also include one open-ended question like "What could we do to improve?". This allows customers to provide specific feedback. The survey should be easily accessible (e.g., via a link in an email or on a website), mobile-friendly, and take no more than a few minutes to complete. Thank the customer for their time at the end.
15. What is regression analysis? Give an example of when it might be used.
Regression analysis is a statistical method used to model the relationship between a dependent variable and one or more independent variables. It helps to understand how the typical value of the dependent variable changes when any one of the independent variables is varied, while the other independent variables are held fixed. The goal is often to predict or estimate the value of the dependent variable based on the values of the independent variables.
For example, regression analysis could be used to predict house prices based on features like square footage, number of bedrooms, and location. Another example is predicting sales revenue based on advertising spend. The model quantifies the impact of each feature on the predicted outcome.
16. What are outliers? How can they affect your analysis?
Outliers are data points that significantly deviate from the other values in a dataset. They are extreme values that lie far outside the typical range of the data.
Outliers can negatively affect your analysis in several ways. They can skew statistical measures like the mean and standard deviation, leading to inaccurate conclusions. They can also distort the relationships between variables, making it difficult to identify underlying patterns. Furthermore, in machine learning, outliers can negatively impact model training, potentially leading to biased or less accurate models. For instance, they can inflate the error metric used to train the model or cause the model to overfit to the outlier.
17. Explain the concept of variance.
Variance measures how spread out a set of numbers is. Specifically, it is the average of the squared differences from the mean. A high variance indicates that the data points are very spread out from the mean, and a low variance indicates that they are clustered closely around the mean.
In simpler terms, variance helps you understand the degree of deviation of data points in a dataset from the average value. It is a key component in many statistical analyses, often used in conjunction with standard deviation (which is the square root of variance) for easier interpretation because standard deviation is in the original unit of measurement.
18. Why is sampling important in statistics?
Sampling is crucial in statistics because it's often impractical or impossible to study an entire population. Imagine trying to survey every person in a country – the cost, time, and resources required would be astronomical. Sampling allows us to select a representative subset of the population and draw inferences about the entire group based on the data collected from the sample. This significantly reduces the burden of data collection and analysis.
A well-chosen sample allows us to estimate population parameters (like the mean or proportion) with a reasonable degree of accuracy. Without sampling, we'd be limited to studying only small, easily accessible populations, which might not be representative of the broader world. Sound statistical inference relies heavily on the principles of sampling to ensure that our conclusions are generalizable and reliable.
19. What are some different types of data (e.g., nominal, ordinal, interval, ratio)?
Different types of data, often referred to as levels of measurement, categorize data based on the properties and operations that can be performed on them. The four main types are nominal, ordinal, interval, and ratio.
- Nominal: This is categorical data where values are labels or names with no inherent order (e.g., colors like "red", "blue", "green", or types of fruit like "apple", "banana", "orange"). You can only determine equality or inequality. Operations like calculating the average are meaningless.
- Ordinal: This is also categorical data, but the values have a meaningful order or ranking (e.g., customer satisfaction levels like "very dissatisfied", "dissatisfied", "neutral", "satisfied", "very satisfied", or educational levels like "high school", "bachelor's", "master's", "doctoral"). You can determine the order but not the magnitude of difference between values.
- Interval: This is numerical data where the intervals between values are equal and meaningful, but there's no true zero point (e.g., temperature in Celsius or Fahrenheit). You can calculate differences, but ratios are not meaningful.
- Ratio: This is numerical data with equal intervals and a true zero point (e.g., height, weight, age, or income). You can perform all arithmetic operations, including calculating ratios.
20. How do you know if a statistical test is appropriate for a given situation?
To determine if a statistical test is appropriate, consider several factors. First, identify the type of data you're working with (e.g., continuous, categorical). Then, understand the research question you're trying to answer and the hypothesis you want to test. For example, are you comparing means, looking for correlations, or analyzing frequencies? Finally, check the assumptions of the statistical test. Each test has underlying assumptions about the data's distribution (e.g., normality), independence, and homogeneity of variance. If the data violates these assumptions, the test results might be invalid or misleading.
Specifically, check if:
- The data is normally distributed if the test requires it.
- The samples are independent.
- The variances are equal across groups (if applicable).
If assumptions are not met, consider data transformations or non-parametric alternatives.
21. Describe a time you used data to solve a problem.
In my previous role as a marketing analyst, we were experiencing a high churn rate for our new subscription service. Initial analysis pointed to a problem with user onboarding, but we lacked specific insights. I used SQL to query our user database, segmenting users based on their engagement with various onboarding steps (e.g., tutorial completion, feature usage within the first week). I then calculated the churn rate for each segment. The data revealed that users who didn't complete the interactive tutorial within 48 hours had a significantly higher churn rate (over 30% higher) than those who did.
Based on this analysis, we redesigned the onboarding process to emphasize the importance of the tutorial and made it more engaging. We also implemented automated email reminders for users who hadn't completed it within the first day. After implementing these changes, the overall churn rate for new subscribers decreased by 15% within the following month, demonstrating the effectiveness of the data-driven approach.
22. What are some common data visualization techniques?
Common data visualization techniques include:
- Bar charts: Used to compare categorical data.
- Line charts: Show trends over time.
- Scatter plots: Display the relationship between two variables.
- Histograms: Show the distribution of a single variable.
- Pie charts: Represent proportions of a whole. These are generally discouraged and better represented by bar charts.
- Box plots: Display the distribution of data through quartiles.
- Heatmaps: Represent the magnitude of a phenomenon as color in two dimensions.
- Geographic maps: Visualize data on a geographical map (e.g., choropleth maps).
These techniques help in understanding patterns, trends, and relationships within data, making it easier to communicate insights effectively. Choosing the appropriate visualization depends on the type of data and the insights you want to convey.
23. Explain the meaning of degrees of freedom.
Degrees of freedom (DF) represent the number of independent pieces of information available to estimate a parameter. In simpler terms, it's the number of values in the final calculation of a statistic that are free to vary.
For example, if you have 10 data points and you calculate the mean, you have 9 degrees of freedom. This is because once you know the mean and 9 of the data points, the 10th data point is fixed. The formula often looks like: DF = n - k, where n is the sample size and k is the number of parameters being estimated.
Statistics interview questions for juniors
1. What does 'average' mean, and how do you find it?
The 'average' (also known as the mean) is a measure of central tendency in a set of numbers. It represents a typical or central value in the data.
To find the average, you sum all the numbers in the set and then divide by the total number of values in the set. For example, the average of 2, 4, and 6 is (2 + 4 + 6) / 3 = 4.
2. Imagine you have a bag of candies, some red and some blue. How do you figure out which color you're more likely to pick without looking?
To figure out which color candy you're more likely to pick, you need to know the number of candies of each color in the bag. If there are more red candies than blue candies, you're more likely to pick a red one. Conversely, if there are more blue candies, you're more likely to pick a blue one.
If you don't know the exact numbers, you could repeatedly pick a candy, note its color, and put it back in the bag (sampling with replacement). After many repetitions, the proportion of times you picked each color will give you an estimate of how likely you are to pick that color in a single draw.
3. What's a 'graph', and what can it show you?
A graph is a data structure consisting of nodes (vertices) connected by edges. It's a way to represent relationships between objects. Unlike trees, graphs can have cycles, and nodes can have multiple parents.
Graphs can show you: connections between entities (social networks, transportation routes), relationships (dependencies in software projects), flow (network traffic, resource allocation), and structures (circuit diagrams, molecular structures). They are versatile for modeling many real-world scenarios. They help visualize data and can be used to solve shortest path problems, find connected components, and model complex relationships.
4. If someone says something is 'random', what does that mean?
When someone says something is 'random', they typically mean it lacks a predictable pattern or purpose. The outcome is determined by chance and cannot be easily foreseen. It suggests that all possibilities have an equal or near-equal chance of occurring, without any specific bias or influence.
In a more technical context, like programming, 'random' often refers to pseudo-randomness. Computers use algorithms to generate sequences of numbers that appear random, but are actually deterministic, meaning they are based on an initial seed value. True randomness, in contrast, would come from a source of entropy, like atmospheric noise.
5. Can you explain the difference between a bar chart and a pie chart?
Bar charts and pie charts are both used to visualize data, but they display information differently. A bar chart uses rectangular bars to represent data values, with the length of each bar proportional to the value it represents. This makes it easy to compare the magnitudes of different categories or track changes over time. Pie charts, on the other hand, display data as slices of a circle, where each slice represents a proportion of the whole. Pie charts are effective for showing the relative proportions of different categories within a single dataset.
In essence, bar charts are good for comparing individual values across different categories or over time, while pie charts are better for showing the proportion of each category to the whole.
6. What does it mean if something is 'likely' to happen?
If something is 'likely' to happen, it means there's a higher than 50% probability of it occurring. It suggests that based on current evidence, past experiences, or known factors, the event is more probable than not. The degree of 'likely' can vary, but it generally implies a reasonable expectation of the event taking place.
However, 'likely' is subjective and lacks a precise numerical definition. In fields requiring more rigorous analysis, probabilities are often expressed as percentages or ratios to provide a clearer understanding of the chances of an event occurring. For example, instead of saying "it is likely to rain," a meteorologist might say "there is a 70% chance of rain."
7. If you roll a dice, are you more likely to get a 6 or another number?
You are equally likely to get a 6 or any other number (1, 2, 3, 4, or 5) when rolling a fair six-sided die. Each face has a probability of 1/6 of being rolled.
Therefore, the probability of rolling a 6 is the same as the probability of rolling any other single number. You are not more likely to roll a 6 than any other specific number. However, you are more likely to roll not a 6 (5/6 probability) than a 6 (1/6 probability).
8. What does it mean to 'predict' something?
To 'predict' something means to estimate or forecast a future event or outcome based on available information and patterns. It involves using data, experience, or intuition to make an informed guess about what will happen. The accuracy of a prediction can vary widely depending on the quality of the input data and the complexity of the system being predicted.
For example, in machine learning, a prediction is the output of a model given some input data. The model has been trained on historical data to identify relationships and patterns, and it uses these patterns to estimate the most likely outcome for new, unseen data.
9. How would you describe data in simple terms?
Data, in simple terms, is information. It can be facts, figures, symbols, or anything that can be stored and processed by a computer or even understood by a person. Think of it as the raw material that we use to make decisions or gain insights.
For example, the number 25, a person's name like "Alice", or even a picture of a cat are all forms of data. They become more useful when we organize and analyze them; turning them into something meaningful such as a report on sales figures or understanding customer preferences.
10. What is a survey, and what is it used for?
A survey is a method of gathering information from a sample of individuals, typically with the intent of generalizing the findings to a larger population. It involves asking standardized questions to respondents, which can be administered through various channels, such as online questionnaires, phone interviews, or in-person surveys.
Surveys are used for a wide range of purposes, including market research to understand consumer preferences, political polling to gauge public opinion, academic research to test hypotheses, customer satisfaction assessment, and employee engagement evaluation. They provide valuable insights into attitudes, beliefs, behaviors, and characteristics of a specific group.
11. If you see a trend, what does it tell you?
A trend suggests a pattern or tendency occurring over time. It could indicate a change in behavior, preferences, or performance. Seeing a trend prompts further investigation to understand the underlying causes and potential future implications. It can be used to make predictions or inform decisions.
Specifically, a trend can signal:
- An opportunity: To capitalize on growing demand or shift resources accordingly.
- A threat: To mitigate risks associated with declining performance or changing market conditions.
- A need for adjustment: To adapt strategies, processes, or products to remain competitive and relevant.
12. Explain what a percentage means.
A percentage is a way of expressing a number as a fraction of 100. It essentially means 'out of one hundred'. So, when you say 50%, you're saying 50 out of every 100, or one-half. It is a dimensionless way to express the ratio of two numbers, with the result being scaled to a base of 100.
13. Have you ever used a spreadsheet and can you explain how?
Yes, I have extensive experience using spreadsheets, primarily Google Sheets and Microsoft Excel. I've used them for a variety of tasks, including: data entry and organization, creating charts and graphs for data visualization, performing calculations using formulas (e.g., SUM, AVERAGE, VLOOKUP, IF), and managing lists. I've also used spreadsheets for basic data analysis, like calculating summary statistics and identifying trends.
For example, I once used Google Sheets to track project progress. I created columns for tasks, deadlines, assigned personnel, and completion status. I used conditional formatting to highlight overdue tasks and data validation to ensure data integrity. I also created charts to visualize progress and identify potential bottlenecks.
14. If I give you a set of numbers, how would you arrange them to make sense of them?
To arrange a set of numbers to make sense of them, I would first consider the context or the purpose of the numbers. Without context, I would start with some common techniques:
- Sorting: Sorting the numbers in ascending or descending order is a fundamental step. This helps identify the range, minimum, maximum, and any patterns in the data.
Arrays.sort(numbers)in Java orsorted(numbers)in Python are quick ways to achieve this. - Calculating descriptive statistics: Computing the mean, median, mode, standard deviation, and quartiles can provide insights into the distribution and central tendency of the data. These summary statistics offer a concise overview.
- Visualizing the data: Creating histograms, box plots, or scatter plots (if there are multiple dimensions or relationships to explore) allows for a visual understanding of the data's distribution, outliers, and potential correlations.
If there is a specific goal, such as optimizing a process or understanding trends, I would tailor the arrangement and analysis to address that goal.
15. Can you explain the term 'more than' and 'less than'?
'More than' and 'less than' are relational terms used to compare values. 'More than' indicates that one value is larger or greater in quantity, size, or degree than another. For example, 5 is more than 3 (5 > 3).
Conversely, 'less than' signifies that a value is smaller or of a lower quantity, size, or degree than another. Using the same numbers, 3 is less than 5 (3 < 5).
16. What does it mean for something to be 'most common'?
When something is 'most common', it signifies that it appears with the greatest frequency within a given dataset or context. It represents the element or value that occurs more often than any other individual element or value.
For example, in a list of numbers [1, 2, 2, 3, 2, 4], the number '2' is the most common because it appears three times, which is more than any other number in the list. It's also related to the statistical term 'mode'.
17. What does 'probability' mean in a simple way?
Probability is simply how likely something is to happen. You can think of it as a number between 0 and 1, where 0 means it's impossible and 1 means it's certain. So, a probability of 0.5 (or 50%) means there's an equal chance of it happening or not happening, like flipping a fair coin. The closer the probability is to 1, the more likely it is to occur, and the closer it is to 0, the less likely.
18. Explain what a line graph shows.
A line graph, also known as a line chart, displays data points connected by straight lines. It visually represents the relationship between two variables, where one variable (typically the x-axis) is often time or a sequential category, and the other variable (typically the y-axis) represents a measured value. The graph illustrates trends and changes in the measured value over time or across the categories.
Essentially, a line graph shows how a quantity changes as another quantity changes. It's particularly useful for visualizing trends, identifying patterns, and comparing data over a continuous period.
19. How would you show the number of boys and girls in your class, in a simple graph?
A simple bar graph would be effective. The x-axis would have two categories: "Boys" and "Girls". The y-axis would represent the number of students. The height of each bar would correspond to the respective count. Alternatively, a pie chart could also work, where each slice represents the proportion of boys and girls, with the size of the slice corresponding to the percentage of each group.
20. If you were counting the number of cars that pass by, how would you note it down so you can show your friend later?
I would use tally marks organized into groups of five for easy counting and recounting.
Example:
|||| (represents 4 cars)
||||| (represents 5 cars)
Then I can sum up all the groups of five, and add any remaining marks to get the total count. This is a simple and reliable method.
21. Explain the difference between qualitative and quantitative data.
Qualitative data is descriptive and conceptual. It is non-numerical and explores qualities related to categories or themes. Think of it as data that describes qualities or characteristics. Examples include colors, textures, smells, tastes, appearance, beauty, opinions, and so on. This data is often collected through interviews, focus groups, and observations.
Quantitative data, on the other hand, is numerical and measurable. It represents amounts, quantities, and sizes. This data can be counted, measured, and statistically analyzed. Common examples include height, weight, temperature, number of sales, test scores, etc. Analysis of quantitative data typically involves statistical methods.
22. If you have a lot of data, what is one way to summarize it?
One way to summarize a large dataset is by calculating descriptive statistics. These statistics provide a concise overview of the data's central tendency, dispersion, and shape. Common descriptive statistics include:
- Mean: The average value.
- Median: The middle value.
- Mode: The most frequent value.
- Standard deviation: Measures the spread of data around the mean.
- Percentiles: Values below which a given percentage of observations fall.
Calculating these statistics allows you to quickly understand the key characteristics of the data without needing to examine every single data point.
23. What is a 'sample', and why do we use it?
In statistics and data analysis, a 'sample' is a subset of a larger population that is selected to represent the characteristics of the entire group. It's a smaller, manageable selection used to infer information about the bigger, often inaccessible population.
We use samples because it's often impractical, costly, or impossible to study an entire population. Analyzing a representative sample allows us to draw conclusions and make predictions about the population as a whole with a certain level of confidence. For instance, we might sample a group of users to understand how the broader user base might react to a new website design. If the sample is chosen randomly and is large enough, it usually provides a good approximation of the behaviour of the total population.
24. What does 'correlation' mean?
Correlation measures the statistical relationship between two variables. It indicates how strongly and in what direction two variables tend to change together. A positive correlation means that as one variable increases, the other tends to increase as well. A negative correlation means that as one variable increases, the other tends to decrease.
Correlation is typically quantified using a correlation coefficient, such as Pearson's correlation coefficient, which ranges from -1 to +1. A value of +1 indicates a perfect positive correlation, 0 indicates no correlation, and -1 indicates a perfect negative correlation. Note that correlation does not imply causation.
25. How would you describe what 'statistics' is, to someone who has never heard of it?
Statistics is all about collecting, analyzing, and interpreting data to understand patterns and make informed decisions. Imagine you want to know if a new fertilizer improves crop yield. Statistics helps you design experiments, gather data on crop growth with and without the fertilizer, and then analyze that data to see if the difference is significant or just random chance.
Basically, it provides tools to deal with uncertainty and extract meaningful insights from information around us, ranging from understanding customer preferences to predicting weather patterns. It's a way of reasoning with numbers and making sense of the world using data.
26. Why is it important to collect data carefully?
Collecting data carefully is crucial because the quality of the data directly impacts the validity of any analysis, model, or decision made based on it. If data is inaccurate, incomplete, or biased, the resulting insights will be flawed, leading to incorrect conclusions and potentially harmful actions. This could manifest in various ways, from skewed business strategies to unreliable scientific research.
Specifically, consider the following:
- Accuracy: Ensuring data reflects reality.
- Completeness: Avoiding missing values that could distort analysis.
- Consistency: Maintaining uniform data formats and definitions across datasets.
- Relevance: Collecting only data pertinent to the research question.
- Timeliness: Ensuring data is up-to-date for relevant insights.
Statistics intermediate interview questions
1. Explain the difference between type I and type II errors in hypothesis testing. Can you provide an example of when each type of error might occur in a real-world scenario?
In hypothesis testing, a Type I error occurs when you reject the null hypothesis even though it's actually true. This is often called a "false positive." For example, a medical test might incorrectly indicate a patient has a disease when they are actually healthy. A Type II error, on the other hand, happens when you fail to reject the null hypothesis when it's actually false. This is a "false negative." For example, the medical test might incorrectly show a patient is healthy when they actually have the disease.
Consider a criminal trial: The null hypothesis is that the defendant is innocent. A Type I error (false positive) would be convicting an innocent person. A Type II error (false negative) would be acquitting a guilty person. In quality control, a Type I error could be rejecting a batch of products as defective when they are actually good, while a Type II error could be accepting a batch of products as good when they are actually defective.
2. Describe what multicollinearity is and how it can affect a regression model. How can you detect and address multicollinearity?
Multicollinearity refers to a situation where two or more predictor variables in a multiple regression model are highly correlated. This means that one predictor can be linearly predicted from the others with a substantial degree of accuracy. Multicollinearity can affect a regression model by making it difficult to estimate the individual effects of the correlated predictors. It leads to unstable and inflated standard errors of the coefficients, making it difficult to determine which predictors are statistically significant and potentially leading to incorrect conclusions about the relationships between the predictors and the response variable.
To detect multicollinearity, you can use several methods including:
- Examining correlation matrices: Look for high correlation coefficients (e.g., > 0.7 or 0.8) between predictor variables.
- Calculating Variance Inflation Factors (VIF): VIF measures how much the variance of an estimated regression coefficient increases if your predictors are correlated. A high VIF (e.g., > 5 or 10) indicates multicollinearity.
- Tolerance: Tolerance is 1/VIF, so a low tolerance value suggests multicollinearity.
To address multicollinearity, you can consider the following:
- Remove one or more of the highly correlated predictors. (Be cautious, as this could lead to omitted-variable bias)
- Combine the correlated predictors into a single predictor variable (if conceptually appropriate).
- Collect more data, which can sometimes help to reduce the effects of multicollinearity.
- Use regularization techniques (e.g., Ridge regression, Lasso regression) which can help to stabilize the coefficients and reduce the impact of multicollinearity. These techniques add a penalty term to the regression equation that shrinks the coefficients of correlated variables. For example:
from sklearn.linear_model import Ridge
model = Ridge(alpha=1.0) # alpha is the regularization strength
model.fit(X, y)
3. What are the assumptions of linear regression, and how can you check if these assumptions are met in a given dataset?
Linear regression makes several key assumptions about the data:
- Linearity: The relationship between the independent and dependent variables is linear.
- Independence: The errors (residuals) are independent of each other. This is particularly important for time series data.
- Homoscedasticity: The variance of the errors is constant across all levels of the independent variables.
- Normality: The errors are normally distributed.
- No multicollinearity: The independent variables are not highly correlated with each other. High multicollinearity can inflate the standard errors of the coefficients, making it difficult to interpret the results.
To check these assumptions, you can use various methods:
- Linearity: Scatter plots of the independent variables against the dependent variable, and residual plots.
- Independence: Durbin-Watson test (for time series data) or plotting residuals against time.
- Homoscedasticity: Scatter plot of residuals against predicted values. Look for a funnel shape. You can also use statistical tests like the Breusch-Pagan test.
- Normality: Histogram or Q-Q plot of the residuals. Shapiro-Wilk test can also be used.
- Multicollinearity: Variance Inflation Factor (VIF). A VIF greater than 5 or 10 suggests high multicollinearity. Correlation matrix between independent variables can also highlight potential issues.
4. Explain the concept of p-value and its role in hypothesis testing. What are some common misconceptions about p-values?
The p-value is the probability of observing results as extreme as, or more extreme than, the results obtained from a statistical test, assuming the null hypothesis is true. In hypothesis testing, it helps determine the statistical significance of results. A smaller p-value (typically ≤ 0.05) suggests stronger evidence against the null hypothesis, leading to its rejection.
Common misconceptions include: the p-value is not the probability that the null hypothesis is true; it doesn't measure the effect size or importance of a result; and a non-significant p-value (e.g., > 0.05) doesn't prove the null hypothesis is true, it simply means there's not enough evidence to reject it. P-values are also susceptible to manipulation (p-hacking) and should be interpreted cautiously alongside other evidence.
5. Differentiate between frequentist and Bayesian approaches to statistics. What are the advantages and disadvantages of each approach?
Frequentist statistics interprets probability as the long-run frequency of an event in repeated trials. It focuses on objective probabilities derived from data. Hypothesis testing involves setting a null hypothesis and determining the p-value, which is the probability of observing the data (or more extreme data) if the null hypothesis were true. Confidence intervals are constructed to estimate population parameters. A key advantage is its objectivity; results are based solely on data. A disadvantage is that it struggles with incorporating prior knowledge and can be misinterpreted (e.g., p-values are not the probability of the null hypothesis being true).
Bayesian statistics, conversely, interprets probability as a degree of belief. It uses Bayes' theorem to update beliefs about parameters given the data. It incorporates prior knowledge through prior distributions, which are then updated to posterior distributions after observing the data. Advantages include the ability to incorporate prior information and provide more intuitive probabilities (e.g., the probability of a hypothesis being true given the data). Disadvantages include the subjectivity in choosing prior distributions, and increased computational complexity, especially for complex models.
6. Describe the Central Limit Theorem and its significance in statistics. How is it used in statistical inference?
The Central Limit Theorem (CLT) states that the distribution of sample means approximates a normal distribution as the sample size gets larger, regardless of the population's distribution. This holds true if the samples are independent and identically distributed (i.i.d.) and the sample size is sufficiently large (typically n > 30). The CLT is significant because it allows us to make inferences about population parameters based on sample statistics, even when we don't know the population's distribution.
In statistical inference, the CLT is used to construct confidence intervals and perform hypothesis tests. For example, when estimating a population mean, we can use the sample mean and the standard error (estimated using the sample standard deviation and sample size) to create a confidence interval. The CLT assures us that the sampling distribution of the sample mean is approximately normal, allowing us to use the z-distribution or t-distribution for calculating the confidence interval or p-value in hypothesis testing. This underpins many statistical techniques, like t-tests and ANOVA.
7. What is the difference between correlation and causation? How can you determine if a relationship between two variables is causal?
Correlation indicates a statistical association between two variables, meaning they tend to move together. Causation, however, means that one variable directly influences the other; a change in one variable causes a change in the other. Just because two variables are correlated doesn't automatically mean one causes the other; the correlation could be coincidental, or both variables could be influenced by a third, unobserved variable (a confounding variable).
Establishing causality is more challenging than identifying correlation. Several methods can help determine causality:
- Controlled experiments: Randomly assigning subjects to different groups and manipulating the independent variable.
- Longitudinal studies: Observing the variables over a long period.
- Ruling out confounding variables: Statistically controlling for other variables that might explain the relationship.
- Theoretical plausibility: The relationship should make sense based on existing knowledge.
- Hill's Criteria: A set of nine principles that can be used to evaluate epidemiological evidence for causality (e.g., strength of association, consistency, temporality, etc.).
8. Explain the concept of confidence intervals. How does the confidence level affect the width of the interval?
A confidence interval is a range of values that is likely to contain the true value of a population parameter with a certain degree of confidence. It's essentially an estimate plus or minus a margin of error. For example, a 95% confidence interval means that if we were to take many samples and calculate a confidence interval for each sample, approximately 95% of those intervals would contain the true population parameter.
The confidence level directly affects the width of the interval. A higher confidence level (e.g., 99%) requires a wider interval to ensure that we capture the true parameter with greater certainty. Conversely, a lower confidence level (e.g., 90%) allows for a narrower interval, but at the cost of a higher chance of missing the true parameter. This relationship exists because a wider interval includes a larger range of possible values, thus increasing the probability of containing the true value. Margin of error will be bigger for higher confidence level.
9. What are the different types of sampling methods? Provide examples of when each method might be appropriate.
Sampling methods fall into two main categories: probability sampling and non-probability sampling.
Probability sampling involves random selection, ensuring each member of the population has a known chance of being included in the sample. Types include:
- Simple Random Sampling: Every member has an equal chance. Example: Drawing names from a hat.
- Stratified Sampling: Dividing the population into subgroups (strata) and randomly sampling from each. Example: Surveying students, ensuring representation from each grade level (freshman, sophomore, etc.).
- Cluster Sampling: Dividing the population into clusters and randomly selecting entire clusters. Example: Surveying households by randomly selecting city blocks.
- Systematic Sampling: Selecting every kth member from a list. Example: Inspecting every 10th item on an assembly line.
Non-probability sampling relies on non-random criteria. Types include:
- Convenience Sampling: Selecting readily available participants. Example: Surveying people at a mall.
- Judgment Sampling: Selecting participants based on expert judgment. Example: Selecting experienced engineers to evaluate a new design.
- Quota Sampling: Selecting participants to match population proportions on certain characteristics. Example: Ensuring a survey sample has the same gender ratio as the population.
- Snowball Sampling: Existing participants recruit future participants from among their acquaintances. Example: Studying a rare population where members are difficult to find (e.g., drug users).
10. Describe the concept of statistical power and its relationship to sample size and effect size. How can you increase the power of a statistical test?
Statistical power is the probability that a statistical test will correctly reject a false null hypothesis. It's essentially the ability of a test to detect a real effect if one exists. Power is directly related to sample size and effect size. A larger sample size provides more data, making it easier to detect a true effect, hence increasing power. Similarly, a larger effect size (the magnitude of the difference or relationship being studied) is easier to detect, also leading to higher power.
To increase the power of a statistical test, you can primarily:
- Increase the sample size.
- Increase the effect size (although this is often not something you can directly control, but rather a property of the phenomena you're studying).
- Reduce the variability in the data.
- Increase the alpha level (significance level), but this also increases the chance of a Type I error (false positive).
- Use a more powerful statistical test (e.g., a parametric test instead of a non-parametric test if the assumptions are met).
11. Explain what regularization is in the context of machine learning. Describe L1 and L2 regularization and their differences.
Regularization is a technique used in machine learning to prevent overfitting by adding a penalty term to the loss function. This penalty discourages the model from learning overly complex patterns from the training data, which can lead to poor generalization on unseen data. Two common types of regularization are L1 and L2 regularization.
L1 regularization (Lasso) adds the absolute value of the coefficients as the penalty term, which encourages sparsity in the model by driving some coefficients to zero. This can be useful for feature selection. L2 regularization (Ridge) adds the squared value of the coefficients as the penalty term. It shrinks the coefficients towards zero but typically doesn't force them to be exactly zero. L2 regularization generally leads to smaller coefficient values across all features, making the model less sensitive to individual data points. The key difference is L1 can perform feature selection by setting coefficients to zero while L2 shrinks all coefficients, providing lower variance.
12. How would you handle missing data in a statistical analysis? Discuss different imputation methods and their potential biases.
Handling missing data in statistical analysis is crucial to avoid biased results. Several imputation methods exist, each with its own assumptions and potential biases. Simple imputation techniques like mean/median imputation can introduce bias by altering the distribution of the variable and underestimating variance. More sophisticated methods, such as multiple imputation, create multiple plausible datasets, acknowledging the uncertainty associated with the missing values. This involves creating several imputed datasets and combining the results, generally leading to more accurate variance estimation and reduced bias. However, multiple imputation still relies on the assumption that the data is Missing At Random (MAR), meaning that the missingness depends only on observed data.
Other imputation options include: listwise deletion (removes rows with missing data, can introduce bias if data is not Missing Completely At Random (MCAR)), regression imputation (predicts missing values using regression models - prone to overfitting), and k-Nearest Neighbors (KNN) imputation (imputes based on similar data points). The best approach depends on the amount and pattern of missing data, and the specific goals of the analysis. Always evaluate the impact of imputation on the results and consider sensitivity analyses.
13. What is the curse of dimensionality, and how does it affect statistical modeling? What techniques can be used to mitigate it?
The curse of dimensionality refers to the phenomenon where data becomes increasingly sparse and difficult to analyze as the number of dimensions (features) increases. In statistical modeling, this leads to several problems including increased computational cost, overfitting (models fitting to noise due to high variance), and decreased model performance (poor generalization to new data). As the number of features grows exponentially, the amount of data needed to maintain a similar level of statistical significance also increases exponentially.
Techniques to mitigate the curse of dimensionality include: feature selection (choosing the most relevant features), feature extraction/dimensionality reduction (e.g., Principal Component Analysis (PCA), t-distributed Stochastic Neighbor Embedding (t-SNE)), regularization (penalizing complex models to prevent overfitting, such as L1 or L2 regularization in linear models), and increasing the sample size (collecting more data). In some cases, non-parametric methods can be used or replaced with parametric methods as the number of dimensions increase.
14. Describe the difference between parametric and non-parametric statistical tests. When would you use each type of test?
Parametric statistical tests assume the data follows a specific distribution, usually a normal distribution, and rely on parameters like mean and standard deviation. They are more powerful than non-parametric tests when the assumptions are met. Examples include t-tests, ANOVA, and linear regression. Non-parametric tests, on the other hand, make no or very few assumptions about the underlying distribution of the data. They are suitable when the data is not normally distributed, the sample size is small, or the data is ordinal or nominal. Examples include Mann-Whitney U test, Kruskal-Wallis test, and Chi-square test.
Use parametric tests when you have interval or ratio data that is normally distributed (or can be transformed to be approximately normal) and the assumptions of the test are met. Use non-parametric tests when your data violates the assumptions of parametric tests, such as when the data is ordinal or nominal, the sample size is small, or the data is heavily skewed or contains outliers.
15. Explain the concept of A/B testing and its application in business decision-making. What are some potential pitfalls to avoid when conducting A/B tests?
A/B testing, also known as split testing, is a method of comparing two versions of something (e.g., a website page, an email subject line, an app feature) to determine which one performs better. You randomly divide your audience into two groups: Group A sees the original version (the control), and Group B sees the modified version (the variation). By analyzing the data collected (e.g., conversion rates, click-through rates), you can statistically determine which version leads to the desired outcome. This data-driven approach helps businesses make informed decisions about design, marketing, and product development, rather than relying on guesswork or intuition.
Potential pitfalls include:
- Insufficient sample size: Leading to statistically insignificant results.
- Testing too many elements at once: Makes it difficult to isolate the impact of each change.
- Ignoring external factors: Like seasonality or marketing campaigns affecting results.
- Not running the test long enough: Failing to capture the full range of user behavior.
- Incorrect statistical analysis: Misinterpreting the results and drawing wrong conclusions.
16. What are some common data visualization techniques, and how can they be used to explore and communicate statistical findings effectively?
Common data visualization techniques include: * Scatter plots: Show the relationship between two variables.
- Line charts: Display trends over time.
- Bar charts: Compare categorical data.
- Histograms: Illustrate the distribution of a single variable.
- Box plots: Summarize the distribution of a variable, highlighting quartiles and outliers.
- Heatmaps: Show the correlation between multiple variables. They are effective for both exploring data and communicating findings. For example, scatter plots reveal correlations, while histograms show data distributions. Line charts effectively communicate trends, and bar charts make comparisons easy. Proper selection of the visualization technique is key to conveying insights effectively. Choosing the right colours and labels will enhance the data visualisation and make it easier to understand.
17. Describe the concept of time series analysis. What are some common time series models, and when are they appropriate to use?
Time series analysis involves analyzing data points collected over time to identify patterns, trends, and seasonal variations. The goal is often to forecast future values based on historical data.
Common time series models include:
- ARIMA (Autoregressive Integrated Moving Average): Suitable for data with autocorrelation (correlation between past and present values). The parameters (p, d, q) represent the order of autoregression, integration (differencing), and moving average components, respectively.
ARIMA(1,1,1)is a common starting point. - Exponential Smoothing: Useful for data with trends and seasonality. Methods like Holt-Winters account for both trend and seasonal components.
- Prophet: Designed for time series with strong seasonality and trend, especially suitable for business time series data. It handles missing values and outliers well.
- State Space Models (e.g., Kalman Filter): Flexible models that can handle complex time series dynamics, including time-varying parameters and multiple input series.
The choice of model depends on the characteristics of the data (stationarity, seasonality, trend), the desired forecast horizon, and the available computational resources. For example, if the data exhibits strong seasonality, Holt-Winters or Prophet might be preferred over a simple ARIMA model. Stationarity is a crucial property. If the data is not stationary, differencing might be needed before using ARIMA.
18. Explain the concept of bootstrapping and its applications in statistical inference. How does it differ from traditional resampling methods?
Bootstrapping is a resampling technique used in statistical inference to estimate the sampling distribution of a statistic by resampling with replacement from the original dataset. It's particularly useful when the theoretical distribution of the statistic is unknown or difficult to derive. Common applications include estimating standard errors, confidence intervals, and p-values. For example, to find a 95% confidence interval for the mean, you'd repeatedly resample the data, calculate the mean of each resample, and then take the 2.5th and 97.5th percentiles of the resampled means.
Traditional resampling methods, like the jackknife, typically involve resampling without replacement and often aim to estimate bias and variance. Bootstrapping, in contrast, focuses on approximating the entire sampling distribution through repeated resampling with replacement. The jackknife removes one observation at a time, making it less computationally intensive but potentially less accurate, especially for complex statistics. Bootstrap provides a more general approach suitable for a wider array of statistical problems where distributional assumptions are not met.
19. What is survival analysis, and what types of questions can it answer? Describe some common survival analysis techniques.
Survival analysis is a statistical method used to analyze the expected duration of time until an event occurs. This event could be death, equipment failure, or any defined endpoint. It focuses on time-to-event data, acknowledging that not all subjects experience the event during the study period (censoring).
Survival analysis can answer questions like: What is the probability of an event occurring at a specific time? How do different groups compare in terms of survival? What factors influence the time to an event? Some common techniques include Kaplan-Meier estimation (for visualizing survival curves), Log-rank test (for comparing survival curves between groups), and Cox proportional hazards regression (for assessing the impact of multiple factors on survival).
20. Explain what is the role of statistics in experimentation and design? What are the key components of a well-designed experiment?
Statistics plays a crucial role in experimentation and design by providing a framework for planning, conducting, analyzing, and interpreting experimental data. It helps researchers to: 1) Design efficient experiments: Statistical principles guide the selection of appropriate sample sizes, treatments, and experimental units to maximize the information gained while minimizing resources used. 2) Control for variability: Statistical techniques like randomization and blocking help to reduce the impact of extraneous variables that can confound experimental results. 3) Objectively analyze data: Statistical methods provide tools for summarizing data, testing hypotheses, and estimating the magnitude of effects, allowing researchers to draw valid conclusions based on evidence. 4) Quantify uncertainty: Statistics allows us to express the level of confidence we have in our results through confidence intervals and p-values.
Key components of a well-designed experiment include: Treatment: The factor being manipulated or tested. Experimental units: The subjects or objects to which treatments are applied. Control: A baseline or comparison group that does not receive the treatment. Randomization: Assigning experimental units to treatments randomly to minimize bias. Replication: Repeating the experiment or treatment on multiple experimental units to improve precision. Blocking: Grouping experimental units based on similar characteristics to reduce variability. Clearly defined response variable: a well-defined metric or outcome to measure.
Statistics interview questions for experienced
1. How would you explain p-values to a non-technical stakeholder, and what are some common misconceptions about them?
Imagine you're trying to decide if a new ad campaign is better than the old one. The p-value tells you the probability of seeing the results you observed (or even more extreme results) if the new campaign was actually no better than the old one. A small p-value (usually less than 0.05) suggests that your results are unlikely to have happened by chance alone, so you might conclude the new campaign is indeed better. A large p-value suggests the results could easily have happened by chance, so you don't have strong evidence that the new campaign is superior. Importantly, the p-value does not tell you the probability that the new campaign is better. It only tells you the probability of the data, assuming the campaigns are the same.
Some common misconceptions are that a p-value indicates the size or importance of an effect (it doesn't; a tiny effect can have a small p-value if the sample size is large) or that a p-value of 0.05 means there's only a 5% chance you're wrong (it doesn't; it's about the probability of the data, not the conclusion). Also, it doesn't tell the probability of a hypothesis being true, only the data we observed if the null hypothesis were true.
2. Describe a situation where you used Bayesian inference. What were the benefits and drawbacks compared to a frequentist approach?
I once used Bayesian inference to predict customer churn at a subscription-based service. We had limited historical data, so a frequentist approach, which relies on large sample sizes, was not ideal. Using a Bayesian approach, I was able to incorporate prior knowledge about churn rates from industry reports and expert opinions. The model updated these priors with the available data to generate a posterior distribution of churn probabilities for each customer.
The benefit of using Bayesian inference was its ability to handle uncertainty and incorporate prior knowledge, leading to more informed predictions despite limited data. A major drawback was the computational cost associated with Bayesian methods. Frequentist methods are often computationally faster and simpler to implement. Also, choosing appropriate priors can be subjective and may heavily influence the posterior results if the data is scarce, which needs careful consideration. Frequentist confidence intervals have a direct interpretation, while Bayesian credible intervals require understanding probability distributions over parameters.
3. How do you handle multicollinearity in a regression model, and what impact does it have on the model's interpretability?
Multicollinearity in a regression model arises when independent variables are highly correlated. This can cause several problems. First, it inflates the variance of the estimated regression coefficients, making them unstable and difficult to interpret. It can also lead to incorrect conclusions about the significance of individual predictors. Even though the model fits the data well overall, the p-values for individual coefficients might be high, leading to the false conclusion that they are not important.
To handle multicollinearity, several techniques can be employed, including:
- Variance Inflation Factor (VIF): Calculate VIF for each predictor; values above 5 or 10 often indicate multicollinearity.
- Correlation Matrix: Examine the correlation matrix of independent variables to identify highly correlated pairs.
- Remove Redundant Variables: Remove one of the correlated variables if it doesn't significantly impact the model. This can be evaluated using domain knowledge or comparing models.
- Principal Component Analysis (PCA): Use PCA to create uncorrelated components from the original variables. Then, use these components in the regression model. Note that this will make the interpretability of coefficients based on the original variables more complex.
- Regularization Techniques: Ridge regression or Lasso regression can help to shrink the coefficients and reduce the impact of multicollinearity. Ridge regression is preferred when all variables are believed to be important, but their exact effects are difficult to estimate due to multicollinearity.
Multicollinearity significantly impacts the interpretability of a model because it becomes difficult to isolate the effect of each individual predictor. The coefficients are sensitive to small changes in the data, and their signs may even flip, making it hard to confidently state the relationship between a predictor and the response variable.
4. Explain the difference between Type I and Type II errors. How do you balance the risk of each in a real-world scenario?
Type I and Type II errors are concepts in hypothesis testing. A Type I error (false positive) occurs when you reject a true null hypothesis. In simpler terms, you conclude there is an effect when there isn't one. A Type II error (false negative) occurs when you fail to reject a false null hypothesis. Meaning, you miss a real effect, concluding there is no effect when there actually is.
Balancing these errors depends on the context. For example, in medical diagnosis, a Type II error (missing a disease) might be more serious than a Type I error (false alarm), so we might adjust our testing to decrease the likelihood of a Type II error, even if it increases the chance of a Type I error. Conversely, in spam filtering, a Type I error (classifying a legitimate email as spam) can be more problematic than a Type II error (letting some spam through), so we would adjust to minimize Type I errors. The relative costs and consequences of each error type inform the decision on how to balance them.
5. Describe your experience with time series analysis. What models have you used, and how did you evaluate their performance?
I have experience working with time series data for forecasting and anomaly detection. I've utilized various models including ARIMA, Exponential Smoothing (like Holt-Winters), and more recently, Prophet. For evaluating performance, I primarily use metrics like Mean Absolute Error (MAE), Mean Squared Error (MSE), Root Mean Squared Error (RMSE), and Mean Absolute Percentage Error (MAPE). I also use visual inspection of the forecasts against the actual data, and analyze residual plots to check for patterns indicating model inadequacy.
To ensure robustness, I usually split the data into training and testing sets, and apply techniques like cross-validation. For instance, when using ARIMA, I'd typically use the auto_arima function from the pmdarima library in Python to determine the optimal parameters. Then, the model's performance is evaluated on the test set using the metrics mentioned above.
6. How do you approach outlier detection and treatment in a dataset, and what considerations guide your decisions?
My approach to outlier detection begins with understanding the data and the potential reasons for outliers. I typically start with exploratory data analysis (EDA), using visualizations like box plots, scatter plots, and histograms to identify potential outliers. Quantitatively, I use methods like Z-score, IQR (Interquartile Range), and DBSCAN. Z-score identifies data points beyond a certain number of standard deviations from the mean, while IQR flags points outside a range defined by Q1 - 1.5IQR and Q3 + 1.5IQR.
Treatment depends on the context and the cause of the outliers. If they're due to errors, I correct or remove them. If they represent genuine extreme values, I might transform the data (e.g., log transformation) to reduce their impact or use robust statistical methods less sensitive to outliers. Sometimes, I might choose to keep the outliers if they provide valuable information, especially in domains like fraud detection. The decision is guided by the data's nature, the goals of the analysis, and the potential impact on the model's performance.
7. What is survival analysis, and in what types of situations would you apply it?
Survival analysis is a statistical method used to analyze the expected duration of time until one or more events happen, such as death, disease occurrence, or equipment failure. It's particularly valuable when dealing with time-to-event data, which includes censored observations (individuals who haven't experienced the event by the end of the study). This separates it from typical regression tasks, as these observations can be included. Common techniques include Kaplan-Meier curves, Cox proportional hazards models, and parametric survival models.
Survival analysis is applicable in diverse fields. For example, in healthcare, it's used to study patient survival rates after a certain treatment. In marketing, one could analyse customer churn. In engineering, it can be applied to calculate the lifespan of a mechanical component before failure. Any study needing the calculation of time until an event and considering censored data points can benefit from survival analysis.
8. Explain the concept of the Central Limit Theorem and its importance in statistical inference. Can you give me a real-world example?
The Central Limit Theorem (CLT) states that the distribution of sample means approaches a normal distribution as the sample size increases, regardless of the shape of the population distribution. This holds true even if the population is not normally distributed, provided the sample size is large enough (typically n > 30). The importance lies in enabling statistical inference. We can make claims about the population mean based on sample data, construct confidence intervals, and perform hypothesis tests assuming a normal distribution for the sample means.
For example, imagine measuring the heights of all adult women in a city. This population might not be perfectly normally distributed. However, if we take many random samples of, say, 50 women each and calculate the mean height of each sample, the distribution of these sample means will be approximately normal. We can then use this distribution to estimate the average height of all women in the city and determine the margin of error for our estimate. This is crucial for surveys and polling.
9. How would you design an A/B test to compare two different website designs, and what metrics would you track?
To A/B test two website designs, I'd randomly split website traffic, directing a portion (e.g., 50%) to Design A and the remaining portion to Design B. The split should remain consistent throughout the test duration. We would need a statistically significant sample size for each group, determined using a power analysis, to ensure reliable results. The test duration depends on traffic volume and the magnitude of the observed differences.
Key metrics to track include conversion rate (e.g., purchase completion, sign-up), bounce rate, time on site, pages per session, and click-through rates (CTR) on key elements. Analyzing these metrics will reveal which design performs better in engaging users and achieving desired goals. Statistical significance should be assessed for each metric to determine if the observed differences are likely due to the design change rather than random chance. User feedback can also be collected through surveys or heatmaps to provide qualitative insights.
10. Describe your experience with different types of statistical distributions (e.g., normal, Poisson, binomial). When would you use each?
I have experience with several statistical distributions, including normal, Poisson, and binomial distributions. The normal (Gaussian) distribution is used to model continuous data that clusters around a mean, such as heights or test scores, especially when influenced by many independent factors. The Poisson distribution models the number of events occurring within a fixed interval of time or space, given a known average rate of occurrence, like the number of website visits per hour or defects in a manufacturing process. The binomial distribution models the probability of obtaining a specific number of successes in a fixed number of independent trials, where each trial has only two possible outcomes (success or failure). An example would be the number of heads in a series of coin flips.
I've applied these distributions in various projects. For example, I used the normal distribution to model the distribution of errors in a regression model and to perform hypothesis testing. I used the Poisson distribution to analyze the rate of customer arrivals at a service center. I have also used the binomial distribution to estimate conversion rates in A/B testing scenarios. Understanding these distributions helps in making appropriate assumptions, choosing the right statistical tests, and interpreting results accurately.
11. How do you assess the goodness-of-fit of a statistical model, and what methods do you use to improve it?
Goodness-of-fit assesses how well a statistical model describes the observed data. Several methods exist: comparing observed vs. predicted values visually (e.g., scatter plots, residual plots), and using statistical tests such as the Chi-squared test, Kolmogorov-Smirnov test, or likelihood ratio test. Lower p-values usually indicate a poor fit. Information criteria like AIC and BIC balance model fit with complexity; lower values are generally better.
To improve model fit, consider several approaches: 1. Feature engineering: adding, removing, or transforming variables. 2. Model selection: trying different model types (e.g., linear regression vs. non-linear models). 3. Regularization: using techniques like L1 or L2 regularization to prevent overfitting. 4. Addressing outliers: identifying and handling outliers that unduly influence the model. 5. Collecting more data: increased data often leads to more robust and representative models.
12. What are the key assumptions of linear regression, and how do you check if they are met?
Linear regression relies on several key assumptions: 1. Linearity: The relationship between the independent and dependent variables is linear. 2. Independence of Errors: The errors (residuals) are independent of each other. 3. Homoscedasticity: The variance of the errors is constant across all levels of the independent variables. 4. Normality of Errors: The errors are normally distributed. 5. No multicollinearity: The independent variables are not highly correlated with each other.
To check these assumptions:
- Linearity: Scatter plots of the independent variables vs. the dependent variable and residual plots can help. Look for non-linear patterns.
- Independence of Errors: The Durbin-Watson test or plotting residuals against time (if data is time-series) can be used to check for autocorrelation.
- Homoscedasticity: Plotting residuals against predicted values can reveal non-constant variance (heteroscedasticity). Breusch-Pagan or White's test can also be used.
- Normality of Errors: Histograms, Q-Q plots of the residuals, or formal tests like the Shapiro-Wilk test can assess normality.
- No multicollinearity: Calculate Variance Inflation Factor (VIF) for each independent variable. VIF values greater than 5 or 10 typically indicate high multicollinearity.
13. Explain the concept of regularization in machine learning. How do L1 and L2 regularization differ, and when would you use each?
Regularization is a technique used to prevent overfitting in machine learning models by adding a penalty term to the loss function. This penalty discourages the model from learning overly complex relationships from the training data, which might not generalize well to unseen data.
L1 (Lasso) and L2 (Ridge) regularization are two common types. L1 adds the absolute value of the coefficients to the loss function, promoting sparsity by potentially driving some coefficients to zero, thus performing feature selection. L2 adds the squared value of the coefficients to the loss function, shrinking the coefficients towards zero but rarely making them exactly zero. L1 is useful when you suspect that many features are irrelevant, while L2 is useful when you want to reduce the impact of all features without eliminating any.
14. Describe a situation where you had to deal with missing data. What imputation techniques did you use, and why?
In a recent project involving customer churn prediction, we faced a significant amount of missing data in several features, including income and tenure with the company. To address this, I first analyzed the nature of missingness. If data was missing completely at random (MCAR) and the proportion was small, I would consider simple imputation techniques like mean or median imputation. However, in our case, the missingness seemed to be related to other variables (MAR).
Therefore, I opted for more sophisticated methods. For income, I used regression imputation, where I built a regression model using other available features to predict the missing income values. For tenure, which had a considerable number of missing values for newer customers, I used a combination of domain knowledge and nearest neighbor imputation. Specifically, If a customer had no listed tenure, it was probably a brand new customer so I filled it with 0. I chose these methods because they allowed us to leverage existing data relationships to provide more accurate imputations than simple methods, which are crucial for building a robust predictive model. I also did sensitivity analysis to check for imputations' impact.
15. How do you approach feature selection in a high-dimensional dataset, and what criteria do you use to evaluate the selected features?
In high-dimensional datasets, I approach feature selection by first understanding the data and the problem. I explore various methods, considering both filter, wrapper, and embedded techniques. Filter methods like correlation and chi-squared tests quickly assess feature relevance independently of any specific model. Wrapper methods, such as recursive feature elimination (RFE) or sequential feature selection, evaluate subsets of features based on model performance, which can be computationally expensive but often yields better results. Embedded methods, such as LASSO regression, incorporate feature selection into the model training process.
To evaluate selected features, I primarily focus on model performance metrics relevant to the problem, like accuracy, precision, recall, F1-score, or AUC, using cross-validation to ensure robustness. I also consider the interpretability and practicality of the selected features. A simpler model with slightly lower performance might be preferred if it's easier to understand and implement. Furthermore, stability is important; features should consistently perform well across different data subsets and models. The bias-variance tradeoff is also a key consideration: selecting too few features might introduce bias, while selecting too many can lead to high variance and overfitting.
16. Explain the concept of statistical power and its importance in hypothesis testing. How do you calculate the required sample size for a study?
Statistical power is the probability that a hypothesis test will correctly reject a false null hypothesis. In simpler terms, it's the ability of a test to detect a real effect if one exists. It's crucial because low power means a study might fail to find a true effect, leading to wasted resources and potentially incorrect conclusions. High power is desirable as it increases the confidence that a non-significant result truly indicates the absence of an effect, rather than being a consequence of insufficient sample size.
Calculating the required sample size involves several factors: the desired statistical power (usually 80% or higher), the significance level (alpha, commonly 0.05), the effect size (the magnitude of the difference you want to detect), and the variability of the data (standard deviation). Formulas or statistical software (like R, Python with statsmodels or dedicated power analysis tools) are used to determine the sample size that meets these criteria. Different tests (t-test, chi-squared, etc.) will have different formulas, but they all aim to ensure the study is adequately powered to detect a meaningful effect.
17. How do you validate a statistical model to ensure it generalizes well to new data?
To validate a statistical model and ensure it generalizes well, several techniques are used. Primarily, splitting the data into training, validation, and test sets is crucial. The model is trained on the training set, tuned using the validation set (for hyperparameter optimization), and finally evaluated on the completely unseen test set. Cross-validation, such as k-fold cross-validation, is another important method where the data is divided into k subsets, and the model is trained and tested k times, each time using a different subset as the test set and the remaining subsets as the training set. Model performance metrics (e.g., accuracy, precision, recall, F1-score for classification; RMSE, MAE for regression) on the test or validation sets provide insights into how well the model generalizes.
Further methods include checking for overfitting by examining the difference in performance between the training and test sets. Regularization techniques (L1, L2 regularization) during model training can help prevent overfitting. Examining residual plots to assess the model's assumptions and using learning curves to diagnose bias and variance are also helpful. Additionally, comparing the model's performance to a simpler baseline model can help determine if the added complexity of the model is justified. Monitoring performance over time with new data is essential to detect concept drift.
18. Describe your experience with causal inference. What methods have you used to estimate causal effects, and what are the limitations of each?
My experience with causal inference involves using various methods to estimate the causal effect of interventions, primarily in observational data settings. I have worked with methods like: propensity score matching, inverse probability weighting (IPW), and instrumental variables (IV) regression. With propensity score matching, I've used it to balance covariates between treatment and control groups by matching individuals with similar propensity scores, but it's limited by the untestable assumption of no unmeasured confounders. IPW addresses confounding by weighting observations based on their probability of treatment, but it's sensitive to extreme weights if the propensity score model is misspecified. Finally, I have applied IV regression to estimate causal effects when there are unobserved confounders, using an instrumental variable that affects the treatment but not the outcome directly. The challenge is finding strong and valid instruments, as weak instruments can lead to biased estimates.
19. How do you handle imbalanced datasets in classification problems, and what metrics do you use to evaluate model performance?
To handle imbalanced datasets, I employ several strategies. First, I consider resampling techniques like oversampling the minority class (e.g., using SMOTE) or undersampling the majority class. I might also generate synthetic samples for the minority class. Algorithmically, I explore using cost-sensitive algorithms or adjusting class weights to penalize misclassification of the minority class more heavily. Furthermore, I often investigate ensemble methods that are inherently more robust to imbalanced data.
For evaluating model performance, accuracy can be misleading. Therefore, I rely on metrics like precision, recall, F1-score, and the area under the ROC curve (AUC-ROC). Precision focuses on the accuracy of positive predictions, while recall focuses on the model's ability to find all positive instances. The F1-score is the harmonic mean of precision and recall, providing a balanced measure. AUC-ROC assesses the model's ability to discriminate between classes across different threshold settings. I also consider the precision-recall curve (PR curve) and its area under the curve (AUC-PR) for a more detailed understanding, especially when the positive class is rare. Confusion matrices are also helpful for detailed analysis.
20. Explain the difference between parametric and non-parametric statistical methods. When would you use each?
Parametric statistical methods assume that the data follows a specific probability distribution, typically a normal distribution. These methods estimate parameters of that distribution, like the mean and standard deviation. Examples include t-tests, ANOVA, and linear regression. They are used when you have enough information to reasonably assume a specific distribution and want to make strong inferences about population parameters.
Non-parametric methods make no or very few assumptions about the underlying data distribution. They are suitable when the data is not normally distributed, when sample sizes are small, or when the data is ordinal or nominal. Examples include the Mann-Whitney U test, Kruskal-Wallis test, and Spearman's rank correlation. Use them when distributional assumptions are questionable, or when you need more robust methods that are less sensitive to outliers or violations of normality. They often test for differences in medians rather than means.
21. How would you explain hierarchical modeling to someone without a statistics background, and what are its advantages?
Imagine you're organizing information about animals. Instead of listing every detail for every animal individually, you group them. You start with broad categories like "Mammals," "Birds," and "Reptiles." Then, within "Mammals," you have subcategories like "Dogs," "Cats," and "Bears." This is like hierarchical modeling. We create levels of categories (or 'groups') where things within a group are more similar to each other than to things in other groups.
The main advantage is that it lets us 'borrow' information. If we have very little data about a particular type of bear, we can use the general information about bears, or even mammals, to make more informed guesses. It's especially helpful when some groups have very little data or when we suspect different groups behave similarly.
22. Describe a time when you had to communicate complex statistical results to a non-technical audience. What strategies did you use?
In a previous role, I analyzed customer churn and had to present the findings to the marketing team. The model used logistic regression, which involved concepts like odds ratios and p-values, terms foreign to the audience. My strategy involved avoiding jargon. Instead of saying "the odds ratio is 2.5," I'd say, "customers with X are 2.5 times more likely to churn." I focused on actionable insights. For example, I highlighted the top three factors driving churn and suggested specific marketing interventions to address them, such as targeted email campaigns or personalized offers.
To further clarify, I used visual aids extensively. I created charts and graphs showing the impact of different factors on churn probability. I also framed the results in terms of potential revenue loss due to churn and potential gains from reducing it. This helped the team understand the business implications of the statistical findings and made the information more relatable and impactful, leading to a more effective marketing strategy.
23. What are some ethical considerations when working with statistical data, and how do you ensure responsible data analysis?
Ethical considerations in statistical data analysis include ensuring data privacy and confidentiality, avoiding bias and misrepresentation, and maintaining transparency in methods and findings. Privacy is protected through anonymization techniques like removing direct identifiers and using differential privacy. Bias is addressed by carefully examining data collection methods, using appropriate statistical techniques to control for confounding variables, and being aware of potential biases in interpretation. Transparency involves clearly documenting all steps of the analysis, making data and code publicly available (when appropriate), and acknowledging limitations.
Responsible data analysis also means being mindful of the potential impact of the results. For example, statistical models used in risk assessment should be carefully validated to ensure they are fair and accurate, and the results should be communicated responsibly to avoid causing undue harm or discrimination. Finally, adhering to professional codes of conduct, such as those from statistical societies, provides a framework for ethical decision-making. Careful consideration must be given to the context in which the data is being used, and the potential consequences of the analysis.
24. Explain what a statistical interaction is, and how you would test for one in a regression model.
A statistical interaction occurs when the effect of one independent variable on a dependent variable depends on the level of another independent variable. In simpler terms, the relationship between X and Y changes depending on the value of Z. For example, the effect of exercise (X) on weight loss (Y) might be different for men (Z=1) compared to women (Z=0).
To test for an interaction in a regression model, you would typically include an interaction term in the model. This term is created by multiplying the two independent variables you suspect of interacting. For instance, if you think X and Z interact, you'd include a term XZ in your regression. The model would then be Y = b0 + b1*X + b2*Z + b3*X*Z + e. A statistically significant coefficient (b3) for the interaction term (XZ) suggests evidence of a statistical interaction. You can assess the significance of b3 by examining its p-value from the regression output. Lower p-values (typically less than 0.05) indicate a statistically significant interaction.
25. Describe a challenging statistical problem you faced and how you overcame it.
In a previous role, I encountered a challenging problem involving customer churn prediction for a subscription-based service. The dataset was highly imbalanced, with a significantly larger number of non-churning customers compared to those who churned. This led to models that were biased towards predicting non-churn, resulting in poor performance in identifying potential churners. To address this, I employed several techniques, including oversampling the minority (churn) class using SMOTE (Synthetic Minority Oversampling Technique) and undersampling the majority (non-churn) class.
Furthermore, I focused on feature engineering to create more informative predictors and experimented with different classification algorithms, ultimately finding that a Random Forest model, combined with cost-sensitive learning (adjusting the misclassification costs to penalize false negatives more heavily), provided the best balance between precision and recall for churn prediction. The model's performance was evaluated using metrics appropriate for imbalanced datasets, such as F1-score and AUC, to ensure robust and reliable results.
26. How do you stay up-to-date with the latest developments in the field of statistics?
To stay current in statistics, I regularly engage with several resources. This includes reading academic journals like The Annals of Statistics and Journal of the American Statistical Association, and pre-print servers like arXiv to keep abreast of emerging research. I also follow influential statisticians and organizations (e.g., the American Statistical Association) on social media and subscribe to relevant newsletters to discover new methods, tools, and discussions.
Furthermore, I actively participate in online courses (like those on Coursera or edX), attend webinars, and explore open-source statistical software packages (e.g., R and Python libraries like scikit-learn, statsmodels, and TensorFlow Probability). For instance, I might try to replicate results from a recent paper using these tools to gain a deeper understanding and practical experience.
27. What is the difference between fixed and random effects in a statistical model, and when is each appropriate?
Fixed effects are constant across individuals or groups and are used when you want to model the effect of specific, predetermined factors. You are interested in estimating the specific effects of these factors. For example, different treatments in a clinical trial. Random effects, on the other hand, are used when you want to model the variability between groups or individuals, and these groups are sampled from a larger population. The groups themselves are not of primary interest, but rather the variance between them is. For example, the effect of different schools on student performance, where the schools are considered a random sample from all possible schools.
Fixed effects are appropriate when you want to make inferences about the specific levels of the factor included in your model. Random effects are appropriate when you want to make inferences about the population from which the levels of the factor were sampled. A key distinction lies in whether you're interested in the specific effect of each group (fixed) or the overall variability due to groups (random).
28. Explain the concept of propensity score matching and how it can be used to reduce bias in observational studies.
Propensity score matching (PSM) is a statistical technique used to estimate the effect of a treatment or intervention by accounting for the confounders that could predict both the treatment and the outcome. It is primarily used in observational studies where random assignment to treatment groups is not possible. The propensity score represents the probability of a subject receiving the treatment given their observed characteristics.
PSM reduces bias by creating treatment and control groups that are more similar in terms of observed covariates. This is done by matching each treated subject with one or more control subjects who have similar propensity scores. After matching, the difference in outcomes between the matched treated and control groups can be more confidently attributed to the treatment effect, as the confounding variables have been balanced between the groups. This helps to mitigate selection bias, where treated and untreated individuals differ systematically.
29. How would you design a statistical model to predict customer churn for a subscription-based service?
I'd design a statistical model for customer churn using techniques like Logistic Regression, Survival Analysis (Cox Proportional Hazards), or Random Forests. First, I'd gather relevant data: customer demographics, subscription details (plan type, tenure), usage patterns (frequency of service use, features used), billing information (payment history, failed payments), and customer support interactions. The model would predict the probability of a customer churning within a specific timeframe. Feature engineering is crucial; for instance, creating features like 'average days between logins' or 'percentage of features used'. Model evaluation metrics would include precision, recall, F1-score, AUC, and calibration. Continuous monitoring and model retraining are essential to maintain predictive accuracy as customer behavior evolves.
Statistics MCQ
Question 1.
A researcher wants to determine if the average height of adult males in a specific city is significantly different from 175 cm. A random sample of 100 adult males from the city is taken, and their heights are measured. Which of the following hypothesis tests is most appropriate to use?
Options:
Question 2.
A researcher wants to estimate the average height of students at a university. They take a random sample of 100 students and find the sample mean height to be 170 cm with a sample standard deviation of 10 cm. Construct a 95% confidence interval. What is the margin of error?
Options:
Question 3.
A population has a mean of 50 and a standard deviation of 10. If we take random samples of size 25 from this population, what is the standard deviation of the sampling distribution of the sample mean?
Options:
Options:
Question 4.
A survey of 500 randomly selected adults found that 340 believe that climate change is a serious threat. Construct a 95% confidence interval for the proportion of all adults who believe this.
Options:
Question 5.
A researcher is conducting a hypothesis test with a significance level of α = 0.05. The null hypothesis is that the population mean is 100. The researcher fails to reject the null hypothesis. However, the true population mean is actually 105. If the power of the test is 0.7, what is the probability of committing a Type II error (β)?
Options:
Question 6.
A researcher is conducting a hypothesis test with a significance level of α = 0.05. The null hypothesis is that the population mean is 100. The researcher suspects the true population mean is actually 105. If the probability of committing a Type II error (β) is 0.30, what is the power of the test?
Options:
Question 7.
A researcher wants to estimate the proportion of adults in a city who support a new policy. They want to create a 95% confidence interval with a margin of error of no more than 3%. Assuming they have no prior estimate of the proportion, what is the minimum sample size needed?
Options:
Question 8.
In hypothesis testing, what is the probability of committing a Type I error, given that the null hypothesis is true?
Options:
Options:
Question 9.
A survey found that 60% of adults in a city prefer coffee over tea. If a random sample of 100 adults is selected, what is the approximate probability that more than 65 adults in the sample prefer coffee, using the normal approximation to the binomial distribution?
Options:
Question 10.
A researcher is conducting a one-tailed hypothesis test with a significance level of α = 0.05. The test statistic follows a t-distribution with 25 degrees of freedom. What is the critical value for this test?
Options:
Question 11.
A researcher wants to test the hypothesis that the average height of adult males in a certain city is 175 cm. A random sample of 30 adult males from the city yields a sample mean height of 172 cm and a sample standard deviation of 8 cm. What is the value of the test statistic?
Options:
Question 12.
A researcher wants to estimate the average height of adult women in a city. She collects a random sample of 100 women and finds that the sample mean height is 64 inches with a known population standard deviation of 3 inches. Construct a 95% confidence interval for the population mean height.
Options:
Question 13.
A researcher claims that 60% of adults in a certain town support a new recycling program. To test this claim, a random sample of 100 adults is selected, and it is found that 52 of them support the program. Calculate the test statistic (z-score) for this hypothesis test.
Options:
Question 14.
A random sample of 25 students is selected from a university. The sample mean GPA is 3.2 with a sample standard deviation of 0.4. Construct a 95% confidence interval for the population mean GPA. Assume the population is approximately normally distributed.
Options:
Options:
Question 15.
A researcher wants to estimate the average height of adults in a city. They want to be 95% confident that their estimate is within 0.5 inches of the true average height. Assuming the population standard deviation is 3 inches, what is the minimum sample size required?
Options:
Question 16.
A researcher is conducting a hypothesis test to determine if the average height of adult males in a certain city is greater than 175 cm. They collect a random sample of 100 adult males and find the sample mean height to be 177 cm. Assume the population standard deviation is known to be 8 cm. What is the approximate p-value for this hypothesis test?
Options:
Question 17.
A researcher is testing the hypothesis that the proportion of adults who own a pet is greater than 60%. A random sample of 200 adults found that 130 own a pet. What is the p-value for this hypothesis test?
Options:
Question 18.
Two independent random samples are taken from two populations. The first sample has size n1 = 50, with a sample mean of x̄1 = 120 and a sample standard deviation of s1 = 10. The second sample has size n2 = 60, with a sample mean of x̄2 = 110 and a sample standard deviation of s2 = 12. What is the estimated standard error of the difference between the two sample means (x̄1 - x̄2)?
options:
Options:
Question 19.
Two independent random samples are taken from two populations. The first sample has size n1 = 30, with a sample mean of x̄1 = 75 and a population standard deviation of σ1 = 10. The second sample has size n2 = 40, with a sample mean of x̄2 = 70 and a population standard deviation of σ2 = 12. Construct a 95% confidence interval for the difference between the two population means (μ1 - μ2).
options:
Options:
Question 20.
A researcher wants to test the hypothesis that the average height of adult women is 5'4" (64 inches). A random sample of 100 women is taken, and the sample mean height is found to be 63 inches. Assume the population standard deviation is known to be 2.5 inches. What is the test statistic for this hypothesis test?
Options:
Options:
Question 21.
Two independent random samples are taken from two populations. The first sample has a size of n1 = 15, a sample mean of x̄1 = 68, and a sample standard deviation of s1 = 8. The second sample has a size of n2 = 12, a sample mean of x̄2 = 60, and a sample standard deviation of s2 = 6. Assuming that the population standard deviations are unknown but equal, construct a 95% confidence interval for the difference between the two population means (μ1 - μ2). What are the lower and upper bounds of the confidence interval?
Options:
Question 22.
Two independent samples are taken to test the hypothesis that the means of two populations are different. The following information is known:
Sample 1: n1 = 50, x̄1 = 105, σ1 = 10 Sample 2: n2 = 60, x̄2 = 100, σ2 = 12
What is the value of the test statistic?
Options:
Question 23.
Two independent samples are taken to compare the means of two populations. Sample 1 has a size of n1 = 15, a sample mean of x̄1 = 52, and a sample standard deviation of s1 = 8. Sample 2 has a size of n2 = 12, a sample mean of x̄2 = 48, and a sample standard deviation of s2 = 6. Assume that the population standard deviations are unknown and not equal. What is the value of the test statistic for testing the null hypothesis H0: μ1 = μ2 versus the alternative hypothesis Ha: μ1 ≠ μ2?
Options:
Question 24.
A random sample of 400 adults is selected from a large population. 64% of those sampled favor a new law. Calculate the standard deviation of the sampling distribution of the sample proportion.
Options:
Question 25.
A survey of 500 randomly selected adults found that 340 believe that climate change is a serious threat. Construct a 95% confidence interval for the proportion of all adults who believe that climate change is a serious threat.
options:
Options:
Which Statistics skills should you evaluate during the interview phase?
Assessing a candidate's statistics skills in a single interview can be tricky. You can't cover every concept, but focusing on core competencies is key. Here's what you should evaluate during the interview phase.
Probability
Want to quickly gauge their grasp on probability? An assessment test with relevant MCQs can help filter candidates. Consider using a test like Adaface's Numerical Reasoning test to assess these skills.
To further assess their grasp of probability, ask targeted interview questions. This will help you understand the depth of their knowledge and their ability to apply it.
A jar contains 3 red marbles and 5 blue marbles. What is the probability of picking a red marble at random?
Look for candidates who can clearly explain the concept of probability and correctly calculate the answer. Bonus points if they can discuss conditional probability or related concepts.
Statistical Inference
Consider using an assessment test that features questions that cover statistical inference. Adaface's Data Science test includes these type of questions.
Ask questions that require the candidate to apply statistical inference techniques. This will reveal their analytical skills and how well they understand the underlying principles.
Describe a scenario where you would use a t-test versus a z-test.
The ideal candidate should be able to articulate the differences between t-tests and z-tests. They should also demonstrate an understanding of when to use each test based on sample size and population variance.
Regression Analysis
To evaluate this skill use assessment tests that assesses regression analysis. This kind of questions are present in Data Science test.
Present questions that require the application of regression analysis. This will give you insights into their problem-solving approach and their ability to interpret results.
Explain the difference between linear regression and logistic regression, and when you would use each.
The candidate should be able to articulate the difference between these regressions with example, showing a grasp on the different types of variables and their applications.
Streamline Your Statistics Hiring with Skills Tests and Targeted Questions
When hiring for roles requiring statistical expertise, it's critical to accurately assess candidates' skills. Verifying their statistical abilities ensures they can contribute effectively to your team and projects.
Skills tests are the most reliable way to evaluate a candidate's understanding of statistics. Explore Adaface's Statistics Online Test, Probability Online Test, or the Data Analysis Test to gauge their proficiency.
Once you've used skills tests, you can shortlist the top candidates based on their scores. These qualified applicants can then be invited for interviews to discuss their experience and problem-solving approach.
Ready to hire top statistics talent? Visit Adaface's online assessment platform to get started or sign up for a free trial!
Statistics Test
40 mins | 16 MCQs
The Statistics Online Test evaluates a candidate's understanding and proficiency in statistical concepts and analysis. It covers topics such as statistical methods, data analysis, numerical reasoning, and quantitative aptitude.
Try Statistics Test
Download Statistics interview questions template in multiple formats
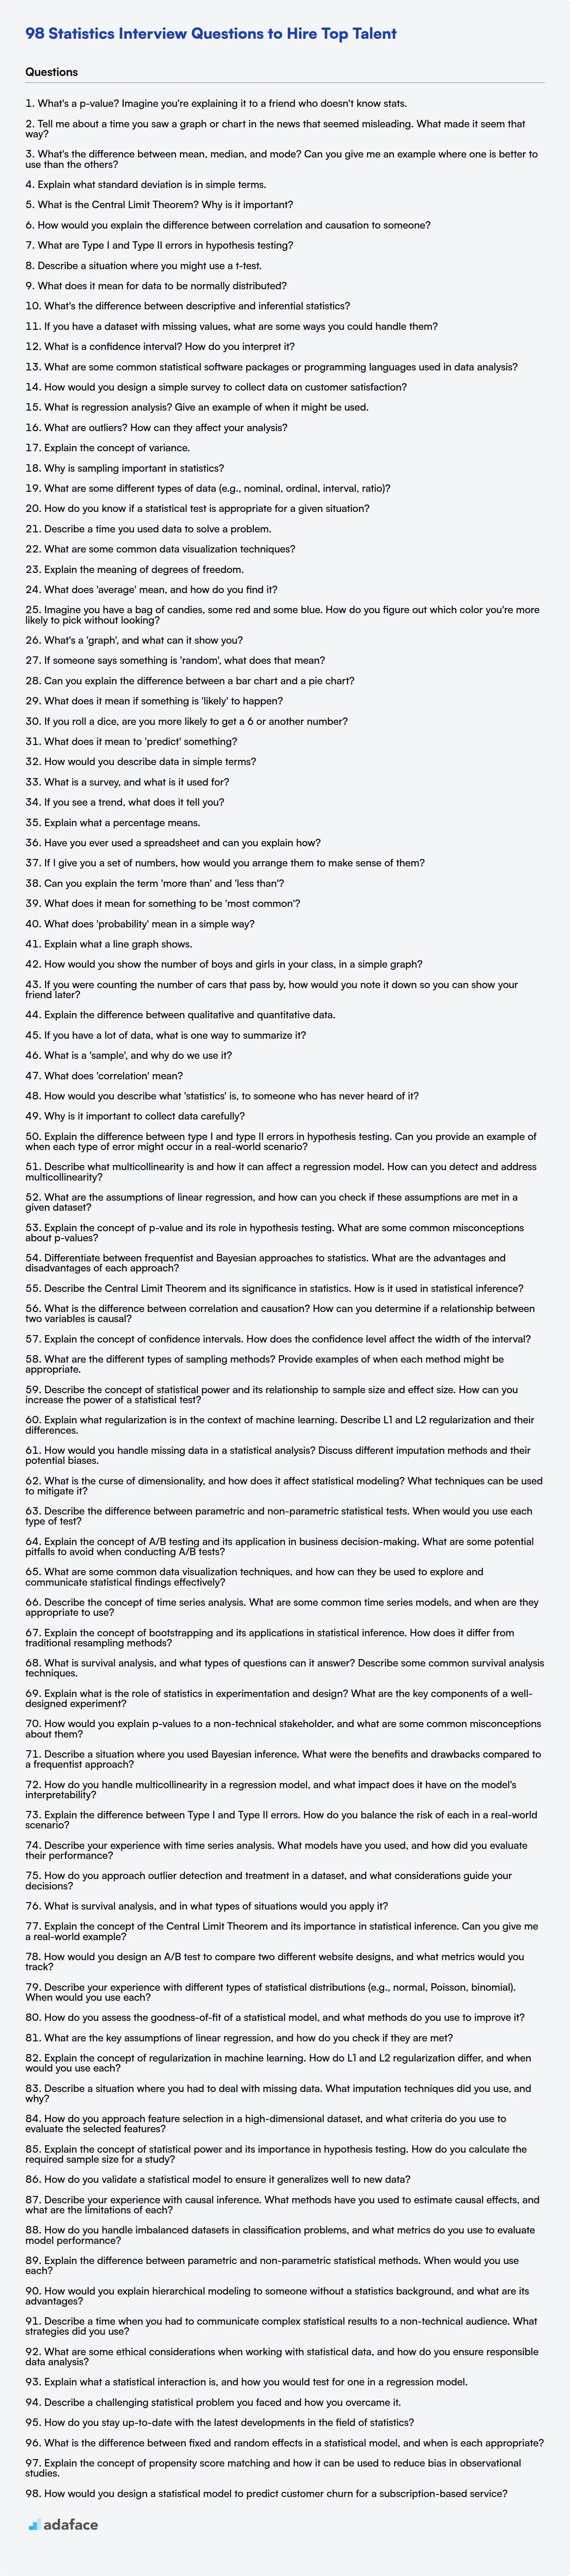
Statistics Interview Questions FAQs
What are some key areas to cover in a statistics interview?
Key areas include probability, statistical inference, regression analysis, experimental design, and data analysis techniques.
How can I assess a candidate's practical skills in statistics?
Present real-world scenarios or datasets and ask candidates to analyze the data, interpret the results, and draw conclusions.
What are some common mistakes to avoid when interviewing statisticians?
Avoid focusing solely on theoretical knowledge; assess practical skills and the ability to communicate findings clearly.
What are some good follow-up questions to ask after a candidate answers a statistics question?
Ask candidates to explain their reasoning, justify their assumptions, and discuss potential limitations of their approach.
How can skills tests help in the statistics hiring process?
Skills tests provide an objective assessment of a candidate's statistical knowledge and abilities, allowing you to identify top performers more accurately.
What kind of questions should I ask experienced statisticians?
Focus on project management, leadership, and their experience with complex statistical models. Ask about challenges they overcame and how they stayed up-to-date with industry trends.
40 min skill tests.
No trick questions.
Accurate shortlisting.
We make it easy for you to find the best candidates in your pipeline with a 40 min skills test.
Try for freeRelated posts
Free resources

Join 1200+ companies in 80+ countries.
Try the most candidate friendly skills assessment tool today.

40 min tests.
No trick questions.
Accurate shortlisting.
No trick questions.
Accurate shortlisting.