
Basic R Language interview questions
1. What are the different data types available in R?
2. How do you install a package in R?
3. Explain the difference between a vector and a list in R.
4. How do you create a data frame in R?
5. What is the use of the `apply` family of functions in R?
6. How do you read data from a CSV file in R?
7. How do you write data to a CSV file in R?
8. Explain the concept of factors in R.
9. How do you handle missing values in R?
10. What is the difference between `<-` and `=` in R?
11. How do you subset a data frame in R?
12. Explain the use of `if` and `else` statements in R.
13. How do you create a function in R?
14. What are the different types of loops available in R?
15. How do you use the `grep` function in R?
16. Explain the use of regular expressions in R.
17. How do you perform basic statistical analysis in R?
18. What is the purpose of the `dplyr` package in R?
19. How do you create a basic plot in R?
20. Explain the use of the `ggplot2` package in R.
21. How do you merge two data frames in R?
22. What is the difference between `cbind` and `rbind` in R?
23. How do you reshape data in R?
24. Explain the use of the `lubridate` package in R.
25. How do you work with dates and times in R?
26. What is the purpose of the `tryCatch` function in R?
27. How do you handle errors in R?
28. Explain the concept of object-oriented programming in R. Is R an object oriented programming language?
29. How do you debug code in R?
30. What are R environments and why are they important?
Intermediate R Language interview questions
1. How would you explain the difference between `apply`, `lapply`, `sapply`, and `tapply` functions in R, and when would you choose to use each one?
2. Describe how you would handle missing data in a dataset using R. What are some common imputation techniques, and what factors would you consider when choosing one?
3. Explain the concept of environments in R. How are they used, and why are they important for managing variables and functions?
4. How do you optimize R code for performance? Describe some techniques for improving speed and memory usage, especially when working with large datasets.
5. What are R's S3 and S4 object systems? Explain the differences between them and provide use cases for when you might choose one over the other.
6. Explain how you would use regular expressions in R for pattern matching and text manipulation. Provide an example of a complex pattern and how you would use it.
7. How would you connect to a database (e.g., SQL) from R? Describe the process of querying data, and handling results.
8. Describe your experience with creating custom functions in R. Include examples of function arguments, return values, and error handling.
9. Explain the concept of scoping rules in R (lexical scoping). How do these rules affect variable access within functions?
10. How would you use the `dplyr` package to perform data manipulation tasks such as filtering, grouping, and summarizing data? Give specific examples.
11. Describe how you would visualize data using `ggplot2`. Explain the grammar of graphics and how to create different types of plots.
12. Explain the purpose of the `devtools` package. How would you use it to create and manage your own R packages?
13. How would you handle errors and exceptions in R code? Describe the use of `try`, `tryCatch`, and `stop` functions.
14. Explain the concept of closures in R. How are they created and used, and what are their benefits?
15. How do you debug R code? Describe your approach to identifying and fixing errors, and mention useful debugging tools.
16. Explain how you would use R for web scraping. Describe the tools and techniques involved in extracting data from websites.
17. How would you create a reproducible R Markdown document? Describe how to embed code, text, and output in a single document.
18. Describe your experience with different R data structures (vectors, lists, matrices, data frames). When would you use each one, and what are their characteristics?
19. Explain how you would use R for time series analysis. Describe some common time series models and how to implement them.
20. How would you implement parallel processing in R to speed up computationally intensive tasks? Describe the tools and techniques involved.
Advanced R Language interview questions
1. Explain the concept of metaprogramming in R and provide a practical example of how you've used it.
2. Describe the difference between lazy evaluation and eager evaluation in R. How does it impact performance?
3. How would you implement memoization in R to optimize a computationally intensive function?
4. Explain the S4 object system in R, highlighting its advantages and disadvantages compared to S3.
5. Describe the use of environments in R for managing scope and data encapsulation. Provide an example.
6. How can you use R's garbage collection to manage memory effectively in long-running applications?
7. Explain how to write custom classes with reference semantics in R using `R6` and what scenarios benefit from this approach.
8. Describe how to use the `compiler` package to improve the performance of R code. What are its limitations?
9. Explain how you would use `Rcpp` to integrate C++ code into an R package for performance gains. Provide a simple example.
10. Describe how to create and manage R packages, including documentation and testing best practices.
11. How would you profile R code to identify performance bottlenecks, and what tools would you use?
12. Explain how to use the `parallel` package (or similar) to parallelize R code execution across multiple cores.
13. Describe the concept of non-standard evaluation (NSE) in R and how you can use it in custom functions.
14. How can you implement custom DSLs (Domain Specific Languages) in R to simplify complex tasks for users?
15. Explain how you would handle large datasets in R that exceed available memory. What strategies and packages would you employ?
16. Describe your experience with using R for developing RESTful APIs. What frameworks or packages did you use?
17. How would you implement robust error handling and logging in an R application intended for production use?
18. Explain how you would use R to perform advanced text mining tasks such as sentiment analysis or topic modeling.
19. Describe how to write custom generic functions and methods in R to handle different data types gracefully.
20. Explain your approach to debugging complex R code, including strategies and tools you find most effective. What is your workflow?
Expert R Language interview questions
1. How would you design an R package for time series analysis, focusing on extensibility and maintainability?
2. Explain the nuances of using `Rcpp` for performance optimization in R, detailing potential pitfalls.
3. Describe your experience with implementing distributed computing using R, highlighting the challenges and solutions.
4. What are the key considerations when deploying R models to production environments, ensuring scalability and reliability?
5. Explain how you would handle large datasets in R that exceed available memory, detailing specific strategies.
6. Describe the process of creating custom visualizations in R beyond standard packages, focusing on interactivity and user experience.
7. How would you approach debugging complex R code involving multiple packages and dependencies, explaining your diagnostic techniques?
8. Explain how to use metaprogramming techniques in R to create flexible and reusable code, providing a practical example.
9. Discuss the trade-offs between different R frameworks for web application development, considering performance and maintainability.
10. How would you design a system for automated model retraining and deployment in R, ensuring continuous improvement?
11. What are the best practices for securing R applications and data, preventing unauthorized access and manipulation?
12. Describe your experience with implementing machine learning algorithms from scratch in R, detailing the challenges and benefits.
13. How would you approach building a custom R package for a specialized statistical analysis technique, ensuring correctness and usability?
14. Explain how to integrate R with other programming languages and systems, such as Python or databases, detailing potential challenges.
15. Describe your experience with contributing to open-source R projects, highlighting the challenges and rewards.
16. How would you optimize R code for execution on different hardware architectures, such as GPUs or specialized processors?
17. Explain how to use R for reproducible research, ensuring that results can be independently verified and replicated.
18. Describe your experience with using R for causal inference, detailing the assumptions and limitations of different methods.
19. How would you approach building a custom R package for data manipulation, focusing on speed and efficiency?
20. Explain how to use R for text mining and natural language processing, detailing the steps involved in cleaning, analyzing, and visualizing text data.
21. How do you handle name collisions in R packages and what strategies do you use to avoid them?
22. When is it appropriate to use S3 vs S4 object oriented programming in R and why?
23. How would you construct a complex simulation study in R, covering design, execution, and analysis of results?
24. Explain the differences between lazy evaluation and eager evaluation in R, and how they impact performance and memory usage.
25. Describe your approach to version controlling R projects and collaborating with other developers using Git and GitHub.

Evaluating candidates for R Language proficiency requires a strategic approach to identify top talent. Similar to hiring for other technical roles such as a programmer, having a well-defined set of interview questions is key to assessing a candidate's skills and knowledge.
This blog post provides a collection of R Language interview questions categorized by skill level, including basic, intermediate, advanced, and expert. It also includes a set of multiple-choice questions to help you gauge a candidate's grasp of core concepts.
By using these questions, you can effectively assess candidates and ensure they possess the R Language skills needed for the job; if you need more help, use Adaface's R online test to screen candidates before the interview.
Table of contents
Basic R Language interview questions
Intermediate R Language interview questions
Advanced R Language interview questions
Expert R Language interview questions
R Language MCQ
Which R Language skills should you evaluate during the interview phase?
Tips for Using R Language Interview Questions
Hire Data Scientists with Confidence Using R Interview Questions and Skills Assessments
Download R Language interview questions template in multiple formats
Basic R Language interview questions
1. What are the different data types available in R?
R has several data types, including:
- Numeric: Represents numerical values. Can be further classified into:
integer: Whole numbers (e.g., 1, 2, -5).double: Floating-point numbers (e.g., 3.14, -2.5).
- Character: Represents strings (e.g., "hello", "world").
- Logical: Represents boolean values:
TRUEorFALSE. - Factor: Represents categorical data with levels. Useful for statistical modeling.
- Complex: Represents complex numbers with real and imaginary parts (e.g.,
2 + 3i). - Raw: Represents raw bytes.
2. How do you install a package in R?
To install a package in R, you primarily use the install.packages() function. For example, to install the ggplot2 package, you would use the following command:
install.packages("ggplot2")
Alternatively, within the RStudio IDE, you can navigate to the 'Packages' tab, click 'Install', and then type the name of the package you want to install. This achieves the same result as the code, but through a graphical interface.
3. Explain the difference between a vector and a list in R.
In R, both vectors and lists are fundamental data structures, but they differ significantly in terms of the data types they can hold. A vector is an ordered collection of elements of the same data type. This means all elements in a vector must be numeric, character, or logical, etc. You can create a vector using the c() function.
Lists, on the other hand, are more flexible. A list can contain elements of different data types. Each element in a list can be a number, string, vector, another list, or even a function. This makes lists suitable for storing complex, heterogeneous data structures. You can also create a list using the list() function.
4. How do you create a data frame in R?
In R, you can create a data frame using the data.frame() function. You supply vectors of the same length as arguments to this function; each vector becomes a column in the resulting data frame.
For example:
my_data <- data.frame(
  Name = c("Alice", "Bob", "Charlie"),
  Age = c(25, 30, 28),
  City = c("New York", "London", "Paris")
)
You can also create data frames by importing data from external files (e.g., CSV, Excel) using functions like read.csv() or read_excel() from the readxl package.
5. What is the use of the `apply` family of functions in R?
The apply family of functions in R (apply, lapply, sapply, tapply, mapply) are used for applying a function to elements of data structures like arrays, lists, and data frames, avoiding explicit loops. They provide a concise and efficient way to perform repetitive operations on subsets of data.
For example, lapply applies a function to each element of a list and returns a list. sapply is similar to lapply but attempts to simplify the result to a vector or matrix if possible. apply applies a function to the rows or columns of a matrix or array. tapply applies a function to subsets of a vector defined by factors. mapply is a multivariate version of sapply, applying a function to multiple lists or vectors in parallel.
6. How do you read data from a CSV file in R?
In R, you can read data from a CSV file using the read.csv() function. This function reads comma-separated values into a data frame.
data <- read.csv("your_file.csv")
Alternatively, you can use read.table() with the sep argument specified as a comma. For more control or larger files, the fread() function from the data.table package is often preferred due to its speed and efficiency. fread() automatically detects separators and handles large files effectively.
library(data.table)
data <- fread("your_file.csv")
7. How do you write data to a CSV file in R?
In R, you can write data to a CSV file using the write.csv() function. This function takes a data frame or matrix as input and writes it to a CSV file. A key argument is the file argument, which specifies the name (and optionally path) of the CSV file to be created. Also important is the row.names argument; setting this to FALSE prevents row names from being written to the CSV. Here's a basic example:
# Sample data frame
data <- data.frame(
  Name = c("Alice", "Bob", "Charlie"),
  Age = c(25, 30, 28),
  City = c("New York", "London", "Paris")
)

# Write the data frame to a CSV file
write.csv(data, file = "mydata.csv", row.names = FALSE)
8. Explain the concept of factors in R.
Factors in R are a data structure used to represent categorical variables. They are especially useful when dealing with data that has a limited number of distinct values, such as gender (male/female), colors (red/green/blue), or survey responses (agree/disagree/neutral). Internally, R stores factors as integers with corresponding labels, making them memory-efficient and computationally faster for statistical analyses.
Key aspects of factors include:
- Levels: The unique values (categories) that the factor can take.
- Labels: Optional descriptive names for the levels (if not provided, the levels themselves are used as labels).
- Factors can be either ordered (levels have a meaningful order, e.g., 'low', 'medium', 'high') or unordered. You can convert a character vector to a factor using
factor()function. Thelevels()function returns the levels of a factor, andas.character()can convert a factor back to a character vector.
9. How do you handle missing values in R?
In R, missing values are represented by NA. Several techniques can be used to handle them.
Common approaches include:
Deletion: Removing rows or columns with
NAvalues. This is simple but can lead to data loss. Functions likena.omit()andcomplete.cases()are useful here.Imputation: Replacing
NAvalues with estimated values. Common methods include:- Mean/Median imputation: Replacing
NAwith the mean or median of the variable. - Model-based imputation: Using regression or other models to predict missing values based on other variables. Packages like
miceoffer sophisticated imputation techniques. - Using a constant value (e.g., 0 or a specific category) where appropriate.
- Mean/Median imputation: Replacing
It's crucial to carefully consider the implications of each approach based on the context and the amount of missing data.
10. What is the difference between `<-` and `=` in R?
<- and = are both assignment operators in R, but they have subtle differences. <- is the preferred assignment operator, especially in functions and when assigning values in the global environment. It is more universally accepted and avoids potential ambiguity.
= is also used for assignment, particularly within function calls to specify argument values (e.g., my_function(arg1 = value1)). While = can be used for assignment outside of function calls, it can sometimes lead to confusion, especially within complex expressions, and its scoping rules are slightly different in some corner cases. Therefore, using <- for general assignment is generally recommended for code clarity and to prevent unexpected behavior.
11. How do you subset a data frame in R?
In R, you can subset a data frame using several methods:
- Using square brackets
[]: This is the most common and versatile method. You specify the rows and columns you want to keep using their indices or names. For example,df[1:5, ]selects the first 5 rows and all columns, whiledf[, c("col1", "col2")]selects all rows and only "col1" and "col2" columns. You can also use logical conditions inside the square brackets to filter rows. Example:df[df$col1 > 10, ]will select all rows where values in 'col1' are greater than 10. - Using the
subset()function: This function is useful for subsetting based on logical conditions. For instance,subset(df, col1 > 10 & col2 == "A")selects rows where 'col1' is greater than 10 and 'col2' is equal to "A". - Using
dplyrpackage: Thedplyrpackage provides powerful and readable functions for data manipulation, includingfilter()for row selection andselect()for column selection. For example,dplyr::filter(df, col1 > 10)anddplyr::select(df, col1, col2)perform similar operations as the bracket notation, but are often more readable, especially with complex conditions.
12. Explain the use of `if` and `else` statements in R.
In R, if and else statements are fundamental control flow structures used to execute different blocks of code based on whether a condition is true or false. The if statement evaluates a logical expression; if the expression is TRUE, the code block following the if is executed. If the expression is FALSE, that code block is skipped.
An else statement can be added after an if statement to specify a block of code to execute when the if condition is FALSE. Optionally, you can use else if to check multiple conditions in sequence. Here's the general syntax:
if (condition) {
  # Code executed if condition is TRUE
} else if (another_condition) {
  # Code executed if another_condition is TRUE
} else {
  # Code executed if all conditions are FALSE
}
13. How do you create a function in R?
In R, you create a function using the function() keyword. The basic syntax is function_name <- function(argument1, argument2, ...) { # Function body; return(value) }. The function body contains the code that will be executed when the function is called.
For example, the following code block shows a simple function that adds two numbers:
add_numbers <- function(a, b) {
  sum <- a + b
  return(sum)
}
14. What are the different types of loops available in R?
R provides several types of loops for iterative tasks:
forloop: Executes a block of code a specified number of times. Useful when you know the number of iterations in advance.for (i in 1:10) { print(i) }whileloop: Executes a block of code as long as a condition is true. Good for situations where the number of iterations is unknown.i <- 1 while (i <= 10) { print(i); i <- i + 1 }repeatloop: Executes a block of code indefinitely until abreakstatement is encountered. Offers maximum control but requires careful condition checking to avoid infinite loops.i <- 1 repeat { print(i); i <- i + 1; if (i > 10) { break } }- Additionally, functions like
lapply,sapply,apply,tapply, andmapplyprovide looping functionality implicitly for operating on vectors, lists, and arrays.
15. How do you use the `grep` function in R?
The grep() function in R is used for pattern matching within character vectors. It searches for occurrences of a regular expression pattern in a vector of strings and returns the indices of the elements that contain a match.
Key aspects of using grep():
Basic Usage:
grep(pattern, x)wherepatternis the regular expression to search for andxis the character vector to search within.Return Value: By default, it returns a vector of indices where matches were found. If
value = TRUEis specified, it returns the actual matched elements of the vectorxrather than their indices.Example:
strings <- c("apple", "banana", "orange", "grape")
grep("a", strings) # Returns: [1] 1 2 3 4 (indices where 'a' is found)
grep("a", strings, value = TRUE) # Returns: [1] "apple" "banana" "orange" "grape" (the strings themselves)
16. Explain the use of regular expressions in R.
Regular expressions in R are powerful tools for pattern matching within strings. R provides several functions for working with regular expressions, primarily through the stringr package (part of the tidyverse) and base R functions like grep, grepl, regexpr, gregexpr, sub, and gsub. These functions allow you to search for, extract, replace, and validate text based on defined patterns. stringr generally offers a more consistent and user-friendly interface than the base R functions.
Common uses include validating input data formats (e.g., email addresses or phone numbers), extracting specific information from text (e.g., finding all dates in a document), and performing find and replace operations (e.g., standardizing text formatting). Some frequently used functions are:
str_detect(): Detects the presence or absence of a pattern in a string.str_extract()andstr_extract_all(): Extracts the first or all occurrences of a pattern from a string.str_replace()andstr_replace_all(): Replaces the first or all occurrences of a pattern in a string.str_split(): Splits a string into substrings based on a pattern.
For example, using stringr to find all words starting with 'a':
library(stringr)
text <- "apple banana apricot avocado"
str_extract_all(text, "\\ba\\w+")
In the above example, \\ba\\w+ is the regular expression that matches a word boundary (\\b) followed by the letter 'a' and one or more word characters (\\w+).
17. How do you perform basic statistical analysis in R?
In R, basic statistical analysis can be performed using built-in functions and packages. For descriptive statistics, you can use functions like mean(), median(), sd() (standard deviation), var() (variance), min(), max(), and quantile() to summarize data. The summary() function provides a concise overview of the data, including quartiles and mean.
For inferential statistics, R offers functions for hypothesis testing such as t.test() (t-test), wilcox.test() (Wilcoxon test), cor.test() (correlation test), and chisq.test() (chi-squared test). Linear models are created and analyzed using lm() and ANOVA is performed using anova() on lm() objects. Packages like dplyr and tidyr are useful for data manipulation and preparation before analysis, while ggplot2 can be used to visualize the data and results.
18. What is the purpose of the `dplyr` package in R?
The dplyr package in R is primarily designed for data manipulation. Its main purpose is to provide a consistent set of verbs that help you solve the most common data manipulation challenges. It focuses on making data manipulation more intuitive and efficient.
Specifically, dplyr provides functions to perform operations like:
- Filtering rows (
filter()) - Selecting columns (
select()) - Arranging or sorting rows (
arrange()) - Mutating or adding new columns (
mutate()) - Summarizing data (
summarize()) - Grouping data (
group_by())
It is designed to work seamlessly with the pipe operator (%>%) to create a fluid and readable workflow. For example:
data %>%
  filter(column1 > 10) %>%
  select(column1, column2) %>%
  summarize(mean_column2 = mean(column2))
19. How do you create a basic plot in R?
To create a basic plot in R, you typically use the plot() function. The simplest usage involves passing a vector of numeric data to plot(), which will then plot the values against their index. For example, plot(c(1, 3, 5, 2, 4)) will generate a scatter plot.
Alternatively, you can provide two vectors to plot(x, y) where 'x' represents the x-axis values and 'y' represents the y-axis values. You can customize the plot using various arguments within the plot() function, such as type to specify the plot type (e.g., "l" for lines, "b" for both points and lines), main for the title, xlab for the x-axis label, and ylab for the y-axis label. For example: plot(1:5, c(2,4,1,3,5), type = "l", main = "My Plot", xlab = "X-axis", ylab = "Y-axis").
20. Explain the use of the `ggplot2` package in R.
ggplot2 is a powerful R package for creating declarative data visualizations, based on the Grammar of Graphics. Instead of specifying each element of a plot individually, you build plots layer by layer by specifying data, aesthetics (like color, size, and position), and geoms (geometric objects like points, lines, and bars).
Key components of ggplot2 include:
data: The dataset being visualized.aes(): Aesthetic mappings that link variables in the data to visual properties (e.g.,aes(x = variable1, y = variable2, color = variable3)).geom_*(): Geometric objects that represent the data (e.g.,geom_point(),geom_line(),geom_bar()).facet_*(): Creating small multiples of plots based on categorical variables.scale_*(): Controlling the mapping between data values and aesthetic values (e.g., specifying color palettes).theme(): Modifying non-data ink like titles, labels, and background colors.
Example:
library(ggplot2)

ggplot(data = mtcars, aes(x = mpg, y = wt, color = factor(cyl))) +
  geom_point() +
  labs(title = "MPG vs. Weight", x = "Miles per Gallon", y = "Weight", color = "Cylinders")
21. How do you merge two data frames in R?
In R, you can merge two data frames using the merge() function. The basic syntax is merge(x, y, by = "column_name"), where x and y are the data frames you want to merge, and column_name is the common column they share. If the common columns have different names in each data frame, you can use by.x and by.y to specify the respective column names, like this: merge(x, y, by.x = "col_in_x", by.y = "col_in_y").
You can control the type of join with the all, all.x, and all.y arguments. all = TRUE performs a full outer join, all.x = TRUE performs a left outer join, and all.y = TRUE performs a right outer join. If you want an inner join (only rows with matching keys are returned), the default is all = FALSE.
22. What is the difference between `cbind` and `rbind` in R?
cbind() and rbind() are functions in R used to combine data structures.
cbind()combines vectors, matrices, or data frames by columns. It requires that the objects being combined have the same number of rows (or be coercible to the same number of rows by recycling). If inputs have column names, the resulting combined object will inherit those column names. If the same column name appears in multiple inputs, R will add suffixes.1,.2, etc. to make them unique.rbind()combines vectors, matrices, or data frames by rows. It requires that the objects being combined have the same number of columns (or be coercible to the same number of columns). It's effectively appending one data structure below another. If inputs have column names, these must match forrbind()to work properly; the resulting object will inherit these column names.
23. How do you reshape data in R?
In R, reshaping data is primarily done using functions from packages like reshape2 and tidyr. reshape2 provides functions like melt() to convert wide-format data to long-format and dcast() to aggregate and transform long-format data back into wide-format. tidyr, part of the tidyverse, offers more intuitive functions like pivot_longer() (replaces melt()) and pivot_wider() (replaces dcast()) for similar data transformations. Using gather() and spread() functions are also common for converting between wide and long formats, respectively, though pivot_longer() and pivot_wider() are generally preferred for their clarity and versatility.
For example, pivot_longer() can take multiple columns and combine them into a single column, while pivot_wider() can spread values from one column across multiple new columns based on the values in another column. Data manipulation using dplyr package is often combined with reshaping for filtering, grouping and summarizing data before or after the reshaping process. Consider this code example: library(tidyr); data %>% pivot_longer(cols = starts_with("var"), names_to = "variable", values_to = "value").
24. Explain the use of the `lubridate` package in R.
The lubridate package in R simplifies working with dates and times. It provides intuitive functions for parsing, manipulating, and formatting date-time objects, making date-time operations more human-readable and less error-prone. For example, instead of using strptime with complex format strings, lubridate offers functions like ymd(), mdy(), and hms() to parse dates in year-month-day, month-day-year, and hour-minute-second formats, respectively.
lubridate also offers convenient functions for extracting components like year, month, day, hour, minute, and second from a date-time object. It simplifies date arithmetic, allowing you to easily add or subtract periods (e.g., days, weeks, months, years) from dates. Time zones and time spans are also handled with more ease using lubridate.
25. How do you work with dates and times in R?
R provides several classes for working with dates and times. The primary ones are Date for dates only, POSIXct and POSIXlt for date and time information. POSIXct stores date/time as seconds since the epoch (1970-01-01 00:00:00 UTC) and is better for storage/calculations. POSIXlt stores date/time as a list of components (year, month, day, hour, etc.).
Key functions include Sys.Date() to get the current date, Sys.time() to get the current date and time, as.Date() and as.POSIXct() to convert character strings to date/time objects, format() to format dates/times for display, and functions from the lubridate package like ymd(), mdy(), dmy() which help in parsing date strings reliably. Date arithmetic is also straightforward; you can add or subtract days from dates and calculate time differences using difftime().
26. What is the purpose of the `tryCatch` function in R?
The tryCatch function in R is used for error handling. It allows you to execute a block of code and gracefully handle any errors or warnings that might occur during its execution.
Specifically, it tries to evaluate an expression. If an error or warning occurs, tryCatch can execute specified handler functions. This prevents the program from crashing and allows you to take alternative actions, like logging the error, returning a default value, or attempting a different approach. You can have separate handlers for errors and warnings, allowing you to tailor your response to the specific issue. tryCatch also provides a finally block which is always executed, regardless of whether an error occurred, useful for cleanup tasks (e.g., closing connections).
27. How do you handle errors in R?
In R, error handling can be managed using a combination of techniques. Primarily, try(), tryCatch(), and stop() are used. try() attempts to execute an expression and returns an error object if it fails, allowing the script to continue. tryCatch() provides more granular control, letting you specify handlers for errors, warnings, and messages.
stop() is used to signal an error and halt execution. For debugging, options(error = recover) can be set to enter a debugging session upon encountering an error. Condition handling allows intercepting and reacting to different condition types beyond just errors (e.g., warnings). warning() signals a warning message, and these messages are usually non-fatal. suppressWarnings() can be used to stop the warnings being displayed. Custom error messages using stop(paste0("Error: ", message)) can provide more useful information to the user.
28. Explain the concept of object-oriented programming in R. Is R an object oriented programming language?
While R is not a purely object-oriented programming (OOP) language in the same vein as Java or C++, it supports several OOP paradigms. R has multiple object-oriented systems, primarily S3, S4, and R6. S3 is the simplest and most informal, relying on generic functions and class attributes. S4 provides a more formal system with class definitions and method dispatch. R6 is a more recent system that provides encapsulation and allows methods to modify objects directly, resembling class-based OOP more closely.
Technically, R can be considered an OOP language because it allows you to define classes, create objects (instances of classes), and implement methods that operate on those objects. However, the way it achieves this differs from classical OOP languages. R primarily uses a functional programming paradigm and adds OOP features on top of it. So, while not a 'pure' OOP language, R definitely has object-oriented capabilities.
29. How do you debug code in R?
Debugging R code involves several techniques. print() statements are the simplest, allowing you to inspect variable values at different points. More sophisticated debugging can be achieved using R's built-in debugger via the browser() function. Inserting browser() into your code pauses execution, allowing you to step through lines, inspect variables, and execute commands in a debugging environment. You can use commands like n (next), c (continue), Q (quit), and where to navigate the call stack.
RStudio provides a user-friendly debugging interface with breakpoints, step-by-step execution, and variable inspection. Packages like debugr also provide useful features. Error messages and warnings are valuable for identifying the source of problems; carefully examining these messages is crucial.
30. What are R environments and why are they important?
R environments are data structures that contain objects like variables, functions, and other environments. They act as namespaces, isolating variables and functions, preventing naming conflicts and ensuring code reproducibility. Each environment has a parent environment, forming a hierarchy. The global environment, where user-defined objects reside, sits at the top, with packages and namespaces forming other environments.
Environments are important because they:
- Organize code: They keep related objects together, improving code readability and maintainability.
- Prevent naming conflicts: By isolating variables, they avoid accidental overwriting of objects with the same name.
- Control scope: They determine which objects are accessible from different parts of the code, controlling variable visibility.
- Support modularity: Packages are built on environments, allowing for the reuse of code.
- Enable encapsulation: They allow the bundling of data and code, hiding internal details.
Intermediate R Language interview questions
1. How would you explain the difference between `apply`, `lapply`, `sapply`, and `tapply` functions in R, and when would you choose to use each one?
apply, lapply, sapply, and tapply are all functions in R used for applying a function to elements of data structures, but they differ in the input they take and the output they return.
apply operates on matrices or arrays, applying a function over rows or columns (specified by margin). lapply works on lists or vectors, applying a function to each element and returning a list. sapply is similar to lapply but attempts to simplify the output to a vector or matrix if possible. tapply applies a function to subsets of a vector, defined by factors. For example:
- Use
applywhen you need to perform calculations on rows or columns of a matrix/array. - Use
lapplywhen you need to apply a function to each element of a list and want a list as the result. - Use
sapplywhen you need to apply a function to each element of a list/vector and want a simplified output (vector, matrix). - Use
tapplywhen you need to apply a function to subsets of a vector based on one or more factors.
2. Describe how you would handle missing data in a dataset using R. What are some common imputation techniques, and what factors would you consider when choosing one?
Handling missing data in R involves identifying, understanding, and then addressing it using suitable techniques. First, I'd use functions like is.na() and summary() to detect and quantify missing values. Visualizations (e.g., VIM::aggr()) can help reveal patterns. Then, depending on the nature of the missing data (MCAR, MAR, or MNAR) and the goals of the analysis, I'd choose an imputation method. Common techniques include:
- Mean/Median Imputation: Simple but can distort distributions and underestimate variance.
- Mode Imputation: Applicable for categorical data.
- Regression Imputation: Predicts missing values based on other variables; more sophisticated but assumes a linear relationship.
- Multiple Imputation (e.g., using
micepackage): Creates multiple plausible datasets, accounting for uncertainty. Preferred for more rigorous analysis. - k-Nearest Neighbors (k-NN) Imputation: Imputes based on similar observations.
Factors in choosing an imputation method include: the amount of missing data, the type of data (numeric, categorical), the underlying distribution, the relationships between variables, and the potential impact on subsequent analyses. For example, if data is MCAR and the missing percentage is low, a simpler method like mean imputation might be acceptable. However, if the missingness depends on other variables (MAR) or the amount of missing data is substantial, multiple imputation would be more appropriate to avoid biased results. Also, consider the computational cost versus the improvement in accuracy and the interpretability of the results.
3. Explain the concept of environments in R. How are they used, and why are they important for managing variables and functions?
In R, an environment is a collection of name-value pairs, where names are symbols and values can be anything from variables and functions to other environments. Environments provide a hierarchical structure for organizing and managing these objects. Think of them as containers or namespaces.
Environments are crucial because they allow you to avoid naming conflicts, encapsulate code, and control the scope of variables. When R looks for a variable, it searches environments in a specific order (the environment's enclosing environments), a process called lexical scoping. This prevents functions from accidentally modifying variables in other parts of your code and helps maintain code clarity and reproducibility. For instance, function execution creates local environments, ensuring that changes within a function don't affect the global environment unless explicitly intended. The global environment, globalenv(), is where you typically define objects in your interactive R session, and packages also have their own environments.
4. How do you optimize R code for performance? Describe some techniques for improving speed and memory usage, especially when working with large datasets.
Optimizing R code involves strategies to improve speed and reduce memory usage. Vectorization is key, replacing explicit loops with functions like apply, lapply, sapply, or mapply. Use efficient data structures such as matrices or data tables (from the data.table package) for large datasets. Pre-allocate memory when possible, especially for growing objects in loops. Profiling tools like profvis or system.time help identify performance bottlenecks. Use appropriate data types (e.g., integer instead of numeric when suitable) to minimize memory footprint.
For large datasets, consider using packages like data.table which is optimized for speed and memory efficiency, especially for data manipulation tasks. dplyr can also improve performance, but data.table often outperforms it on very large datasets. Chunking data and processing it in smaller pieces can help avoid memory overflow errors. For computationally intensive tasks, consider using parallel processing via packages like parallel or future to leverage multiple cores. Consider Rcpp if you need to write performance-critical code in C++ and integrate it with your R code.
5. What are R's S3 and S4 object systems? Explain the differences between them and provide use cases for when you might choose one over the other.
R's S3 and S4 are object-oriented (OO) systems. S3 is simpler and more informal, based on generic functions. A method is chosen based on the class attribute of the first argument. It's easy to use and good for quick prototyping or simple OO needs. S4 is more formal, using class definitions and method dispatch based on the signature (classes of multiple arguments). S4 provides stricter type checking and allows for multiple dispatch, making it suitable for complex systems where robustness and maintainability are crucial. For example, S3 is appropriate for creating simple statistical models; S4 might be chosen for building a sophisticated financial modeling package requiring precise data validation.
Key differences include:
- Formality: S3 is informal, S4 is formal and requires class definitions.
- Method Dispatch: S3 uses single dispatch (first argument), S4 uses multiple dispatch (signature).
- Type Checking: S4 has stricter type checking than S3.
- Slots: S4 objects have defined slots; S3 objects are essentially lists. S4 slots can only be accessed through explicit accessors (e.g.,
@operator).
6. Explain how you would use regular expressions in R for pattern matching and text manipulation. Provide an example of a complex pattern and how you would use it.
Regular expressions in R are primarily handled by functions from the stringr package (part of the tidyverse) or base R's grep, grepl, sub, and gsub. For pattern matching, str_detect (from stringr) or grepl returns a logical vector indicating whether a pattern is found in each string of a character vector. For extracting matches, str_extract or regmatches can be used. For replacing patterns, str_replace and str_replace_all (from stringr) or sub and gsub (from base R) are employed.
For example, consider extracting all email addresses from a text string. A complex pattern for this might be:
"[a-zA-Z0-9._%+-]+@[a-zA-Z0-9.-]+\.[a-zA-Z]{2,}".
To use it:
library(stringr)
text <- "Contact us at support@example.com or sales@another.co.uk for assistance."
emails <- str_extract_all(text, "[a-zA-Z0-9._%+-]+@[a-zA-Z0.9.-]+\.[a-zA-Z]{2,}")[[1]]
print(emails)
This code uses str_extract_all to find all occurrences of the email pattern in the text string. The [[1]] is used because str_extract_all returns a list even when operating on a single string.
7. How would you connect to a database (e.g., SQL) from R? Describe the process of querying data, and handling results.
To connect to a database (e.g., SQL) from R, you'd typically use packages like DBI along with a database-specific driver (e.g., RMySQL, RPostgreSQL, RSQLite). The basic process involves these steps:
- Install packages:
install.packages(c("DBI", "RMySQL"))(replaceRMySQLwith the appropriate driver). - Establish a connection:
library(DBI) con <- dbConnect(RMySQL::MySQL(), dbname = "your_db", host = "your_host", user = "your_user", password = "your_password") - Query the database:
result <- dbGetQuery(con, "SELECT * FROM your_table")ordbExecute(con, "UPDATE your_table SET column = value WHERE condition")for non-SELECT queries. - Handle results: The
resultfromdbGetQueryis usually a data frame. You can then manipulate it using standard R functions. - Close the connection:
dbDisconnect(con)to release resources.
8. Describe your experience with creating custom functions in R. Include examples of function arguments, return values, and error handling.
I have extensive experience creating custom functions in R. I routinely define functions to encapsulate reusable logic, improve code readability, and perform specialized calculations. Function arguments can include numeric values, strings, vectors, data frames, and even other functions. For example, a function calculate_mean(data, na.rm = TRUE) might take a numeric vector data and a boolean na.rm as arguments. Return values can be any R object. Error handling is implemented using tryCatch or if statements to check for invalid inputs or unexpected conditions, returning NULL or an error message using stop() or warning() as needed. For instance:
my_function <- function(x) {
  if (!is.numeric(x)) {
    stop("Input must be numeric")
  }
  return(x * 2)
}
This my_function accepts a numeric input x, performs a check to ensure that x is numeric. If not, it throws an error, otherwise it doubles the input and returns the value. I also utilize functions for data manipulation, statistical modeling, and creating custom visualizations.
9. Explain the concept of scoping rules in R (lexical scoping). How do these rules affect variable access within functions?
Lexical scoping, also known as static scoping, governs how R resolves free variables (variables that are not defined within a function) in a function. R searches for the value of a free variable in the environment where the function was defined, not where it was called. This means the enclosing environment during function definition determines variable lookup.
This behavior affects variable access within functions as follows: When a function encounters a variable, it first looks for it in its local environment. If not found, it searches the environment in which the function was defined. This process continues up the chain of enclosing environments until the variable is found or the global environment is reached. If the variable is not found in any of these environments, R will throw an error. Consider the following:
y <- 10
f <- function(x) {
  y + x
}

g <- function() {
  y <- 20
  f(5)
}

g() # Returns 15 (y from the global environment is used)
10. How would you use the `dplyr` package to perform data manipulation tasks such as filtering, grouping, and summarizing data? Give specific examples.
The dplyr package in R provides a grammar of data manipulation, making it easy to perform tasks like filtering, grouping, and summarizing data. Here's how it's used with examples:
Filtering data is done using filter(). For example, filter(my_data, column_name > 10) selects rows where column_name is greater than 10. Grouping data is achieved using group_by(). For instance, group_by(my_data, category) groups the data by the category column. Summarizing data involves using summarize() after grouping. For example, my_data %>% group_by(category) %>% summarize(mean_value = mean(value)) calculates the mean of the value column for each category. dplyr also offers other important functions like mutate() to create new columns and select() to choose specific columns. These functions can be chained together using the pipe operator (%>%) for concise and readable data manipulation workflows.
11. Describe how you would visualize data using `ggplot2`. Explain the grammar of graphics and how to create different types of plots.
ggplot2, an R package, implements the grammar of graphics, allowing for flexible and powerful data visualization. The grammar comprises several key components:
- Data: The dataset you want to visualize.
- Aesthetics: Mapping variables in your data to visual properties like
x,y,color,size, andshape. These are defined using theaes()function. - Geometries: The type of visual mark used to represent the data, such as
geom_point()(scatterplots),geom_line()(line graphs),geom_bar()(bar charts),geom_histogram()(histograms), andgeom_boxplot()(boxplots). - Facets: Splitting the plot into multiple subplots based on one or more categorical variables using
facet_wrap()orfacet_grid(). - Scales: Controls the mapping between data values and aesthetic values. For example, using
scale_color_gradient()to map a continuous variable to a color gradient. - Coordinate System: Typically Cartesian, but can be transformed (e.g., polar coordinates).
- Theme: Overall visual style of the plot. For instance, you can change background colors or font sizes using pre-built themes or customize elements.
To create a plot, you start with ggplot(data, aes(x = variable1, y = variable2)), specifying the data and aesthetics. Then, you add one or more geometries using the + operator to create different plot types. For example, ggplot(data, aes(x = var1, y = var2)) + geom_point() creates a scatter plot.
12. Explain the purpose of the `devtools` package. How would you use it to create and manage your own R packages?
The devtools package in R provides tools to streamline the process of developing, testing, and distributing R packages. Its primary purpose is to simplify package creation and management, offering functions for common tasks like creating package skeletons, building documentation, installing from source, testing, and checking package integrity. It helps ensure that your package adheres to R's package development standards.
To create and manage packages with devtools, you would typically use functions like create_package("yourpackagename") to create a basic package structure. You'd then add your R code to the R/ directory. Use document() to generate documentation from roxygen2 comments. load_all() allows you to load all functions in your package for testing during development. check() performs a comprehensive check of your package for errors, warnings, and notes. Finally, build() creates a distributable package archive. install() installs your local version. use_testthat() sets up tests in your package using testthat.
13. How would you handle errors and exceptions in R code? Describe the use of `try`, `tryCatch`, and `stop` functions.
In R, errors and exceptions can be handled using try, tryCatch, and stop. try attempts to execute a block of code and returns an error object if an error occurs, but it doesn't halt execution. tryCatch provides more granular control, allowing you to specify handlers for different types of conditions (errors, warnings, messages). It uses the following structure:
tryCatch({
  # Code that might throw an error
  expr
}, error = function(e) {
  # Handle errors
  print(paste("Error:", e))
}, warning = function(w) {
  # Handle warnings
  print(paste("Warning:", w))
}, finally = {
  # Code that always executes
  # optional cleanup code
})
stop is used to signal an error and immediately halt execution. For example, if (x < 0) stop("x must be non-negative"). Use it when the program cannot continue safely. Choosing the right approach depends on whether you want to continue execution despite errors, handle specific error types, or halt immediately.
14. Explain the concept of closures in R. How are they created and used, and what are their benefits?
In R, a closure is a function object that remembers values in enclosing lexical scopes, even if those scopes are no longer active. Closures are created when a function is defined inside another function; the inner function 'closes over' the environment of the outer function, capturing variables defined in that outer function's scope.
To create a closure, you define a function within another function. The inner function can then access variables from the outer function's scope. When the outer function returns, the inner function retains access to these variables, even though the outer function's environment is no longer active. This can be beneficial for creating functions that maintain state, encapsulating data, and implementing function factories (functions that return other functions configured with specific parameters). For example:
make_multiplier <- function(x) {
  function(y) {
    x * y
  }
}

doubler <- make_multiplier(2)
tripler <- make_multiplier(3)

doubler(5) # Returns 10
tripler(5) # Returns 15
Benefits of closures include:
- Data encapsulation: Variables from the enclosing scope are only accessible through the closure.
- State maintenance: Closures can 'remember' values across multiple calls.
- Code reusability: Function factories can generate specialized functions.
15. How do you debug R code? Describe your approach to identifying and fixing errors, and mention useful debugging tools.
Debugging R code involves a systematic approach. First, I reproduce the error. Then I examine the error message closely, which often gives hints about the source of the problem (e.g., incorrect data type, missing variable). I use print() statements or cat() to display intermediate values and track the flow of execution. For more complex scenarios, I rely on R's built-in debugging tools, like browser() to pause execution and inspect the environment, and trace() to monitor function calls. I also use options(error = recover) for post-mortem debugging.
Specific tools and techniques I find useful include:
debug()/undebug(): Turns on/off debugging mode for a function, allowing step-by-step execution.browser(): Inserts a breakpoint, opening an interactive debugging session.traceback(): Shows the call stack after an error.RStudio's debugger: Provides a GUI for stepping through code, setting breakpoints, and inspecting variables.lintrpackage: Helps identify potential code style issues and errors before runtime. I often examine warning messages because they often expose the root cause of an error. Finally, I write unit tests usingtestthatto prevent regressions and ensure code correctness after fixing bugs.
16. Explain how you would use R for web scraping. Describe the tools and techniques involved in extracting data from websites.
R can be used for web scraping using packages like rvest, httr, and XML. rvest is built on top of httr and xml2, simplifying the process. First, use read_html() from rvest to download the HTML content of a webpage. Then, use CSS selectors or XPath expressions with functions like html_nodes() to identify specific elements to extract.
Once the nodes are selected, use html_text() to extract the text content or html_attr() to extract attribute values (e.g., href from a link). The extracted data can then be organized into data frames for further analysis. Error handling (using tryCatch) and respecting the website's robots.txt are crucial for responsible scraping. For dynamic websites, RSelenium could be used to control a web browser.
17. How would you create a reproducible R Markdown document? Describe how to embed code, text, and output in a single document.
To create a reproducible R Markdown document, ensure that you include all necessary code, text, and output in a single, self-contained file. Use inline code using code to embed R code within text. Chunks are used to embed larger blocks of code and their output (tables, plots). Chunks are defined by ```{r} and ````. You can control how the code is executed and the output displayed using chunk options, such asecho=FALSEto hide the code,results='hide'to hide the output, orfig.heightandfig.width` to control plot dimensions.
Reproducibility is enhanced by specifying all packages used with library() at the beginning and setting the working directory using setwd() or creating an R project. Furthermore, use sessionInfo() at the end of the document to record the versions of all packages used. To render the document, use the rmarkdown::render() function or click the 'Knit' button in RStudio. This will execute the R code and weave the code, text, and output into a single document (e.g., HTML, PDF, or Word).
18. Describe your experience with different R data structures (vectors, lists, matrices, data frames). When would you use each one, and what are their characteristics?
I have experience using vectors, lists, matrices, and data frames in R. Vectors are one-dimensional arrays that store elements of the same data type. I'd use them for storing simple sequences of numbers or characters. Lists are ordered collections that can hold elements of different data types; these are useful when I need to combine dissimilar data types into a single object. Matrices are two-dimensional arrays where all elements must be of the same data type; they're ideal for mathematical operations or representing tabular data where consistent data types are present. Data frames, similar to tables or spreadsheets, are the most commonly used data structure in R for storing tabular data. Columns can be of different data types. I often use data frames for statistical analysis and data manipulation using packages like dplyr and data.table.
Key characteristics include:
- Vectors: Atomic, 1D, same data type.
- Lists: Ordered, can hold different data types.
- Matrices: 2D, same data type.
- Data Frames: Tabular, columns can have different data types.
19. Explain how you would use R for time series analysis. Describe some common time series models and how to implement them.
R offers extensive capabilities for time series analysis. I'd begin by loading the time series data into an R time series object using ts(). Exploratory analysis would involve visualizing the data using plot.ts(), examining the autocorrelation and partial autocorrelation functions (ACF and PACF) using acf() and pacf() to identify potential model orders, and checking for stationarity (e.g., using the Augmented Dickey-Fuller test via adf.test()).
Common time series models in R include ARIMA (Autoregressive Integrated Moving Average) models. I'd estimate ARIMA models using arima(), specifying the (p, d, q) orders based on ACF/PACF analysis or through automated model selection with auto.arima() from the forecast package. Other models like Exponential Smoothing State Space models can be fitted via ets() function. Model evaluation includes examining residuals for randomness, using Ljung-Box test and comparing AIC/BIC values using AIC() or BIC(). Finally, I'd use the fitted model to forecast future values using forecast() or predict(), and evaluate forecast accuracy via metrics such as Mean Absolute Error (MAE) or Root Mean Squared Error (RMSE) on a holdout dataset or using cross-validation techniques available in tsCV() function.
20. How would you implement parallel processing in R to speed up computationally intensive tasks? Describe the tools and techniques involved.
R offers several packages for parallel processing. The parallel package, included with base R, provides functions like mclapply (for Unix-like systems) and parLapply (for Windows) to distribute tasks across multiple cores. foreach combined with doParallel or doMC provides a flexible framework for parallel loops. future and furrr are another option offering a unified interface for various parallel backends.
To implement parallel processing, you would typically:
- Register a parallel backend (e.g., using
registerDoParallel(cores = detectCores())withdoParallel). - Divide your computationally intensive task into smaller, independent chunks.
- Apply a parallel function like
parLapply,foreach, orfuture_mapto process these chunks concurrently. - Combine the results from each parallel process to obtain the final output. Code example:
library(parallel); cl <- makeCluster(detectCores()); parLapply(cl, data, function(x) { #computationally intensive function }); stopCluster(cl)
Advanced R Language interview questions
1. Explain the concept of metaprogramming in R and provide a practical example of how you've used it.
Metaprogramming in R refers to the ability of a program to manipulate itself or other programs as data. This allows you to write code that generates code, modifies code, or inspects code at runtime. Key aspects include working with expressions, symbols, and function calls, and often involves functions like quote(), eval(), substitute(), and parse().
For example, I once used metaprogramming to create a function that automatically generated data validation functions for different data types. Instead of writing a separate validation function for each column in a dataset, I created a function that took the column name and data type as input, and dynamically created the appropriate validation function using substitute() and eval(). This significantly reduced code duplication and made it easier to maintain data quality checks. Here is a simplified example:
make_validator <- function(column_name, type) {
  expr <- substitute({
    validate_col <- function(data) {
      if (!is(data[[column_name]], type)) {
        stop(paste(column_name, "must be of type", type))
      }
    }
  }, list(column_name = column_name, type = type))
  eval(expr)
}

my_validator <- make_validator("age", "numeric")
2. Describe the difference between lazy evaluation and eager evaluation in R. How does it impact performance?
Lazy evaluation (also known as non-strict evaluation) in R means that expressions are not evaluated until their values are actually needed. Eager evaluation (also known as strict evaluation), on the other hand, evaluates expressions immediately when they are encountered. Most programming languages including python are eager.
Lazy evaluation can improve performance by avoiding unnecessary computations. If a function argument is never used within the function, it will never be evaluated, saving processing time. However, it can also make debugging more difficult because errors may not be apparent until much later in the program's execution. Eager evaluation, while potentially less efficient in some cases, can lead to more predictable behavior and easier debugging, because errors are caught earlier. In R, you can force evaluation with force().
3. How would you implement memoization in R to optimize a computationally intensive function?
Memoization in R can be implemented by storing the results of function calls in a cache (usually a list or environment) and returning the cached result when the same inputs occur again. A basic approach involves creating a wrapper function that first checks if the result for the given input arguments is already present in the cache. If yes, it returns the cached value; otherwise, it calls the original computationally intensive function, stores the result in the cache, and then returns it. An efficient implementation uses the digest package to create a unique key representing the function's arguments, ensuring proper handling of various data types.
Here's a code example:
library(digest)

memoize <- function(f) {
  cache <- new.env(parent = emptyenv())

  function(...) {
    key <- digest(list(...))
    if (exists(key, envir = cache, inherits = FALSE)) {
      return(get(key, envir = cache))
    } else {
      result <- f(...)
      assign(key, result, envir = cache)
      return(result)
    }
  }
}

# Example usage:
# slow_function <- function(x) { Sys.sleep(1); x^2 }
# memoized_function <- memoize(slow_function)
# memoized_function(2) # First call takes 1 second
# memoized_function(2) # Second call returns instantly from cache
4. Explain the S4 object system in R, highlighting its advantages and disadvantages compared to S3.
The S4 object system in R is a more formal and rigorous system than S3. S4 uses class definitions to specify the structure and behavior of objects. This includes defining slots (data fields) with specific types and methods that operate on objects of that class. A key advantage is formal method dispatch, where the correct method is selected based on the class of all arguments, not just the first as in S3. This provides better code organization and prevents unexpected behavior. Another advantage is formal class definitions which leads to more robust and predictable code.
However, S4 also has disadvantages. It is more complex to implement initially. Defining classes and methods requires more code and a deeper understanding of the system. S4 can also be slower than S3 due to the overhead of method dispatch and type checking. Also, S4's rigidity can make it less flexible for ad-hoc or exploratory programming. For instance, it's harder to dynamically add attributes to S4 objects like you can in S3.
5. Describe the use of environments in R for managing scope and data encapsulation. Provide an example.
Environments in R are data structures that hold collections of named objects (variables, functions, etc.). They are fundamental for managing scope and data encapsulation. Each environment acts like a container, defining a separate namespace. When R searches for a variable, it looks in the current environment first, and then in its parent environments (enclosing environments) if the variable isn't found locally. This is lexical scoping.
For example:
env1 <- new.env()
env1$x <- 10

env2 <- new.env(parent = env1)
env2$y <- 20

get_x <- function() {
  print(x)
}

environment(get_x) <- env2
get_x() #Output is 10
In this case, get_x is defined in env2. env2 has parent env1. when get_x tries to print x, it first looks in env2 which does not contain variable x. It then looks in the parent environment which is env1, finds the value of x, and prints it.
6. How can you use R's garbage collection to manage memory effectively in long-running applications?
R's garbage collection (GC) automatically reclaims unused memory. To manage memory effectively in long-running R applications, you can use gc() to manually trigger garbage collection at strategic points, such as after creating and discarding large objects. This can help prevent memory leaks and reduce the application's memory footprint. Also, monitoring memory usage is crucial. Tools like pryr::mem_used() or profvis help identify memory-intensive parts of the code, allowing you to optimize data structures, use more memory-efficient algorithms, and explicitly remove unnecessary large objects using rm() before the next automatic or manual GC cycle.
7. Explain how to write custom classes with reference semantics in R using `R6` and what scenarios benefit from this approach.
The R6 package in R enables the creation of classes with reference semantics, unlike R's default copy-on-modify behavior. To create an R6 class, you use R6Class("ClassName", public = list(...), private = list(...)). Methods are defined within the public list, and data fields can be defined in public or private. The key benefit is that when an object of an R6 class is modified, those changes are reflected wherever that object is referenced; no copies are made unless explicitly requested using $clone().
Scenarios that benefit from reference semantics include:
- Managing large datasets: Avoid unnecessary copying, which can save memory and time.
- Simulating mutable state: Easier representation of real-world objects that change state over time.
- Implementing design patterns: Supports patterns that rely on object identity and shared state (e.g., Singleton, Observer).
- GUI programming: Updating UI elements efficiently by directly modifying underlying data objects.
8. Describe how to use the `compiler` package to improve the performance of R code. What are its limitations?
The compiler package in R can improve performance by compiling R code into byte code. This involves translating R code into a lower-level representation that can be executed more efficiently. To use it, you can either compile individual functions using cmpfun() or enable compilation globally with enableJIT(3). Enabling JIT (Just-In-Time) compilation with level 3 compiles all top-level code.
Limitations include: The performance gains are often modest and may not be noticeable for all types of code. Compilation overhead can sometimes negate the benefits, especially for short-running functions. Some R code may not be fully compatible with the compiler, potentially leading to errors or unexpected behavior. Furthermore, the compiler primarily speeds up code execution; it does not address algorithmic inefficiencies. So, focus on code profiling and optimization first.
9. Explain how you would use `Rcpp` to integrate C++ code into an R package for performance gains. Provide a simple example.
To integrate C++ code into an R package using Rcpp for performance gains, you'd typically start by creating an src directory within your R package. Inside src, you'd place your C++ code (e.g., my_cpp_function.cpp). This C++ code would use Rcpp's data structures and functions to seamlessly interact with R objects. Specifically, you use // [[Rcpp::export]] before C++ functions you want to expose to R. After writing your C++ code, you'd need to compile it using Rcpp::compileAttributes() in your R console (usually done in the R directory or a separate script). This generates RcppExports.R and RcppExports.cpp, which handle the interface between R and C++. Finally, you can call your C++ function directly from R, benefiting from C++'s speed, particularly for computationally intensive tasks.
Here's a simple example:
In src/my_cpp_function.cpp:
#include <Rcpp.h>
using namespace Rcpp;

// [[Rcpp::export]]
NumericVector add_one(NumericVector x) {
  return x + 1;
}
Then in R:
# after Rcpp::compileAttributes()
result <- add_one(c(1, 2, 3))
print(result)
10. Describe how to create and manage R packages, including documentation and testing best practices.
Creating R packages involves several steps. First, use devtools::create_package("your_package_name") to scaffold the package structure. Place your R functions in the R/ directory. Document each function using roxygen2 comments (e.g., #' @title My Function). Generate the documentation using devtools::document(). Package management includes version control (Git is recommended) and building using R CMD build your_package_name. To install, use R CMD INSTALL your_package_name.tar.gz or devtools::install(). To publish, follow CRAN guidelines for submission.
Testing is crucial. Use the testthat package. Create a tests/testthat/ directory and write tests for your functions (e.g., test_that("My function works", { expect_equal(my_function(1), 1) })). Run tests with devtools::test(). Continuous integration services like GitHub Actions can automate testing on each commit. Good practices involve clear documentation, comprehensive tests, and adherence to CRAN policies for wider distribution. Use devtools::check() to assess your package's compliance.
11. How would you profile R code to identify performance bottlenecks, and what tools would you use?
To profile R code, I'd use tools like profvis and system.time. system.time gives a high-level overview, measuring the execution time of an entire block of code. profvis is more detailed; it helps visualize where the code spends its time, line by line. I would install it using install.packages("profvis"). To use it, I'd wrap the code I want to profile using profvis({ code_to_profile }) which then launches an interactive profile in a browser window.
To identify bottlenecks, I'd start with system.time to get a sense of overall performance. If it's slow, I'd then use profvis to pinpoint the specific lines or functions consuming the most time. I'd focus on optimizing those sections, looking for opportunities for vectorization, algorithm improvements, or more efficient data structures.
12. Explain how to use the `parallel` package (or similar) to parallelize R code execution across multiple cores.
The parallel package in R allows you to parallelize code execution across multiple cores. One common approach is using the mclapply function, which is a parallelized version of lapply. mclapply takes a list or vector, a function to apply, and the mc.cores argument to specify the number of cores to use. For Windows, parLapply is typically used in conjunction with makeCluster, clusterExport, and stopCluster to manage a cluster of R processes.
For example:
library(parallel)

# Unix-like systems:
result <- mclapply(1:10, function(x) x^2, mc.cores = 4)

# Windows:
cl <- makeCluster(4)
clusterExport(cl, varlist = ls())
result <- parLapply(cl, 1:10, function(x) x^2)
stopCluster(cl)
clusterExport is needed in Windows environment for each core to have access to the environment variables and functions in the global environment. It’s also important to note that not all code is suitable for parallelization; tasks should be independent to avoid race conditions or data corruption.
13. Describe the concept of non-standard evaluation (NSE) in R and how you can use it in custom functions.
Non-standard evaluation (NSE) in R allows functions to examine the unevaluated expressions passed as arguments, rather than just the values of those arguments. This is particularly useful when you want a function to operate on variable names themselves, or to manipulate expressions before they are evaluated.
For example, you can use substitute() to capture the expression passed to a function, and eval() to later evaluate that expression within a specific environment. Another helpful function is quote(), which prevents evaluation of an expression. Using these tools, you can write custom functions that, for instance, automatically generate plots with axis labels based on the input variables, or create dynamic queries. This can enable more concise and expressive code. dplyr uses NSE extensively.
14. How can you implement custom DSLs (Domain Specific Languages) in R to simplify complex tasks for users?
Custom DSLs in R can simplify complex tasks by providing a more intuitive and domain-specific syntax. Here's how you can implement them:
- Define the grammar: Use R's parsing capabilities (e.g.,
parse,deparse) to define the structure of your DSL. Packages likeRseccan aid in creating more complex grammars. - Create a translator: Develop functions that translate the DSL code into standard R code. This translator interprets the DSL's syntax and generates the equivalent R operations.
- Provide a user interface: Offer functions or a package that allows users to write and execute code in the DSL. This interface should handle the translation process and execute the resulting R code.
- Example: A simple DSL could be designed for statistical modeling, where users define models using a shorthand notation. The translator would then convert this notation into R's
lmorglmfunctions.
# Example: Simple DSL for adding two numbers
parse_dsl <- function(dsl_code) {
  parts <- strsplit(dsl_code, " \+")[[1]]
  num1 <- as.numeric(parts[1])
  num2 <- as.numeric(parts[2])
  return(num1 + num2)
}

# Usage
result <- parse_dsl("5 + 3") # Returns 8
print(result)
15. Explain how you would handle large datasets in R that exceed available memory. What strategies and packages would you employ?
When dealing with large datasets in R that exceed available memory, several strategies can be employed. One common approach is to use packages designed for out-of-memory data handling. For example, the data.table package is very efficient for data manipulation and supports reading large files in chunks. Additionally, the ff package allows you to store data on disk and access it as if it were in memory. Another strategy involves using database connections (e.g., DBI package with SQLite or PostgreSQL) to store and query data, bringing only the necessary subsets into R for analysis.
Specific techniques include:
- Chunk-wise processing: Read data in smaller, manageable chunks, process each chunk, and aggregate results.
- Data sampling: If appropriate, work with a representative sample of the data.
- Using
readrordata.table::fread: These functions are optimized for fast data loading. dplyrwith database connections: Perform data manipulation within the database to reduce the amount of data loaded into R.- Minimize object size: Remove unnecessary variables or convert data types to more memory-efficient formats.
16. Describe your experience with using R for developing RESTful APIs. What frameworks or packages did you use?
While my primary expertise isn't developing RESTful APIs in R for production environments, I have experience creating simple APIs for internal tools and data sharing using the plumber package. plumber's annotation-based routing and automatic Swagger documentation generation made it easy to quickly expose R functions as API endpoints. I've used it for tasks like creating an API to access pre-calculated statistical summaries or to trigger simple data processing workflows.
I've also experimented with opencpu for creating more complex, secure APIs, but my usage there was limited to proof-of-concept projects. For data handling within these APIs, I typically use packages like dplyr for data manipulation, jsonlite for JSON serialization, and httr for interacting with external APIs if needed. When I am developing, I try to adhere to secure coding practices. For example, parameter validation is important when developing such APIs.
17. How would you implement robust error handling and logging in an R application intended for production use?
For robust error handling in a production R application, I would use tryCatch() to gracefully handle expected errors, logging the error message, the call stack using traceback(), and any relevant variable states to a log file using a logging library like log4r or futile.logger. This allows for debugging and analysis of failures without crashing the application. Ensure logs include timestamps and severity levels (e.g., DEBUG, INFO, WARN, ERROR) for efficient filtering.
Additionally, implement automated monitoring and alerting based on the log messages. For instance, if a certain error occurs more than a threshold number of times within a specific timeframe, an alert could be triggered, notifying the operations team to investigate. Consider using a centralized logging system like ELK stack (Elasticsearch, Logstash, Kibana) for aggregation and analysis of logs from multiple R application instances. Always redact sensitive information from logs.
18. Explain how you would use R to perform advanced text mining tasks such as sentiment analysis or topic modeling.
To perform sentiment analysis in R, I'd use packages like tidytext and sentimentr. First, I'd tokenize the text data using unnest_tokens from tidytext. Then, I'd join the tokenized data with a sentiment lexicon (e.g., get_sentiments("bing")) to assign sentiment scores to each word. Finally, I'd aggregate these scores to determine the overall sentiment of each document. Alternatively, sentimentr provides a more robust approach, accounting for valence shifters like negations and intensifiers.
For topic modeling, I'd leverage packages like topicmodels or stm (Structural Topic Model). I'd start by creating a document-term matrix (DTM) using tidytext and cast_dtm. Then, I'd apply Latent Dirichlet Allocation (LDA) using LDA() from topicmodels, specifying the desired number of topics. The stm package offers more advanced features like incorporating document-level covariates to understand how topics vary across different groups. Post-modeling, I'd visualize the topics and their associated keywords to gain insights.
19. Describe how to write custom generic functions and methods in R to handle different data types gracefully.
To write custom generic functions in R that handle different data types gracefully, you can use the UseMethod function. This allows you to define a generic function and then create specific methods for different classes of objects. The method dispatched depends on the class of the first argument passed to the generic function. Here's a basic example:
# Generic function
mydispatch <- function(x, ...) {
  UseMethod("mydispatch")
}

# Default method
mydispatch.default <- function(x, ...) {
  print("Unknown class")
}

# Method for numeric
mydispatch.numeric <- function(x, ...) {
  print("Numeric method")
}

# Method for character
mydispatch.character <- function(x, ...) {
  print("Character method")
}
This approach allows you to handle different data types using class-specific methods, providing a clean and organized way to deal with varying input types. Using ... in the function signature allows passing of additional arguments.
20. Explain your approach to debugging complex R code, including strategies and tools you find most effective. What is your workflow?
When debugging complex R code, I usually start by trying to reproduce the error consistently. Once reproducible, I narrow down the source of the problem. I liberally use print() statements or the message() function to inspect variable values at different points in the code. For more interactive debugging, I use browser() to pause execution and step through the code line by line, examining the environment using ls() and inspecting variables. RStudio's debugging tools (breakpoints, step-by-step execution, call stack inspection) are invaluable here. Another useful tool is traceback() which helps determine the sequence of function calls leading to an error.
My workflow involves: 1. Reproducing the error. 2. Isolating the problematic section using techniques like commenting out blocks of code. 3. Using print or browser to inspect variables. 4. Leveraging RStudio's debugging tools for step-by-step analysis. 5. Examining error messages and the call stack via traceback(). I find it's crucial to simplify the code as much as possible to make debugging easier, and writing unit tests to catch errors early in development is also very helpful. For example, the following code would be helpful for testing some custom function my_func()
# Testing if my_func works as expected
if(my_func(input_x) == expected_output){
  print("Test Passed")
} else {
  print("Test Failed")
}
Expert R Language interview questions
1. How would you design an R package for time series analysis, focusing on extensibility and maintainability?
To design an R package for time series analysis with extensibility and maintainability in mind, I'd focus on a modular architecture. The core package would provide fundamental time series operations and data structures, while extensions (potentially in separate packages) would implement specialized models or algorithms. A key aspect is defining clear interfaces (S3 or S4 classes and generic functions) for model fitting, forecasting, and evaluation. This allows users to easily add new models by implementing these interfaces, without modifying the core package. For maintainability, comprehensive unit tests and documentation are essential.
Specifically, I would have functions such as fit_model(), forecast(), and evaluate() that are generic. Different models (e.g., ARIMA, Exponential Smoothing) would have their own methods for these functions. Furthermore, I'd use a consistent naming convention and a clear directory structure. The package should also include functions for common tasks like data cleaning, visualization, and diagnostic checking. A vignette will greatly improve usability. The NAMESPACE file would carefully export only user-facing functions, keeping internal functions hidden.
2. Explain the nuances of using `Rcpp` for performance optimization in R, detailing potential pitfalls.
Rcpp offers significant performance gains in R by allowing you to write performance-critical sections of your code in C++. This is beneficial as C++ code typically executes much faster than equivalent R code, especially for computationally intensive tasks involving loops, complex algorithms, or large datasets. Using Rcpp::cppFunction or creating R packages with C++ code allows seamless integration of C++ functions within R, enabling you to leverage C++'s speed without completely abandoning the R environment. However, it's crucial to manage data transfer between R and C++ efficiently to avoid overhead that negates the performance gains. Understanding R's object structure and how it maps to C++ data types is essential.
Potential pitfalls include incorrect data type mapping between R and C++, leading to unexpected behavior or errors. For example, R's vectors must be correctly accessed as Rcpp::NumericVector, Rcpp::IntegerVector, etc. in C++. Memory management becomes crucial as you're responsible for handling memory allocated within C++ code. Failing to do so can cause memory leaks. Also, the overhead of transferring data between R and C++ can be substantial, especially for small operations, so it's important to only use Rcpp for sections of code where the performance benefits outweigh the data transfer costs. Debugging can be more complex, requiring familiarity with C++ debugging tools. Finally, improper use of Rcpp may lead to code that's harder to maintain and less readable than the original R code.
3. Describe your experience with implementing distributed computing using R, highlighting the challenges and solutions.
My experience with distributed computing in R primarily involves using packages like foreach, doParallel, and future. I've implemented parallel processing for computationally intensive tasks like Monte Carlo simulations, large-scale data analysis, and model training. A common challenge is managing data dependencies and ensuring data is efficiently distributed across worker nodes. Solutions include carefully structuring code to minimize data transfer, using shared memory (when appropriate and available), and leveraging data serialization techniques (e.g., serialize, dput).
Another challenge is debugging parallel code and handling errors gracefully. I've used techniques like logging, error trapping with tryCatch, and testing on smaller datasets before scaling up. Furthermore, understanding the underlying cluster architecture (e.g., number of cores, memory limits) is crucial for optimizing performance. Tools like system.time and profilers helped to identify bottlenecks and improve code efficiency. Specifically, I have experienced cases, where foreach package was efficient to submit embarrassingly parallel problems, and when there was dependency across iterations, future package along with future.apply functions were very handy. I've often used future::plan(multisession) or future::plan(cluster, workers = N) setup based on availability of resources.
4. What are the key considerations when deploying R models to production environments, ensuring scalability and reliability?
When deploying R models to production, several factors are crucial for scalability and reliability. Firstly, containerization using Docker is essential for creating reproducible and isolated environments. This ensures consistency across different stages, from development to production. Additionally, consider model serialization using formats like PMML or RDS to save and load models efficiently. Also, it is important to leverage a robust serving infrastructure. Tools like Plumber or OpenCPU can expose R models as REST APIs.
Secondly, monitoring the model's performance in real-time is important. Establish robust monitoring and logging to track input data, predictions, and system resource utilization. Further scaling your models requires choosing the right compute environment, such as cloud platforms (AWS, Azure, GCP) or Kubernetes. Lastly, automating the deployment pipeline using CI/CD is crucial for fast and reliable deployments. This involves setting up automated testing, building, and deployment processes.
5. Explain how you would handle large datasets in R that exceed available memory, detailing specific strategies.
When working with large datasets in R that exceed available memory, several strategies can be employed. One common approach is to use data.table package which is memory-efficient and faster than base R data frames for large datasets. Operations are performed by reference, minimizing memory duplication. Another strategy involves using disk-based data storage like ff or disk.frame packages. ff creates data objects that are stored on disk but behave similarly to in-memory objects, allowing you to work with data that is larger than RAM. disk.frame chunks the data into smaller parts and stores them on disk, enabling parallel processing and out-of-memory computation.
Another technique is to process the data in chunks using functions like readr::read_lines or read.csv with the nrows and skip parameters. This allows you to read and process the data in smaller, manageable blocks. Aggregating data as you read it can also reduce memory usage. Furthermore, optimizing data types, such as using integers instead of doubles where appropriate, can significantly reduce the memory footprint. Finally, if the data is stored in a database, you can leverage database queries to perform filtering and aggregation before loading the data into R.
6. Describe the process of creating custom visualizations in R beyond standard packages, focusing on interactivity and user experience.
Creating custom visualizations in R beyond standard packages like ggplot2 often involves leveraging packages like plotly, shiny, or htmlwidgets. plotly allows you to create interactive web-based visualizations directly from R plots. You can convert existing ggplot2 plots into interactive plotly objects using ggplotly(). For more complex and custom visualizations, you can directly create plotly figures by specifying traces, layouts, and other attributes.
shiny is ideal for building interactive web applications with visualizations. You can create dashboards and applications where users can modify inputs (e.g., sliders, dropdowns) that dynamically update the plots. htmlwidgets provides a framework for using JavaScript visualization libraries (e.g., D3.js, Leaflet) within R. You can create custom JavaScript visualizations and then integrate them into R using the htmlwidgets API. This gives you almost unlimited control over the visualization, allowing for very specific user interactions and unique designs. Example using plotly:
library(plotly)
plot_ly(data = data.frame(x = 1:10, y = (1:10)^2), x = ~x, y = ~y, type = 'scatter', mode = 'lines+markers')
7. How would you approach debugging complex R code involving multiple packages and dependencies, explaining your diagnostic techniques?
When debugging complex R code with multiple packages, I start by ensuring a reproducible environment using renv or Docker. This helps isolate the issue. I then use a combination of techniques: 1. Isolate the Problem: Simplify the code by commenting out sections to pinpoint the source of the error. 2. Use Debugging Tools: Employ browser() to step through code line by line and inspect variables. Tools like debug()/undebug() can also be helpful. 3. Error Handling: Implement tryCatch() to gracefully handle errors and log informative messages. 4. Logging: Strategically add print() or message() statements to track the flow of execution and variable values. 5. Profiling: Use profvis or Rprof() to identify performance bottlenecks and unexpected function calls. 6. Package Versions: Check for compatibility issues between package versions; consider downgrading packages if necessary. 7. Read Error Messages Carefully: Often, error messages provide clues about the nature and location of the problem. 8. Reproducible Example: Construct a minimal reproducible example (reprex) to share with others or post on Stack Overflow.
To handle dependencies, I'd inspect the package's namespace using ls(package:packageName) to understand available functions and variables. For external dependencies, I'd ensure those are installed correctly and are accessible to the R environment. Understanding the data flow, especially when complex transformations and package interactions occur, is critical. I document my assumptions throughout the debugging process, as this aids in tracking down errors effectively.
8. Explain how to use metaprogramming techniques in R to create flexible and reusable code, providing a practical example.
Metaprogramming in R allows you to write code that manipulates code itself. This enables creating flexible and reusable functions by parameterizing code generation or execution. One common technique is using substitute() and eval() to modify and evaluate expressions. substitute() captures the expression without evaluation, letting you modify it, while eval() executes the modified expression in a specified environment.
Here's a practical example. Suppose you want a function that generates different linear regression models based on a formula specified as a string:
create_model <- function(formula_string, data) {
  formula <- as.formula(formula_string)
  model <- lm(formula, data = data)
  return(model)
}

data <- data.frame(y = 1:10, x1 = (1:10)^2, x2 = rnorm(10))

# Create a model with y ~ x1
model1 <- create_model("y ~ x1", data)

# Create a model with y ~ x1 + x2
model2 <- create_model("y ~ x1 + x2", data)

summary(model1)
summary(model2)
In this example, create_model takes a formula as a string, converts it to an R formula using as.formula(), and then uses this formula within lm() to generate the linear model. This metaprogramming approach provides flexibility in defining models dynamically without rewriting the core lm call.
9. Discuss the trade-offs between different R frameworks for web application development, considering performance and maintainability.
When selecting an R framework for web application development, trade-offs exist between performance and maintainability. Shiny is known for its rapid development and ease of use, making it highly maintainable, especially for smaller applications. However, its reactive nature can sometimes lead to performance bottlenecks with larger datasets or complex calculations, potentially requiring optimization through techniques like debouncing, caching, or moving computations to a backend. Plumber, on the other hand, allows you to create REST APIs, offering better performance for computationally intensive tasks because it can leverage other languages and frameworks, but may require more development effort and can be less maintainable for those primarily familiar with R syntax.
Alternatives such as golem provide a structured approach to building robust and scalable Shiny applications, improving maintainability by enforcing a modular architecture and testing practices. However, the initial setup and adherence to the golem framework add complexity. Ultimately, the best choice depends on the specific project requirements, team expertise, and the balance needed between development speed, application performance, and long-term maintainability.
10. How would you design a system for automated model retraining and deployment in R, ensuring continuous improvement?
To design an automated model retraining and deployment system in R for continuous improvement, I would leverage several key components. First, a robust data pipeline for feature engineering and data validation is crucial. This pipeline would include scheduled data extraction, transformation, and loading (ETL) processes, with automated data quality checks. Model training should be triggered automatically based on predefined schedules (e.g., weekly, monthly) or when significant data drift is detected. The training process itself should involve hyperparameter tuning (e.g., using caret or mlr3 packages) and model evaluation using appropriate metrics on a hold-out validation set.
Successful models would be deployed to a serving environment. The deployment would involve version control (using Git) and containerization (using Docker) to ensure reproducibility. I would implement A/B testing and monitoring to compare the performance of the new model against the existing one. If the new model outperforms the current model based on predefined criteria, it would be automatically promoted to production. To handle retraining failure or suboptimal model deployment, alerts must be raised. Code example: plumber can be used for deployment. cron or taskscheduleR packages can be used for automated triggering of the model pipeline.
11. What are the best practices for securing R applications and data, preventing unauthorized access and manipulation?
Securing R applications and data involves several key practices. Limit data access using appropriate file permissions, database authentication, and access control lists. Sensitive data should be encrypted both in transit (HTTPS) and at rest. Code reviews and static analysis can help identify vulnerabilities, and regular security audits are crucial. Avoid storing sensitive credentials directly in the code; use environment variables or secure configuration files.
Specific R-related practices include using secure packages from trusted sources like CRAN. Be wary of installing packages from unknown or untrusted repositories. Sanitize user inputs to prevent code injection vulnerabilities, especially when building Shiny applications or APIs. Implement robust authentication and authorization mechanisms for web-based R applications. Utilize tools like lintr and styler to enforce code consistency and reduce the risk of errors. Regularly update R and its packages to patch security vulnerabilities.
12. Describe your experience with implementing machine learning algorithms from scratch in R, detailing the challenges and benefits.
I've implemented several machine learning algorithms from scratch in R, including linear regression, logistic regression, and k-means clustering. The primary challenge was ensuring numerical stability, especially during matrix inversions and gradient descent. Debugging also proved difficult, as I had to meticulously check each step of the algorithm against known outputs or simpler implementations.
However, the benefits were substantial. It provided a deep understanding of the underlying mathematics and assumptions of each algorithm. Specifically, I gained detailed insight into:
- Gradient descent and its variants (e.g., stochastic gradient descent).
- Regularization techniques (L1, L2).
- The impact of different initialization methods. This hands-on experience allowed me to better diagnose model performance issues and select appropriate algorithms and parameter settings for different datasets. I used R's debugging tools and the
optim()function, and ensured the algorithm outputs matched standard library implementations using test cases to validate my results. For example, in implementing gradient descent, I often utilized a simple test case such asy = 2*x + 1to quickly check if the coefficients were being updated correctly.
13. How would you approach building a custom R package for a specialized statistical analysis technique, ensuring correctness and usability?
I'd start by clearly defining the scope and purpose of the package, outlining the specific statistical technique it implements and its intended users. I would then structure the package with well-defined functions, each performing a specific task within the analysis. Rigorous testing is crucial, so I'd write unit tests using the testthat package to verify the correctness of each function and integration tests to ensure the entire workflow functions as expected. I would also generate good error/warning messages to help users diagnose common problems.
For usability, I would create detailed documentation using roxygen2 to explain each function's purpose, arguments, and return values, including examples. Also, I would create vignettes that demonstrate typical use cases and workflows, allowing users to quickly understand how to apply the technique. I would also consider providing sample datasets. Finally, I'd adhere to CRAN's package development guidelines for consistency and ease of distribution. Version control (e.g., using Git) is essential to track changes and facilitate collaboration.
14. Explain how to integrate R with other programming languages and systems, such as Python or databases, detailing potential challenges.
R integrates with other languages and systems through various packages and techniques. For Python, the reticulate package is commonly used, allowing you to call Python code from R and share data between the two environments. Databases can be accessed using packages like DBI and specific drivers (e.g., RMySQL, RPostgres) to execute SQL queries and retrieve data into R data frames. Other methods include using system commands to execute scripts in other languages or utilizing APIs to interact with external systems.
Challenges include data type conversions between languages (e.g., R's data frames vs. Python's pandas DataFrames), managing dependencies and environments (e.g., ensuring Python libraries are available), and handling potential performance bottlenecks when transferring large datasets. Also, debugging across different languages can be tricky. Coordinating these integrations requires careful planning and attention to detail to ensure smooth and reliable operation. Using virtualization (e.g. Docker) can address environment issues.
15. Describe your experience with contributing to open-source R projects, highlighting the challenges and rewards.
My experience with contributing to open-source R projects has been primarily focused on packages related to data analysis and visualization. I've contributed to projects like dplyr by submitting bug reports with reproducible examples and suggesting improvements to the documentation. I also contributed to ggplot2 by submitting a pull request to improve error messages and add a feature for handling missing data in specific plot types.
The challenges I faced included understanding the codebase, adhering to the project's coding style, and addressing reviewer feedback. A reward was seeing my contributions being used by others and knowing that I made a positive impact on the R community. For example, debugging involved using tools like debug() and traceback() to understand function calls, and using devtools::test() to ensure tests didn't break existing functionality after making changes. Also, effective communication with maintainers and other contributors was key.
16. How would you optimize R code for execution on different hardware architectures, such as GPUs or specialized processors?
Optimizing R code for different hardware architectures often involves leveraging parallel computing capabilities. For GPUs, the gpuR and torch packages enable offloading computations to the GPU. These packages allow you to represent data as GPU-backed matrices and tensors, and perform operations using GPU-accelerated functions. For specialized processors, consider using packages that are specifically designed for that hardware, or libraries that offer vectorized operations which can be optimized by the underlying hardware. For example, using optimized BLAS (Basic Linear Algebra Subprograms) libraries can significantly speed up matrix operations.
Furthermore, tools like Rcpp can be used to integrate C++ code into R, allowing you to write performance-critical sections of your code in a lower-level language and then offload specific tasks to optimized hardware using libraries like CUDA (for NVIDIA GPUs) or OpenCL (for cross-platform parallel processing). Other strategies involve using packages like compiler to compile R code into more efficient machine code. Always profile the code to identify bottlenecks before attempting optimization.
17. Explain how to use R for reproducible research, ensuring that results can be independently verified and replicated.
Reproducible research in R focuses on ensuring that your analysis can be independently verified and replicated. Key tools and practices include: 1. Using R Projects: Organize your work into projects to manage dependencies and file paths. 2. Version Control (Git): Track changes to your code and data using Git for reproducibility and collaboration. 3. Dependency Management (renv or packrat): Ensure that the correct versions of R packages are used by creating a project-specific library using renv::init() or packrat::init(). Restore your project environment with renv::restore() or packrat::restore(). 4. Literate Programming (R Markdown or Quarto): Combine code, narrative, and output in a single document using R Markdown or Quarto. This allows you to execute code chunks and embed results directly into your report.
Example R Markdown code chunk:
# Load necessary libraries
library(ggplot2)

# Create a plot
ggplot(data = iris, aes(x = Sepal.Length, y = Sepal.Width)) +
  geom_point()
- Documenting Your Code: Use comments to explain your code and the rationale behind your analysis. 6. Data Management: Use clear naming conventions and document any data cleaning or transformation steps. Consider storing raw data separately from processed data. 7. Using Seeds: Setting a seed ensures that random processes yield the same results every time.
set.seed(123)before any random sampling. Following these practices ensures that your R analysis is transparent, verifiable, and reproducible by others.
18. Describe your experience with using R for causal inference, detailing the assumptions and limitations of different methods.
My experience with R for causal inference includes using packages like CausalImpact, MatchIt, and rdd. I've applied these to analyze the impact of interventions, estimate treatment effects, and assess policy changes. For instance, with CausalImpact, I've analyzed time series data to estimate the causal effect of an intervention, understanding it assumes the control group is a valid counterfactual. A limitation is its sensitivity to the pre-intervention period and model specification.
With MatchIt, I've implemented propensity score matching to balance covariates between treatment and control groups, which reduces confounding bias. Assumptions here include conditional independence (all confounders are observed) and common support (overlap in covariate distributions). Regression discontinuity designs (RDDs), implemented with packages like rdd, are used when treatment assignment is based on a threshold. The key assumption is that any discontinuity in the outcome at the threshold is due to the treatment. A primary limitation of RDD is ensuring the threshold is exogenous, and that individuals cannot precisely manipulate their position relative to the threshold. Furthermore, RDD only estimates the local average treatment effect at the threshold, and its results might not generalize to the entire population.
19. How would you approach building a custom R package for data manipulation, focusing on speed and efficiency?
To build a fast and efficient R package for data manipulation, I would prioritize using data.table due to its optimized data structures and algorithms for aggregation, filtering, and joining. I would also use Rcpp to write performance-critical functions in C++ and seamlessly integrate them into the R package. This allows leveraging C++'s speed for computationally intensive tasks. Furthermore, I would use benchmarking to identify bottlenecks and optimize code accordingly. Finally, I'd ensure thorough testing to guarantee correctness and stability.
20. Explain how to use R for text mining and natural language processing, detailing the steps involved in cleaning, analyzing, and visualizing text data.
R provides a rich ecosystem for text mining and NLP. The process typically involves: 1. Data Acquisition: Load text data from files, databases, or web APIs. 2. Cleaning: This step prepares the data for analysis. Common cleaning tasks include removing punctuation, converting text to lowercase, removing stop words (e.g., "the", "a", "is"), stemming or lemmatization to reduce words to their root form, and removing numbers or special characters. Packages like tm and quanteda are helpful. For example, using tm:
library(tm)
corpus <- Corpus(VectorSource(text_data))
corpus <- tm_map(corpus, content_transformer(tolower))
corpus <- tm_map(corpus, removePunctuation)
corpus <- tm_map(corpus, removeWords, stopwords("english"))
corpus <- tm_map(corpus, stemDocument)
- Analysis: After cleaning, you can analyze the text. Common analyses include term frequency-inverse document frequency (tf-idf) calculation, sentiment analysis, topic modeling (using Latent Dirichlet Allocation or LDA), and network analysis of word co-occurrences. The
quantedaandtopicmodelspackages are frequently used. 4. Visualization: Visualize the results to gain insights. Word clouds (usingwordcloud), frequency plots, network graphs (usingigraph), and sentiment scores over time can be useful. Libraries likeggplot2andwordcloudsupport visualization. For example:
library(wordcloud)
wordcloud(words = names(term_frequencies), freq = term_frequencies, min.freq = 10, colors=brewer.pal(8, "Dark2"))
21. How do you handle name collisions in R packages and what strategies do you use to avoid them?
Name collisions in R packages occur when different packages define functions or objects with the same name. R uses a search path to resolve names, and the package loaded last typically wins. To handle this, I use several strategies. First, I explicitly specify the package when calling a function using the package::function() syntax (e.g., dplyr::filter()). This avoids ambiguity and ensures that the correct function is used.
Second, if I anticipate frequent use of a function from a specific package that might collide with others, I might attach the package using library(package) but be mindful of potential masking. Alternatively, when dealing with smaller snippets or for testing purposes, the conflicts() function can be useful to identify clashing names. Lastly, when developing my own packages, I carefully choose function names that are unlikely to conflict with commonly used packages and consider using prefixes for my functions.
22. When is it appropriate to use S3 vs S4 object oriented programming in R and why?
S3 is appropriate for simple, lightweight object oriented programming where you primarily need to dispatch on the first argument's class. It's easy to implement; you just define functions with names like generic.class. S3 doesn't have formal class definitions; the class is essentially an attribute attached to an object. Because of its simplicity, it is pervasive in R.
S4 is better suited for more complex, formal object oriented programming. It offers formal class definitions (using setClass), multiple dispatch (dispatching on the class of multiple arguments), inheritance, and stricter type checking. S4's formal structure makes it more robust and suitable for larger projects and when type safety is important. However, this added complexity comes at the cost of being more verbose and having a steeper learning curve. For example, you need to use @ to access slots in objects: object@slot_name rather than object$slot_name as in S3. Use S4 for bigger projects needing the power and structure that S3 can't provide.
23. How would you construct a complex simulation study in R, covering design, execution, and analysis of results?
To construct a complex simulation study in R, I'd start by defining the simulation design. This involves specifying the factors to vary (e.g., sample size, effect size), the number of replications per condition, and the response variable(s) to measure. I'd use expand.grid() to create a data frame representing all combinations of factor levels. Next, for execution, I'd write a function that simulates data according to the specified parameters and calculates the response variable(s). This function would be called repeatedly within a loop, iterating over each row of the design data frame. The replicate() function can streamline this. The results would be stored in a data frame or list.
For analysis, I'd use statistical models (e.g., linear regression, ANOVA) to examine the relationships between the factors and the response variables. Visualization with ggplot2 would help to understand the patterns in the simulation results. Specifically, code like lm(response ~ factor1 * factor2, data = results) could be used to model the relationships and ggplot(results, aes(x = factor1, y = response, color = factor2)) + geom_boxplot() used for visualizing. Confidence intervals and power calculations could also be performed to assess the reliability of the simulation results.
24. Explain the differences between lazy evaluation and eager evaluation in R, and how they impact performance and memory usage.
Lazy evaluation (or non-strict evaluation) in R means that expressions are not evaluated until their results are needed. Eager evaluation (or strict evaluation), on the other hand, evaluates expressions immediately when they are encountered. In R, functions arguments are generally evaluated lazily. For instance, a function argument that is never used inside the function will never be evaluated. This can save computation time, especially if the expression is complex or computationally intensive. It also avoids errors if the argument contains undefined variables or operations that would cause an error.
Lazy evaluation can impact memory usage because unevaluated expressions are stored as promises, which consume memory. However, it can also lead to reduced memory usage if some expressions are never evaluated. Eager evaluation tends to use more memory upfront, as all expressions are evaluated and stored immediately. Performance-wise, lazy evaluation can be faster if it avoids unnecessary computations. However, the overhead of managing promises can sometimes make it slower than eager evaluation if the expressions are eventually evaluated anyway. Understanding these differences is key to writing efficient R code, especially when dealing with large datasets or complex computations. force() function in R can be used to force the evaluation of a lazy evaluated expression.
25. Describe your approach to version controlling R projects and collaborating with other developers using Git and GitHub.
For version controlling R projects, I use Git for local version control and GitHub for remote collaboration and backup. My workflow typically involves initializing a Git repository in the project directory using git init. I then create a .gitignore file to exclude unnecessary files like .Rhistory, .RData, and any files in the /output/ folder. I commit changes regularly with descriptive messages (git commit -m "Descriptive message").
To collaborate, I create a repository on GitHub and push my local repository to it (git remote add origin <repository_url>, then git push -u origin main). When collaborating, I use branching for new features or bug fixes (git checkout -b feature/new-feature). After completing the work on a branch, I create a pull request for review. After the review has passed, I merge the pull request into the main branch. I regularly pull changes from the remote repository to keep my local repository up-to-date (git pull origin main). I use git status, git diff, and git log frequently to track changes and understand the project history.
R Language MCQ
Question 1.
Given the following R list:
my_list <- list(name = "Alice", age = 30, city = "New York")
Which of the following commands will correctly extract the city from the list?
Options:
Question 2.
Given the vector my_vector <- c(1, 2, 3, 4, 5, 6), which of the following R code snippets will correctly calculate the mean of the elements at indices 2, 4, and 6?
Options:
Question 3.
What is the median of the following numeric vector in R: vec <- c(12, 5, 9, 21, 15)?
Options:
Question 4.
Consider a data frame df with columns 'ID', 'Name', and 'Score'. Which of the following commands will correctly select the 'Name' column?
Options:
Question 5.
What is the approximate standard deviation of a sample of 1000 values drawn from a standard normal distribution (mean = 0, standard deviation = 1) using the rnorm() function in R?
Options:
Options:
Question 6.
You have a data frame called sales_data with columns quantity and price. You want to add a new column named total_cost to sales_data. total_cost should be calculated as quantity * price only when quantity is greater than 10, otherwise it should be set to 0. Which of the following R code snippets correctly achieves this?
Options:
Question 7.
Given a numeric vector x <- c(1, 2, NA, 4, NA, 6), what will be the output of sum(x, na.rm = TRUE)?
Options:
Question 8.
What is the correlation coefficient between the vectors x <- c(1, 2, 3, 4, 5) and y <- c(2, 4, 1, 3, 5) in R?
Options:
Question 9.
You have a data frame df with columns 'age' (numeric), 'city' (character), and 'score' (numeric). Which of the following R code snippets correctly filters the data frame to select rows where the 'age' is greater than 30 AND the 'city' is either 'New York' or 'Los Angeles' AND the score is greater than 75?
Options:
Question 10.
Consider the vector my_vector <- c('a', 'b', 'a', 'c', 'b', 'b'). Which of the following R code snippets will correctly determine the unique values in my_vector and the number of times each unique value appears?
Options:
Question 11.
Consider the following R list:
my_list <- list(name = "Alice", age = 30, grades = c(85, 92, 78))
Which of the following options correctly accesses Alice's age?
Options:
Question 12.
What is the correct R code to calculate the variance of a numeric vector named my_vector?
Options:
Question 13.
What is the correct way to calculate the 25th and 75th percentiles (quartiles) of a numeric vector x in R?
Options:
Question 14.
You have an R data frame named df. Which function correctly identifies the data type of the column named 'age'?
Options:
Options:
Question 15.
What is the correct way to calculate the sum of squares for a numeric vector x in R?
Options:
Question 16.
What is the correct way to calculate the interquartile range (IQR) of a numeric vector x in R?
Options:
Question 17.
Which of the following methods is most appropriate to check if a specific element exists within a vector in R?
options:
Options:
Question 18.
What is the Euclidean distance between the points (1, 2, 3) and (4, 5, 6) in R?
options:
Options:
Question 19.
What is the correct way to calculate the range (difference between the maximum and minimum values) of a numeric vector x in R?
Options:
Options:
Question 20.
What is the correct way to calculate the mode (most frequent value) of a numeric vector x in R?
Options:
Options:
Question 21.
You have a data frame named df with columns age (numeric) and city (character). Which of the following R code snippets correctly calculates the number of people who are older than 30 and live in 'New York'?
Options:
Question 22.
Which of the following R code snippets correctly calculates the harmonic mean of a numeric vector x containing only positive values?
Options:
Options:
Question 23.
Which of the following R code snippets correctly calculates the geometric mean of a numeric vector x containing only positive values?
Options:
Question 24.
What is the correct way to calculate the covariance between two numeric vectors, x and y, in R?
Options:
Question 25.
You have an R data frame named df with numeric columns. You want to calculate the mean of each column and store the results in a numeric vector. Which of the following code snippets is the most efficient and correct way to achieve this?
options:
Options:
Which R Language skills should you evaluate during the interview phase?
It's impossible to gauge every aspect of a candidate's R Language capabilities in a single interview. However, focusing on core skills can provide valuable insights. Evaluating these key areas will help you determine if a candidate possesses the necessary expertise for the role.
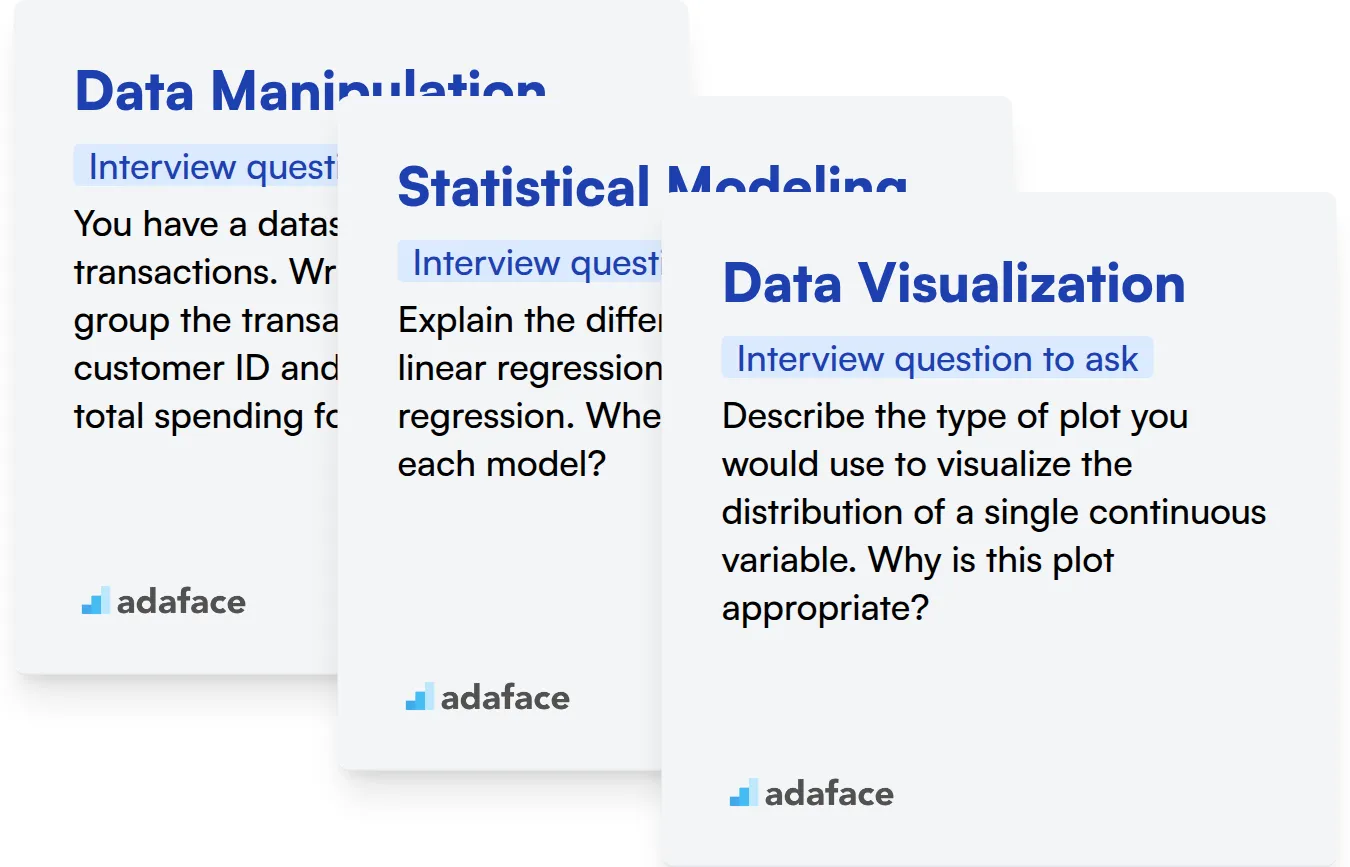
Data Manipulation
An assessment test that includes relevant MCQs can help you quickly filter candidates with strong data manipulation skills. Adaface's R online test includes questions on data manipulation with dplyr and data.table packages.
To assess their data manipulation abilities, ask them a targeted interview question. This helps you understand their approach to solving practical data challenges.
You have a dataset of customer transactions. Write R code to group the transactions by customer ID and calculate the total spending for each customer.
Look for candidates who can use functions like group_by() and summarize() from the dplyr package. Bonus points if they consider edge cases like missing data or invalid transaction amounts.
Statistical Modeling
To effectively assess statistical modeling knowledge, use an assessment test that covers relevant MCQs. You can use Adaface's Data Science test to test this skill.
Ask them targeted questions about statistical modeling to gauge their understanding. This will reveal their thought process and ability to apply statistical concepts.
Explain the difference between linear regression and logistic regression. When would you use each model?
Look for candidates who understand the use cases for each model, including the type of dependent variable they are designed for. They should also be able to explain the assumptions underlying each model.
Data Visualization
Use MCQs to assess their knowledge of visualization best practices and libraries. Adaface's Power BI online test contains relevant MCQs that filter for candidates with strong data visualization skills. (Even though it says Power BI, visualization skills are transferrable.)
To assess their data visualization abilities, ask them a question that requires them to describe a visualization. This reveals their understanding of visual communication principles.
Describe the type of plot you would use to visualize the distribution of a single continuous variable. Why is this plot appropriate?
Look for candidates who suggest a histogram or density plot and can explain why these plots are appropriate for visualizing distributions. They should also be able to discuss the importance of labels and clear axes.
Tips for Using R Language Interview Questions
Now that you have a solid collection of R language interview questions, it's time to put them to good use. Here are a few tips from our experience to help you conduct more effective interviews and identify the best candidates.
1. Leverage Skills Assessments for Objective Evaluation
Before diving into interviews, use skills assessments to objectively evaluate candidates. This will help you quickly filter candidates based on their actual skills and abilities, rather than relying solely on resumes or initial impressions.
For R language proficiency, consider using an R Online Test. To evaluate related skills, you may find our Data Science Test or Data Analysis Test beneficial.
Skills assessments provide a standardized way to compare candidates and identify those who meet the minimum requirements for the role. Use the scores to decide who to focus on during the interview phase, optimizing your time and resources.
2. Compile Relevant and Targeted Interview Questions
Time is a valuable resource during interviews, so select your questions carefully. Focus on questions that assess the most important aspects of the role and the candidate's understanding of key R concepts.
Consider what specific skills and knowledge are needed for the role and tailor your questions accordingly. By focusing on the most relevant skills, you can maximise the usefulness of the interview and better gauge the candidate's fit.
Beyond R-specific questions, consider incorporating behavioural questions or questions related to data analysis or even communication skills. These can provide valuable insights into a candidate's problem-solving abilities and how well they work in a team.
3. Ask Follow-Up Questions to Gauge Candidate Depth
Don't just rely on the initial answer a candidate provides. Asking relevant follow-up questions is key to understanding their true depth of knowledge and identifying any potential gaps.
Follow-up questions can reveal whether a candidate truly understands the underlying concepts or is simply reciting memorized information. For example, if a candidate explains how to perform linear regression in R, ask them about assumptions of linear regression and how to validate the assumptions.
By asking follow-up questions, you can ensure you're selecting candidates who not only know the theory but can also apply it effectively in real-world scenarios.
Hire Data Scientists with Confidence Using R Interview Questions and Skills Assessments
Hiring data scientists with strong R skills requires verifying their abilities accurately. The most effective way to assess their R proficiency is through skills-based assessments. Consider using Adaface's R Online Test or the broader Data Science Test to evaluate candidates' practical skills.
Once you've identified top candidates through skills tests, streamline your hiring process by shortlisting those with the highest scores for interviews. Sign up for the Adaface assessment platform to get started and hire the best R talent.
R Online Test
40 mins | 8 MCQs and 1 Coding Question
The R Online Test uses scenario-based MCQs to evaluate candidates on their knowledge of R programming language, including their proficiency in working with data structures, control structures, functions, and data visualization using R libraries like ggplot2. The test includes a coding question to evaluate hands-on R programming skills and aims to evaluate a candidate's ability to work with R effectively for data analysis and statistical modeling.
Try R Online Test
Download R Language interview questions template in multiple formats
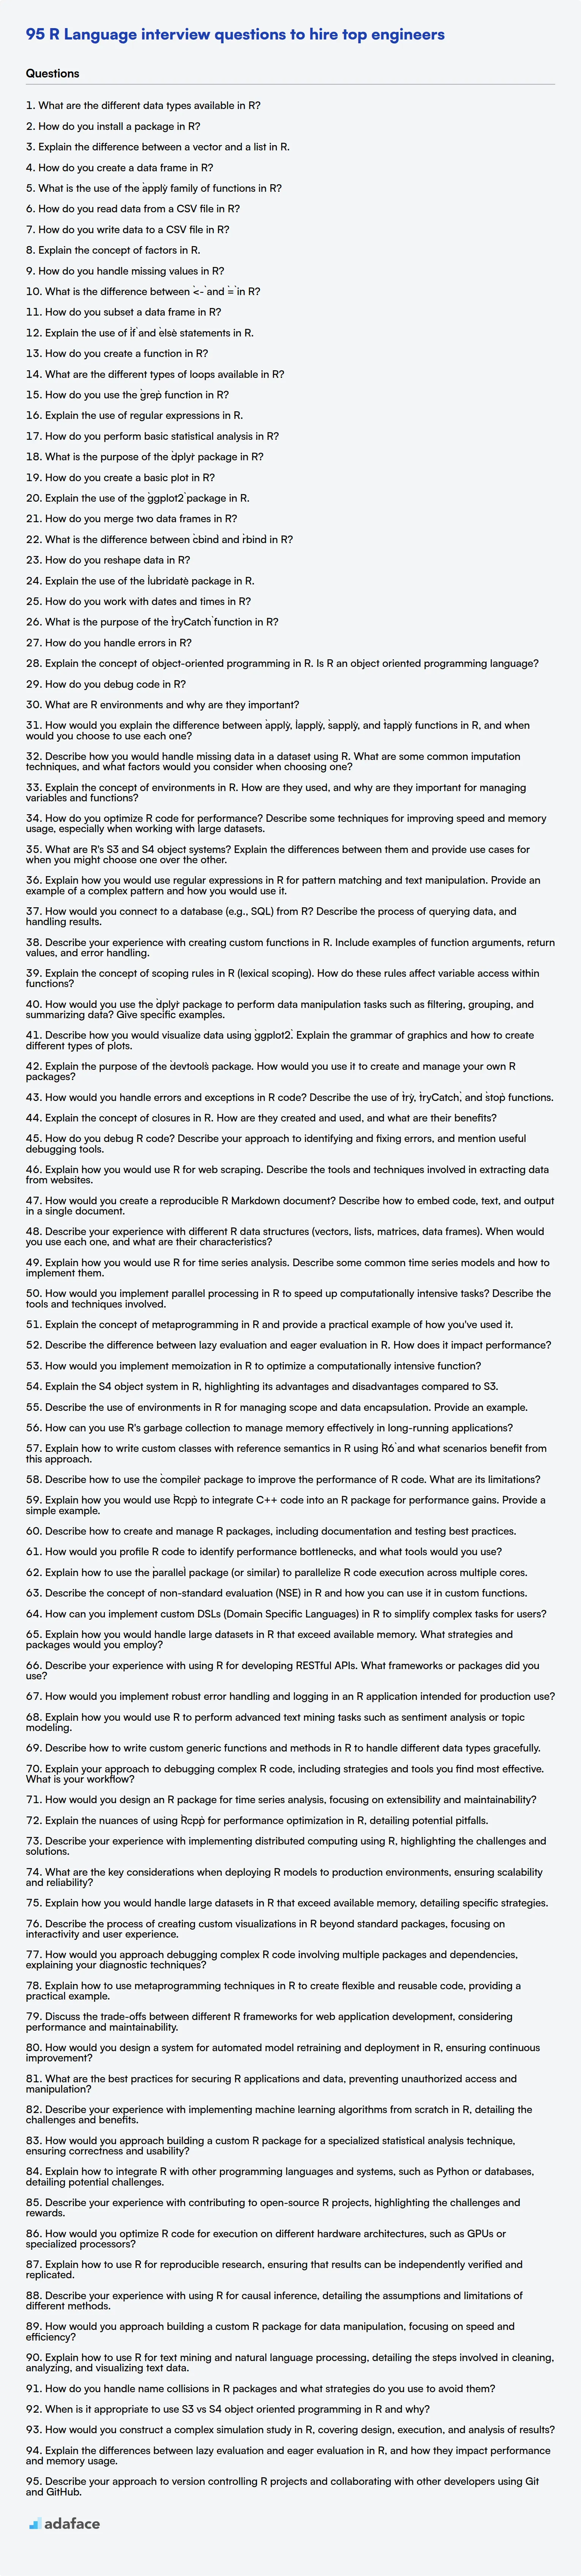
R Language Interview Questions FAQs
What are some basic R interview questions?
Basic R interview questions often cover data types, control structures, and basic functions. Expect questions on vectors, lists, data frames, and how to perform simple data manipulation tasks.
What are some intermediate R interview questions?
Intermediate R interview questions usually cover topics like data manipulation with dplyr, data visualization with ggplot2, and basic statistical modeling. You might be asked about handling missing data or working with different file formats.
What are some advanced R interview questions?
Advanced R interview questions can involve writing custom functions, working with R's object-oriented programming features, and performance optimization. Be prepared to discuss topics like S3 and S4 classes, parallel processing, and debugging techniques.
What are some expert R interview questions?
Expert R interview questions might test your knowledge of R internals, package development, and interfacing with other languages. Expect questions about topics like Rcpp, R's memory management, and designing scalable R applications.
What are some tips for using R interview questions?
When using R interview questions, focus on understanding the candidate's problem-solving approach and their ability to explain their code. It's helpful to have candidates write code snippets to assess their practical skills.
How can R interview questions help me hire better data scientists?
R interview questions help you assess a candidate's technical skills and understanding of statistical concepts. By asking the right questions, you can identify candidates who can use R effectively to solve real-world data science problems.
40 min skill tests.
No trick questions.
Accurate shortlisting.
We make it easy for you to find the best candidates in your pipeline with a 40 min skills test.
Try for freeRelated posts
Free resources

Join 1200+ companies in 80+ countries.
Try the most candidate friendly skills assessment tool today.

40 min tests.
No trick questions.
Accurate shortlisting.
No trick questions.
Accurate shortlisting.