In the competitive field of data science, hiring managers need to ask the right R Language interview questions to effectively assess a candidate's skills. Crafting these questions can be challenging, especially when aiming to identify top talent efficiently without wasting time.
This blog post provides a comprehensive list of R Language interview questions tailored for different skill levels, from junior data scientists to those with advanced statistical knowledge. It covers various aspects such as general questions, data manipulation, and statistical methods to give a thorough evaluation of an applicant’s capabilities.
By using this guide, you can streamline your interview process and confidently identify the most qualified candidates. For a more structured initial screening, consider utilizing our R online test to pre-assess candidates before interviews.
Table of contents
8 general R Language interview questions and answers to assess applicants

These general R Language interview questions are designed to help you assess the candidates' understanding and practical knowledge of R. Use them during your interview process to identify applicants who can effectively utilize R for data analysis and statistical computing.
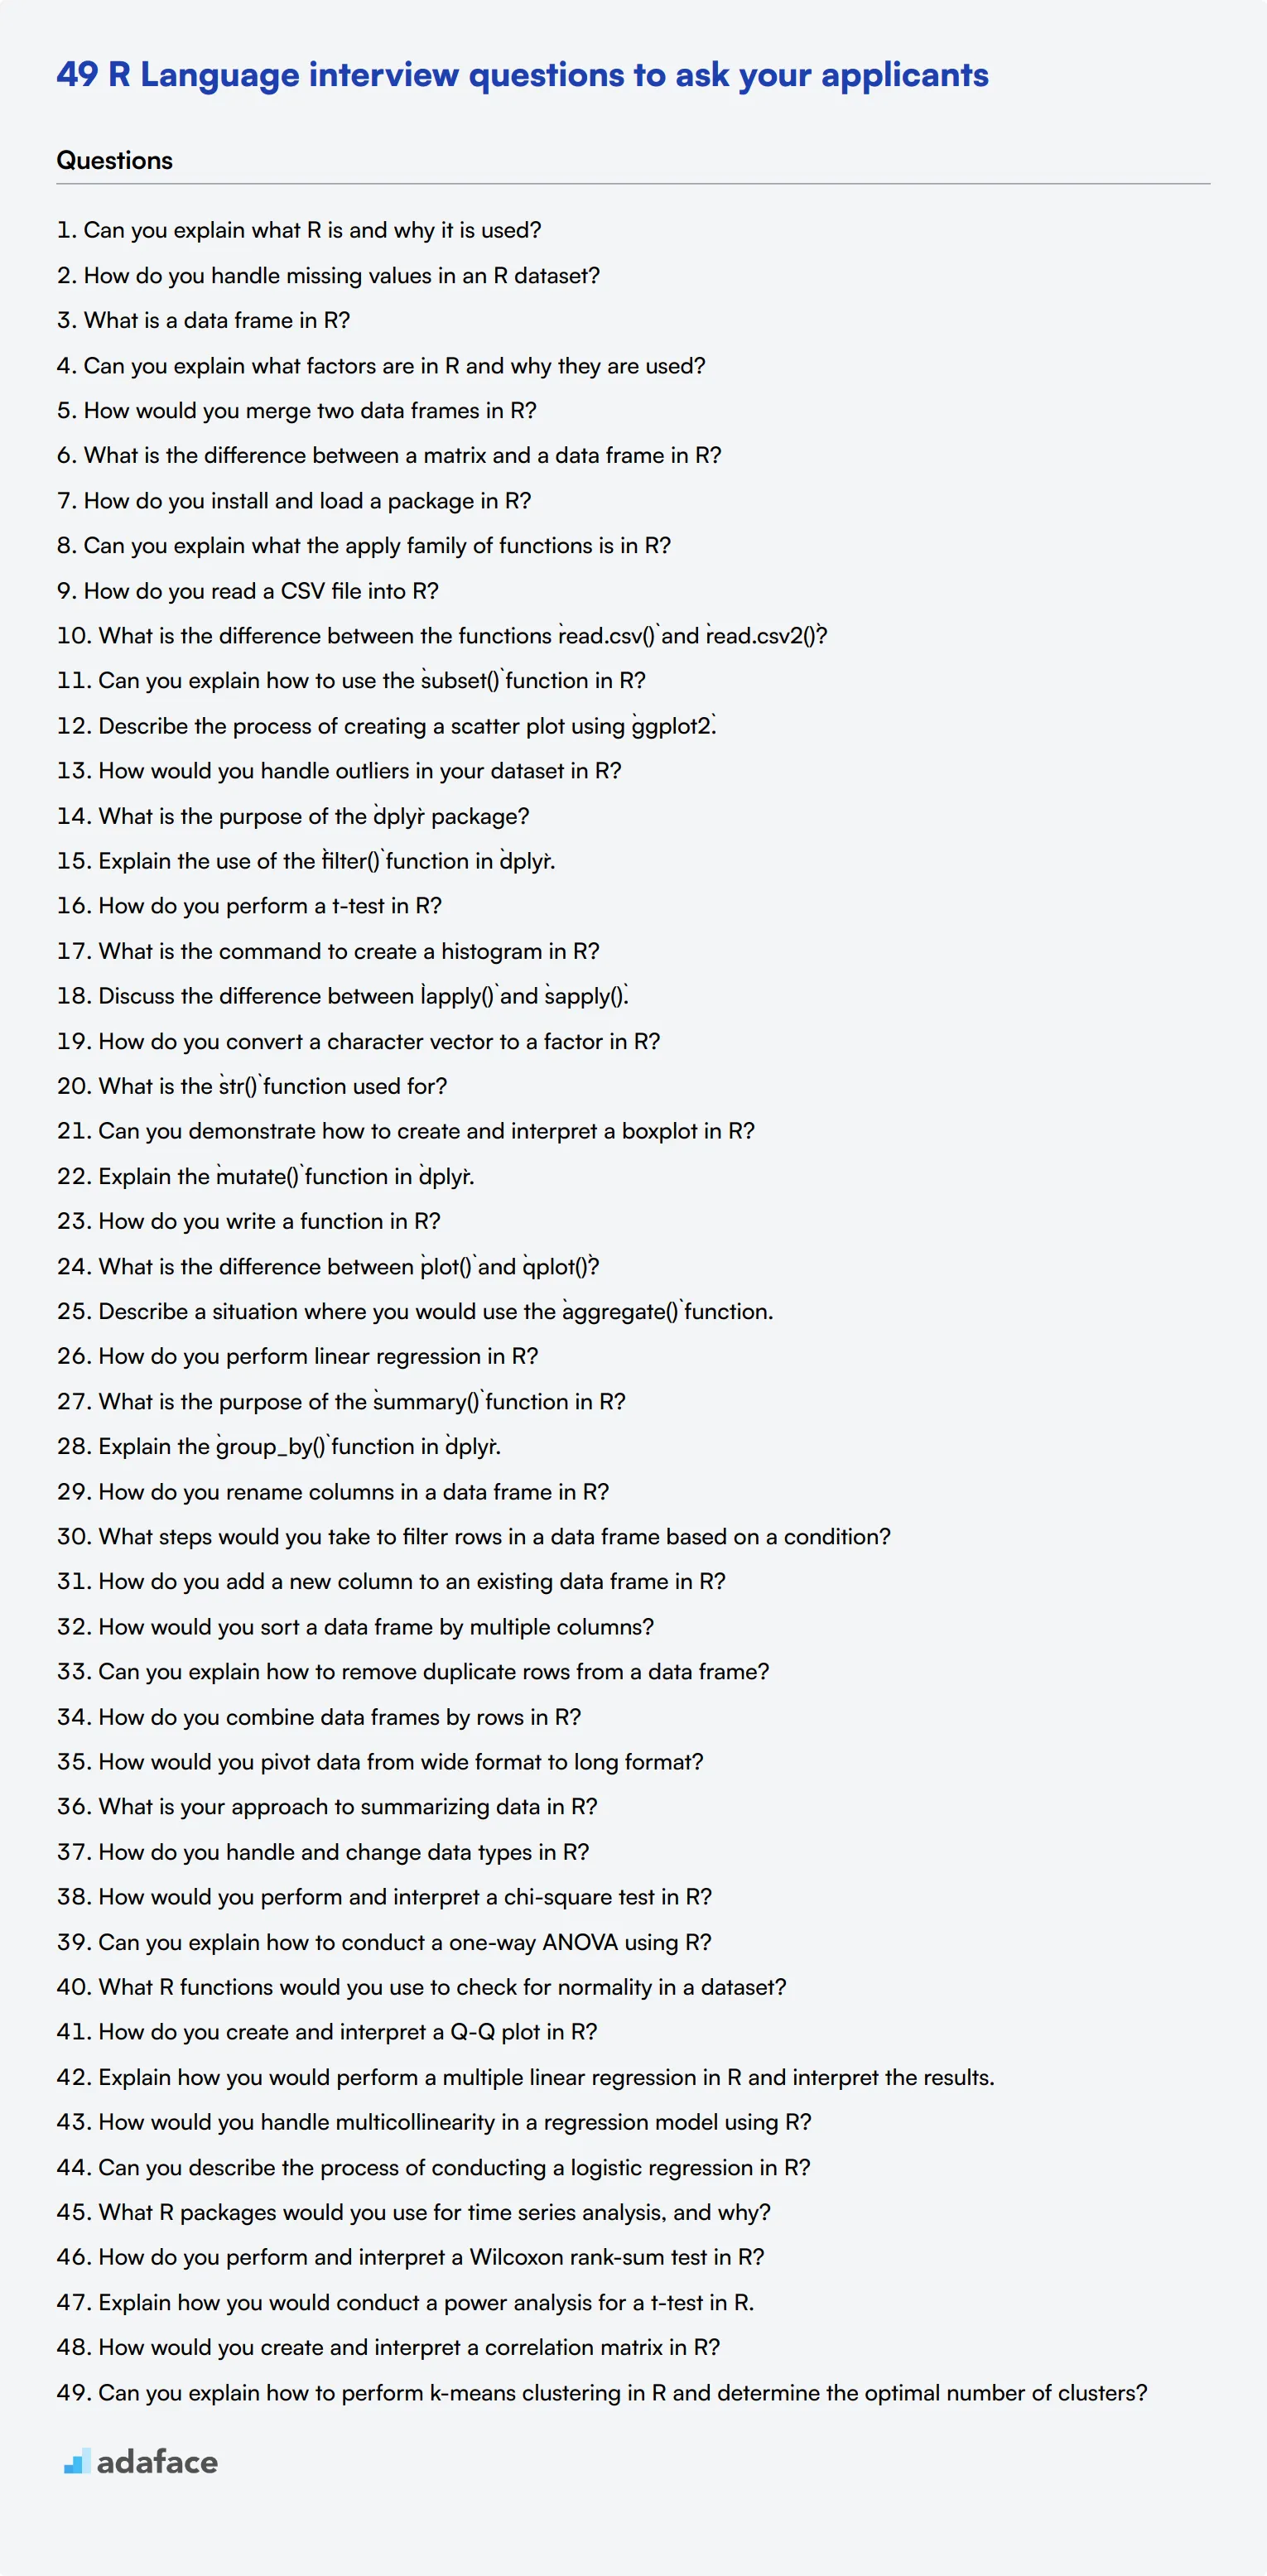
1. Can you explain what R is and why it is used?
R is a programming language and software environment used for statistical computing and graphics. It is widely used among statisticians and data miners for developing statistical software and data analysis.
Candidates should mention that R provides a wide variety of statistical and graphical techniques, including linear and nonlinear modeling, classical statistical tests, time-series analysis, classification, clustering, and others. Its ease of use and strong graphical capabilities make it a preferred choice for data analysis.
2. How do you handle missing values in an R dataset?
Handling missing values is crucial for accurate data analysis. In R, missing values are usually represented by NA. Candidates might mention methods such as removing rows with missing values, replacing them with a central tendency measure (mean, median), or using imputation techniques.
Look for candidates who can explain the implications of each method and choose the best approach based on the context of the data and the analysis goals. They should demonstrate an understanding of how missing values can affect the results and how to mitigate these issues effectively.
3. What is a data frame in R?
A data frame is a table or a two-dimensional array-like structure in which each column contains values of one variable and each row contains one set of values from each column. It’s similar to a table in a database or a data matrix.
A strong response will include that data frames are one of R's most important data structures and are used for storing data tables. They should also mention that data frames can hold different types of data, such as numeric, character, or factor, in each column.
4. Can you explain what factors are in R and why they are used?
Factors in R are variables that take on a limited number of unique values, known as levels. They are used to handle categorical data and are particularly useful in statistical modeling where categorical predictors are involved.
Candidates should highlight that factors are important for ensuring that the categorical data is treated correctly in modeling functions and for efficient storage in memory. They should also mention that factors can improve the readability of the data and the efficiency of certain types of data processing.
5. How would you merge two data frames in R?
To merge two data frames in R, we use the merge() function. This function allows you to specify columns for merging and handles different types of joins (inner, outer, left, right).
Ideal candidate responses should mention the importance of ensuring that the columns used for merging contain unique identifiers and that they understand the different types of merges and their implications on the resulting dataset.
6. What is the difference between a matrix and a data frame in R?
A matrix is a two-dimensional, homogeneous data structure, meaning it can only contain elements of the same type (e.g., all numeric or all character). In contrast, a data frame is a two-dimensional, heterogeneous data structure, allowing for different types of elements in each column.
Candidates should explain that matrices are often used for mathematical computations, while data frames are more flexible and suitable for most data analysis tasks due to their ability to handle mixed data types. Look for their understanding of when to use each data structure based on the task at hand.
7. How do you install and load a package in R?
To install a package in R, you use the install.packages() function with the name of the package as a string. To load the package into your R session, you use the library() function with the package name.
Look for candidates who can provide examples of commonly used packages and understand the importance of packages in extending R’s functionality. They should also mention that loading a package makes its functions and datasets available for use in the R session.
8. Can you explain what the apply family of functions is in R?
The apply family of functions in R includes apply(), lapply(), sapply(), tapply(), and others. These functions are used for repetitive tasks and apply a function to the margins of an array or elements of a list.
Candidates should mention that using these functions can make code more efficient and readable compared to traditional loops. They should also demonstrate understanding of the specific use cases for each function in the apply family and their advantages in data processing.
20 R Language interview questions to ask junior data scientists
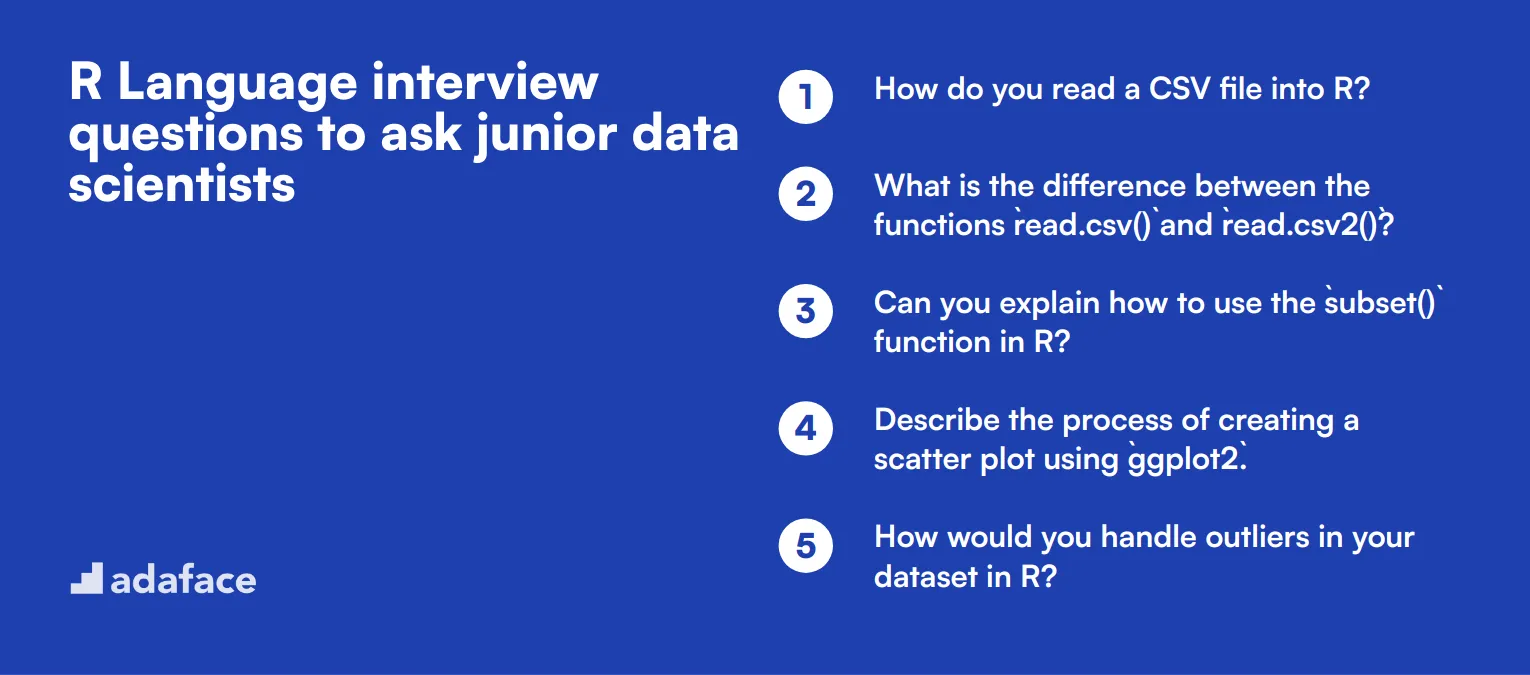
To determine whether your junior data scientist candidates have a solid foundation in R, consider using these 20 interview questions. They will help you assess their understanding of crucial R concepts and their ability to apply them. For further guidance, you can refer to our data scientist job description.
- How do you read a CSV file into R?
- What is the difference between the functions `read.csv()` and `read.csv2()`?
- Can you explain how to use the `subset()` function in R?
- Describe the process of creating a scatter plot using `ggplot2`.
- How would you handle outliers in your dataset in R?
- What is the purpose of the `dplyr` package?
- Explain the use of the `filter()` function in `dplyr`.
- How do you perform a t-test in R?
- What is the command to create a histogram in R?
- Discuss the difference between `lapply()` and `sapply()`.
- How do you convert a character vector to a factor in R?
- What is the `str()` function used for?
- Can you demonstrate how to create and interpret a boxplot in R?
- Explain the `mutate()` function in `dplyr`.
- How do you write a function in R?
- What is the difference between `plot()` and `qplot()`?
- Describe a situation where you would use the `aggregate()` function.
- How do you perform linear regression in R?
- What is the purpose of the `summary()` function in R?
- Explain the `group_by()` function in `dplyr`.
9 R Language interview questions and answers related to data manipulation techniques
To ensure your candidates have the right skills for data manipulation in R, explore these 9 essential questions. They are designed to assess an applicant's capability in handling real-world data tasks effectively, ensuring your interviews are both comprehensive and insightful.
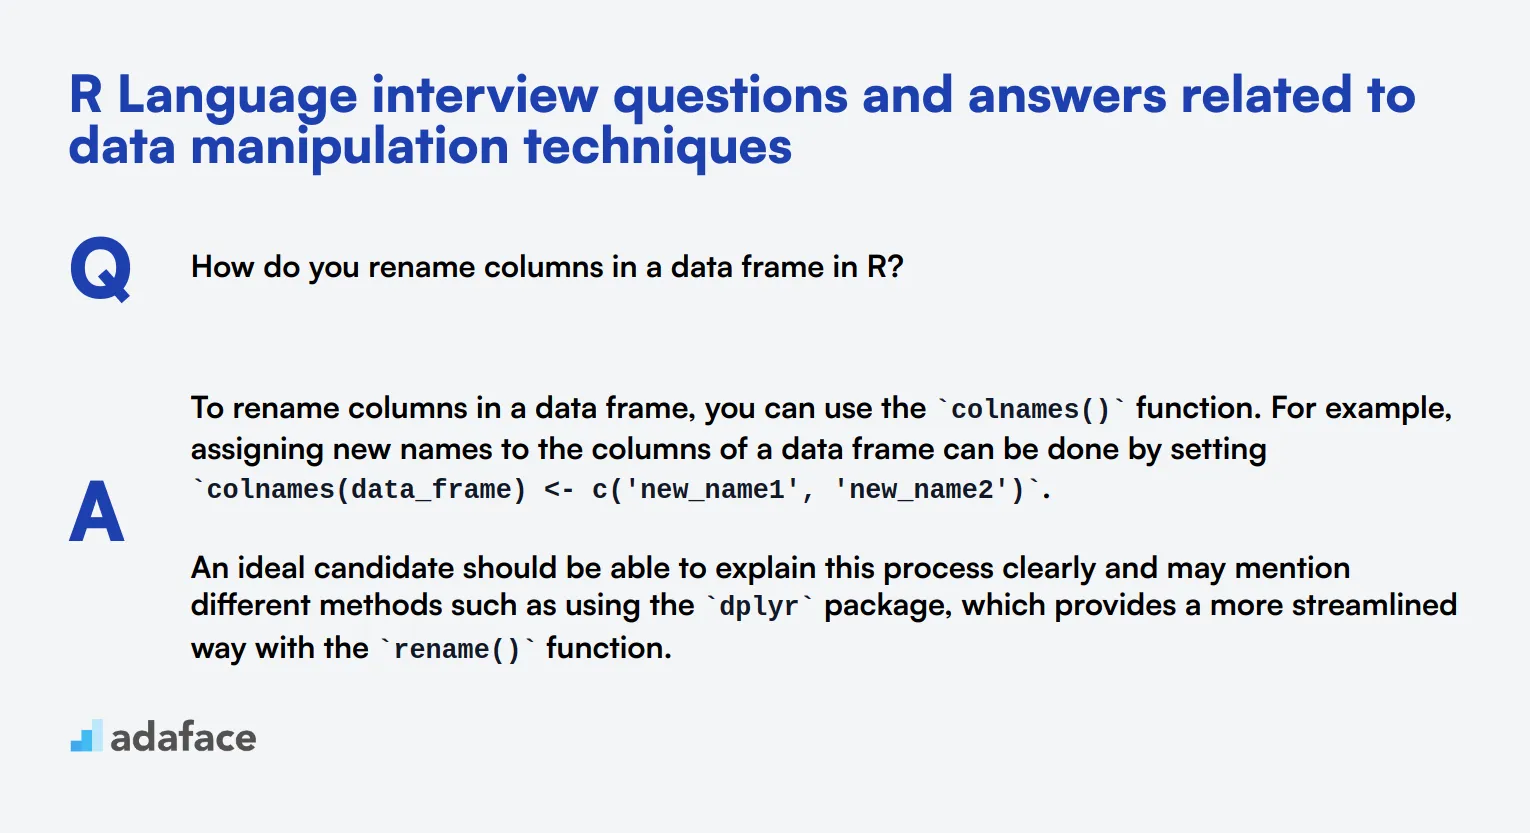
1. How do you rename columns in a data frame in R?
To rename columns in a data frame, you can use the colnames() function. For example, assigning new names to the columns of a data frame can be done by setting colnames(data_frame) <- c('new_name1', 'new_name2').
An ideal candidate should be able to explain this process clearly and may mention different methods such as using the dplyr package, which provides a more streamlined way with the rename() function.
2. What steps would you take to filter rows in a data frame based on a condition?
To filter rows based on a condition, you can use the subset() function or the filter() function from the dplyr package. For instance, subset(data_frame, condition) or filter(data_frame, condition).
Look for candidates who can explain the importance of filtering and provide examples of conditions they might use in practical scenarios, such as filtering out non-relevant data or focusing on specific groups within the dataset.
3. How do you add a new column to an existing data frame in R?
You can add a new column to an existing data frame by simply using the $ operator or using the mutate() function from the dplyr package. For example, data_frame$new_column <- values or mutate(data_frame, new_column = values).
Candidates should demonstrate an understanding of both methods and discuss why they might choose one over the other. An ideal response will show flexibility and knowledge of efficient data manipulation techniques.
4. How would you sort a data frame by multiple columns?
You can sort a data frame by multiple columns using the order() function. For example, data_frame[order(data_frame$column1, data_frame$column2), ]. Alternatively, the arrange() function from the dplyr package can be used as arrange(data_frame, column1, column2).
Strong candidates should explain the advantages of sorting and how it helps in organizing data for analysis. They should also mention practical scenarios where sorting by multiple columns is useful.
5. Can you explain how to remove duplicate rows from a data frame?
To remove duplicate rows, you can use the unique() function or the distinct() function from the dplyr package. For example, unique(data_frame) or distinct(data_frame).
The ideal response should include an understanding of why removing duplicates is important to ensure data quality and accuracy. Candidates should also mention practical scenarios where they have encountered and managed duplicate data.
6. How do you combine data frames by rows in R?
You can combine data frames by rows using the rbind() function. For example, rbind(data_frame1, data_frame2) will stack the rows of the two data frames together.
Look for candidates who can explain this process clearly and discuss any potential issues, such as incompatible column names or data types, and how they would resolve them to ensure a smooth combination of data sets.
7. How would you pivot data from wide format to long format?
To pivot data from wide to long format, you can use the gather() function from the tidyr package. This function allows you to specify which columns to gather and their new names.
Candidates should show familiarity with the concept of data reshaping and explain practical scenarios where pivoting data is necessary, such as preparing data for time series analysis or visualization.
8. What is your approach to summarizing data in R?
Summarizing data can be done using functions like summary(), aggregate(), or summarize() from the dplyr package. These functions help in calculating statistics such as mean, median, sum, and more for different groups within the data.
A strong candidate should discuss different methods and tools they've used to summarize data and how these summaries provide insights into their datasets. They should also mention the importance of understanding data distributions and trends.
9. How do you handle and change data types in R?
Changing data types in R can be done using functions like as.numeric(), as.character(), as.factor(), etc. These functions allow you to convert data from one type to another, ensuring compatibility and accuracy in analysis.
Expect candidates to explain why changing data types is important, such as ensuring correct calculations and analyses. They might share examples of data type issues they've encountered and how they resolved them.
12 R Language questions related to statistical methods
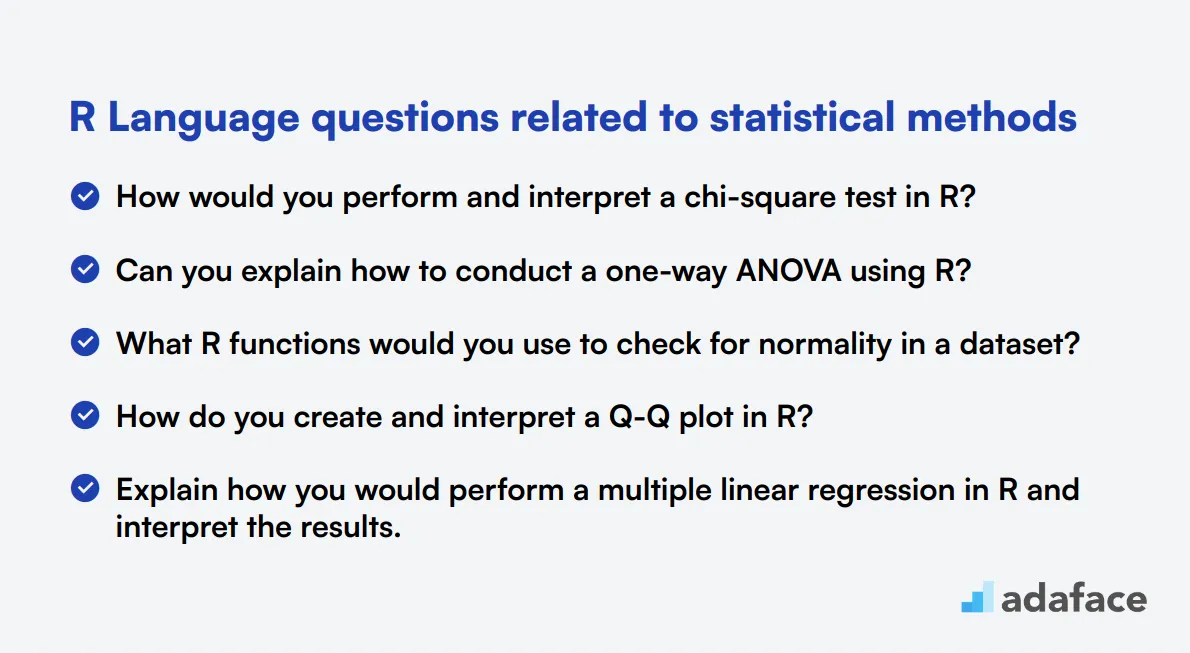
To assess a candidate's proficiency in statistical methods using R, consider incorporating these 12 questions into your interview process. These questions are designed to evaluate the statistical skills required for roles like Data Scientist or Data Analyst, focusing on practical applications of R in statistical analysis.
- How would you perform and interpret a chi-square test in R?
- Can you explain how to conduct a one-way ANOVA using R?
- What R functions would you use to check for normality in a dataset?
- How do you create and interpret a Q-Q plot in R?
- Explain how you would perform a multiple linear regression in R and interpret the results.
- How would you handle multicollinearity in a regression model using R?
- Can you describe the process of conducting a logistic regression in R?
- What R packages would you use for time series analysis, and why?
- How do you perform and interpret a Wilcoxon rank-sum test in R?
- Explain how you would conduct a power analysis for a t-test in R.
- How would you create and interpret a correlation matrix in R?
- Can you explain how to perform k-means clustering in R and determine the optimal number of clusters?
Which R Language skills should you evaluate during the interview phase?
It's unrealistic to expect to assess every potential skill of a candidate in a single interview. However, for R Language, there are a few core skills that you should focus on evaluating to get a comprehensive understanding of the candidate's proficiency.
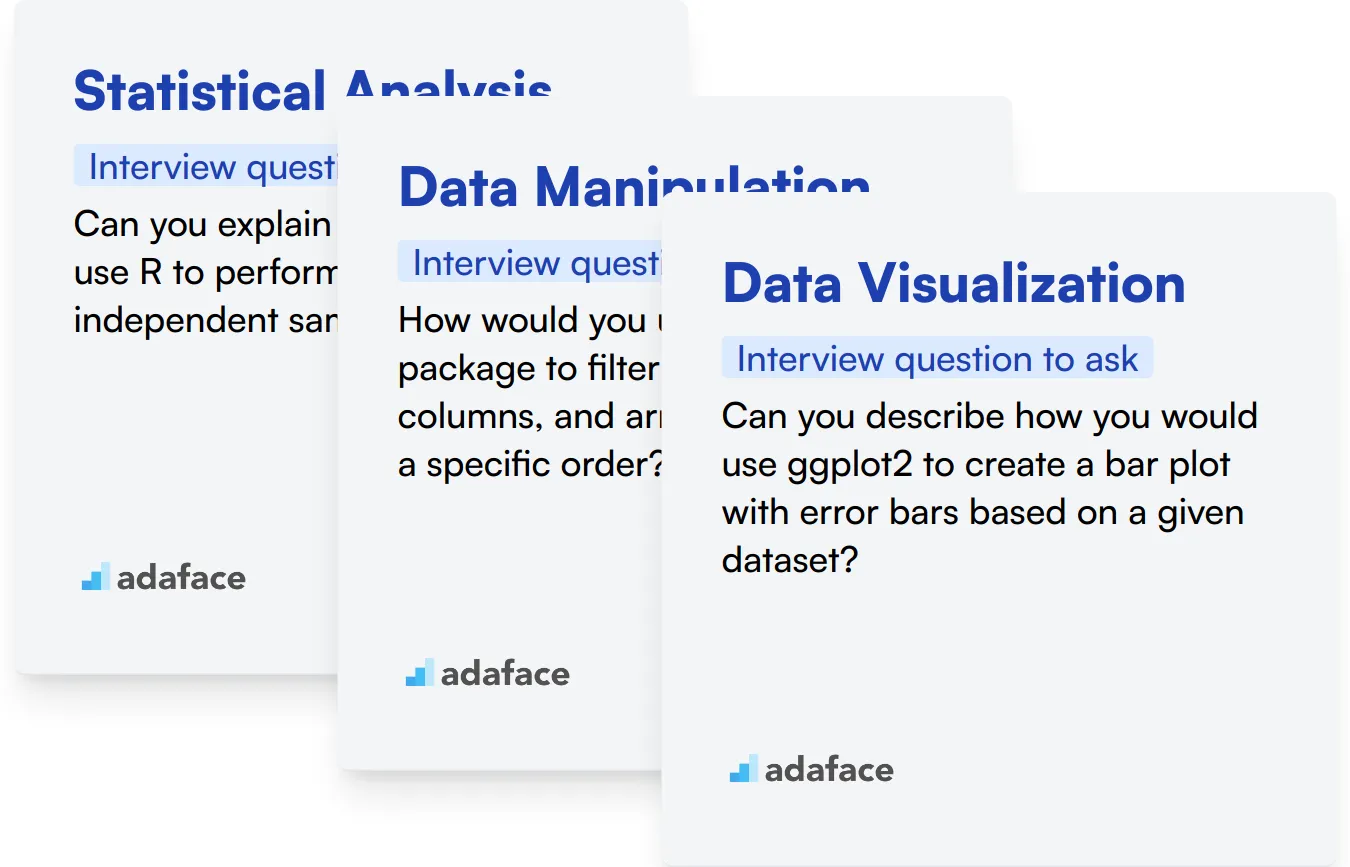
Statistical Analysis
To filter this skill, you can use an assessment test that asks relevant multiple-choice questions. Consider using the R online test available in our library.
During the interview, ask targeted questions specifically designed to judge their statistical analysis skills.
Can you explain how you would use R to perform a t-test on two independent samples?
Look for a clear understanding of the t-test process, including data preparation, assumptions checking, and interpreting the output of the t-test function in R.
Data Manipulation
Assess this skill using an R-focused test that includes questions on data manipulation. Our R online test is an excellent resource for this.
Ask questions that focus on their ability to manipulate and transform data using R.
How would you use the dplyr package to filter rows, select columns, and arrange the data in a specific order?
Expect the candidate to mention functions like filter(), select(), and arrange(), and provide an example of how these functions can be used together to manipulate a dataset.
Data Visualization
Use an assessment test to measure their ability to create visualizations in R. The R online test includes questions that gauge this skill.
In the interview, ask specific questions to assess their experience and approach to data visualization in R.
Can you describe how you would use ggplot2 to create a bar plot with error bars based on a given dataset?
The candidate should describe the process of creating a basic bar plot, adding error bars, and customizing the plot with ggplot2 functions like geom_bar() and geom_errorbar().
Find the best R Language expert for your team with Adaface
When hiring for R Language skills, it's important to ensure that candidates possess the necessary expertise. This means assessing both theoretical knowledge and practical application of R in real-world scenarios.
The most effective way to evaluate these skills is through tailored skill tests. Consider using our R online test to accurately measure candidates' proficiency.
Once you administer this test, you'll be able to shortlist the top applicants based on their performance. This streamlines the interview process, allowing you to focus on candidates who truly meet your requirements.
To take the next step, visit our assessment test library to explore more testing options or sign up to get started.
R Online Test
Download R Language interview questions template in multiple formats
R Language Interview Questions FAQs
Key topics include data manipulation, statistical methods, general R programming concepts, and practical application of R in data science projects.
Ask questions about basic R syntax, data structures, package usage, and simple data analysis tasks to evaluate their foundational knowledge.
Focus on techniques using dplyr, tidyr, and base R functions for filtering, transforming, and aggregating data.
Ask about implementing common statistical tests, regression analysis, and interpreting results using R's statistical functions and packages.

40 min skill tests.
No trick questions.
Accurate shortlisting.
We make it easy for you to find the best candidates in your pipeline with a 40 min skills test.
Try for freeRelated posts
Free resources


