
Quantitative Skills interview questions for freshers
1. Imagine you have a pizza and you cut it into 8 slices. If you eat 3 slices, what fraction of the pizza did you eat?
2. If you have 10 apples and you give 2 to your friend, how many apples do you have left?
3. You have $5 and you want to buy candy that costs $1 each. How many candies can you buy?
4. What's bigger, 1/2 or 1/4?
5. If a train travels at 60 miles per hour, how far will it travel in 2 hours?
6. If you have a square, are all the sides of the square equal?
7. How do you calculate the area of a square?
8. What is the sum of angles in a triangle?
9. Can you explain how percentages work in simple terms?
10. If something costs 20% less, how would you determine its new price?
11. What does 'average' mean, and how do you find it?
12. If you have a set of numbers, can you describe the steps to find the average?
13. How can charts and graphs help you understand information better?
14. What’s the difference between a bar graph and a pie chart?
15. If you see a trend going upwards on a graph, what does that usually mean?
16. What are some strategies you use to solve math problems?
17. How do you check if your answer to a math problem makes sense?
18. What steps do you take to solve a complex word problem?
19. Can you describe a situation where you needed to estimate something?
20. What are the differences between estimation and precise calculation?
21. In what kind of scenarios is estimation useful?
22. How would you explain probability to someone who has never heard of it?
23. If you flip a coin, what's the chance it will land on heads?
24. What does probability tell us about future events?
25. How would you approach learning a new math concept?
26. What resources do you use when you get stuck on a math problem?
27. Can you give an example of a time when you improved your math skills?
Quantitative Skills interview questions for juniors
1. Imagine you have a pile of toys. Can you sort them by color and then by size? How would you do it?
2. If you have five cookies and your friend has three, how many cookies do you both have together?
3. You have a dollar, and a candy costs 25 cents. How many candies can you buy?
4. If a train leaves New York at 9 AM traveling at 60 mph, and another leaves Chicago at 10 AM traveling at 70 mph, how do you figure out when they might meet?
5. What’s the best way to count all the students in your school quickly?
6. Let's say you're baking a cake and need to double the recipe. How would you figure out how much of each ingredient to use?
7. You’re planning a party and need to buy snacks for 20 people. If each person eats two snacks, how many snacks do you need in total?
8. If you save $2 each week, how many weeks will it take to save $20?
9. How do you compare the prices of two different boxes of cereal to figure out which is a better deal?
10. If you have a map, how do you figure out the distance between two places?
11. Suppose you have a set of numbers. How do you find the biggest and smallest numbers?
12. If you are tracking the number of sunny days in a month, how would you organize that information to see trends?
13. Describe how you might estimate the height of a tree without climbing it.
14. You are sharing a pizza with friends. How do you cut it so everyone gets an equal piece?
15. If you were given a budget to plan a field trip, what factors would you consider to stay within budget?
16. Explain how you understand percentage with an example.
17. Suppose you have to present data on favorite colors in class. How would you show that information?
18. If a store offers a 20% discount, how do you calculate the sale price of an item?
19. How do you determine the average grade in a class based on individual scores?
20. Can you explain how you would use ratio and proportions in a real life example?
21. You have a bunch of geometric shapes. How do you figure out which one has the biggest area?
22. What is the process for estimating how long a group of people will take to complete a task?
23. Explain a situation where understanding probability is useful.
24. Describe your method for ensuring accuracy when calculating expenses.
25. How do you keep track of time when managing multiple activities?
26. If you need to compare two sets of data, how do you decide which comparison method to use?
27. How do you apply logical reasoning when solving problems at work or school?
28. Explain a scenario where you had to analyze different options before making a decision.
29. How do you determine the range and variability within a dataset?
Quantitative Skills intermediate interview questions
1. Describe a time you used regression analysis to solve a business problem. What were the challenges, and how did you overcome them?
2. Explain how you would approach forecasting sales for a new product with limited historical data.
3. Walk me through your experience with A/B testing. What metrics did you focus on, and what were the key takeaways?
4. How would you determine the optimal pricing strategy for a product, considering factors like cost, competition, and demand?
5. Describe your experience with time series analysis. How did you handle seasonality and trends?
6. Explain how you would use Monte Carlo simulation to assess the risk of a project.
7. How would you analyze customer churn and identify key drivers?
8. Describe a situation where you had to present complex quantitative findings to a non-technical audience. How did you ensure they understood the key insights?
9. Explain how you would use statistical methods to detect fraud.
10. How would you optimize a marketing campaign using data analysis?
11. Describe your experience with hypothesis testing. What are some common pitfalls to avoid?
12. Explain how you would use clustering techniques to segment customers.
13. How would you evaluate the performance of a classification model?
14. Describe a time you had to deal with missing or incomplete data. How did you handle it?
15. Explain how you would use data visualization to communicate insights.
16. How would you determine the sample size needed for a survey?
17. Describe your experience with optimization techniques. How did you formulate the objective function and constraints?
18. Explain how you would use machine learning to predict customer behavior.
19. How would you assess the statistical significance of a result?
20. Describe a project where your quantitative skills led to a significant business impact. What were the key steps you took?
Quantitative Skills interview questions for experienced
1. Walk me through a time you used regression analysis to solve a business problem. What were the challenges and how did you overcome them?
2. Describe a situation where your quantitative analysis led to a significant cost saving or revenue increase for your company. Quantify the impact.
3. Explain a complex statistical concept, like Bayesian inference, to someone with no statistical background.
4. Tell me about a time you had to deal with missing or incomplete data. What techniques did you use to handle it, and how did you validate your approach?
5. Describe your experience with time series analysis. How have you used it to forecast future trends, and what metrics did you use to evaluate your forecasts?
6. How do you approach identifying and mitigating potential biases in your quantitative models?
7. Explain how you would design and analyze an A/B test to optimize a website's conversion rate.
8. Discuss a time when you had to present complex quantitative findings to a non-technical audience. How did you ensure they understood the key takeaways?
9. Describe a project where you used Monte Carlo simulation. What were the benefits of using this approach?
10. How do you stay up-to-date with the latest advancements in quantitative analysis and modeling techniques?
11. Walk me through your process of validating a complex financial model.
12. Imagine you are tasked with optimizing the pricing strategy for a new product. What quantitative methods would you employ?
13. Describe a situation where you had to make a critical decision based on conflicting quantitative data. How did you reconcile the discrepancies?
14. How do you ensure the accuracy and reliability of the data you use for your quantitative analyses?
15. Explain your experience with different statistical software packages (e.g., R, Python, SAS). What are the strengths and weaknesses of each?
16. How do you approach feature selection in a high-dimensional dataset?
17. Describe a time you identified and corrected an error in a previously published quantitative analysis.
18. How do you determine the appropriate sample size for a statistical analysis?
19. Explain how you would use quantitative methods to assess the risk associated with a new investment opportunity.
20. Describe your experience with data visualization tools. How do you use visualizations to communicate quantitative insights effectively?
21. What steps do you take to ensure your quantitative analyses are reproducible?
22. Describe a time you used quantitative analysis to identify a previously unknown pattern or trend in a dataset.
23. How do you balance the need for accuracy with the need for speed in quantitative analysis?
24. Tell me about a time you had to defend your quantitative findings against strong opposition.
25. Explain how you would use quantitative methods to improve the efficiency of a supply chain.
26. Describe a project where you had to build a predictive model from scratch. What were the key challenges, and how did you address them?
27. How do you ensure the ethical use of quantitative methods, particularly in situations where the results could have a significant impact on individuals?

Assessing quantitative skills during interviews is a must to ensure candidates can handle data, interpret numbers, and solve analytical problems. For roles requiring data-driven insights, such as financial analysts or business analysts, it's very to have a strong understanding of mathematics and statistics.
This blog post provides a list of quantitative skills interview questions tailored for various experience levels, from freshers to experienced professionals. We also included multiple-choice questions (MCQs) to help you assess candidates effectively.
By using these questions, you can better gauge a candidate's aptitude for roles that demand numerical analysis, while our quantitative aptitude test can help you screen candidates at scale before the interviews.
Table of contents
Quantitative Skills interview questions for freshers
Quantitative Skills interview questions for juniors
Quantitative Skills intermediate interview questions
Quantitative Skills interview questions for experienced
Quantitative Skills MCQ
Which Quantitative Skills skills should you evaluate during the interview phase?
Hire Data-Driven Talent with Quantitative Skills Tests
Download Quantitative Skills interview questions template in multiple formats
Quantitative Skills interview questions for freshers
1. Imagine you have a pizza and you cut it into 8 slices. If you eat 3 slices, what fraction of the pizza did you eat?
You ate 3 out of 8 slices, so the fraction of the pizza you ate is 3/8.
2. If you have 10 apples and you give 2 to your friend, how many apples do you have left?
You have 8 apples left.
10 apples - 2 apples = 8 apples
3. You have $5 and you want to buy candy that costs $1 each. How many candies can you buy?
You can buy 5 candies.
Since you have $5 and each candy costs $1, you can simply divide your total money by the cost per candy: $5 / $1 = 5 candies.
4. What's bigger, 1/2 or 1/4?
1/2 is bigger than 1/4. Imagine a pie. If you cut it into two slices, each slice (1/2) is clearly larger than if you cut it into four slices (1/4).
5. If a train travels at 60 miles per hour, how far will it travel in 2 hours?
The train will travel 120 miles. This is calculated by multiplying the speed of the train (60 miles per hour) by the time it travels (2 hours): 60 miles/hour * 2 hours = 120 miles.
6. If you have a square, are all the sides of the square equal?
Yes, by definition, all sides of a square are equal in length. A square is a quadrilateral (a four-sided polygon) with four right angles and four congruent sides.
7. How do you calculate the area of a square?
The area of a square is calculated by multiplying the length of one side by itself. Since all sides of a square are equal, you simply square the length of a side. The formula is:
Area = side * side or Area = side²
8. What is the sum of angles in a triangle?
The sum of the angles in any triangle is always 180 degrees. This holds true for all types of triangles, whether they are equilateral, isosceles, scalene, right-angled, acute, or obtuse.
9. Can you explain how percentages work in simple terms?
A percentage is simply a way of expressing a number as a fraction of 100. The word "percent" means "per hundred." So, when you say 50%, you're saying 50 out of every 100, or 50/100, which simplifies to 1/2. Essentially, it's a ratio scaled to a base of 100. To find a percentage of a number, you multiply the number by the percentage expressed as a decimal (e.g., 25% of 80 is 0.25 * 80 = 20).
For example, if you scored 80 out of 100 on a test, your percentage score is (80/100) * 100 = 80%. Percentages are widely used to show relative proportions, comparisons, or changes in values in various contexts, from finance to statistics.
10. If something costs 20% less, how would you determine its new price?
To determine the new price of something that costs 20% less, you can calculate the discount amount and subtract it from the original price. First, multiply the original price by 20% (or 0.20) to find the discount amount. Then, subtract that discount amount from the original price to get the new price.
For example, if the original price is $100, the discount is $100 * 0.20 = $20. The new price would then be $100 - $20 = $80. Alternatively, you can directly calculate 80% of the original price (100% - 20% = 80%), achieving the same result faster: $100 * 0.80 = $80.
11. What does 'average' mean, and how do you find it?
Average, also known as the mean, is a measure of central tendency. It represents a typical value in a set of numbers. To find the average, you sum up all the numbers in the set and then divide by the total number of values in the set.
For example, the average of the numbers 2, 4, 6, and 8 is (2 + 4 + 6 + 8) / 4 = 20 / 4 = 5. So, the average is 5.
12. If you have a set of numbers, can you describe the steps to find the average?
To find the average of a set of numbers:
- Sum the numbers: Add all the numbers in the set together.
- Count the numbers: Determine how many numbers are in the set.
- Divide the sum by the count: Divide the sum you calculated in step 1 by the count you determined in step 2. The result is the average (also known as the mean).
For example, if you have the numbers 2, 4, and 6:
- Sum = 2 + 4 + 6 = 12
- Count = 3
- Average = 12 / 3 = 4
13. How can charts and graphs help you understand information better?
Charts and graphs translate raw data into visual representations, making complex information easier to grasp. Instead of sifting through numbers, we can quickly identify trends, patterns, and outliers.
For example, consider sales data. A bar chart instantly shows which product sold the most, while a line graph reveals sales trends over time. This visual approach helps in decision-making and quickly understanding the story the data is telling, reducing cognitive load compared to analyzing spreadsheets.
14. What’s the difference between a bar graph and a pie chart?
A bar graph uses rectangular bars to represent data values, where the length of the bar is proportional to the value it represents. It's excellent for comparing distinct categories or showing changes over time. A pie chart, on the other hand, is a circular chart divided into slices, where each slice represents a proportion of the whole. Pie charts are ideal for illustrating the relative contribution of different parts to a whole.
In essence, bar graphs are better for comparing different categories and showing trends, while pie charts are better for showing proportions of a whole. Bar graphs can handle more categories and are generally easier to read accurately. Pie charts can become cluttered and difficult to interpret with too many slices.
15. If you see a trend going upwards on a graph, what does that usually mean?
An upward trend on a graph generally indicates an increase in the value being measured over time or across the x-axis variable. This increase can represent various phenomena depending on the context of the graph, such as:
- Growth in sales or revenue
- Increasing market share
- Rising temperature
- Higher website traffic. etc.
Essentially, the upward slope signifies a positive correlation between the x and y variables displayed.
16. What are some strategies you use to solve math problems?
When tackling math problems, I typically start by carefully reading and understanding the question to identify what's being asked. Then, I look for relevant formulas, theorems, or concepts that might apply. I break down complex problems into smaller, more manageable steps. I may try simplifying the problem by substituting smaller numbers or drawing diagrams to visualize the relationships.
If I'm still stuck, I'll look for patterns, work backward from a potential solution, or consider similar problems I've solved before. Estimation and checking my answer for reasonableness are crucial steps. Finally, if needed, I'll use external resources like textbooks or online tools. For particularly challenging problems, I'll often take a break and come back to it later with a fresh perspective.
17. How do you check if your answer to a math problem makes sense?
To check if my answer to a math problem makes sense, I use several strategies. First, I estimate. I approximate the numbers in the problem to get a rough idea of what the answer should be. Then I compare my calculated answer to this estimate; if they're wildly different, I know I've likely made a mistake. Second, I work backwards. I can plug my answer back into the original equation or problem to see if it holds true. If the equation doesn't balance or the problem's conditions aren't met, my answer is wrong.
Finally, I consider the units and the context of the problem. Does the answer have the correct units? Does the magnitude of the answer make sense in the real world? For instance, if I'm calculating the height of a building and get an answer of 5000 meters, that seems improbable, so I'd re-check my work. Sometimes, I also try solving the problem using a different method to see if I arrive at the same solution.
18. What steps do you take to solve a complex word problem?
When tackling a complex word problem, I first aim to understand the problem thoroughly. This involves reading it multiple times, identifying the key information, and defining what the problem is truly asking. I try to rephrase the problem in my own words to confirm my understanding. Next, I devise a plan, breaking down the problem into smaller, more manageable steps. This might involve identifying relevant formulas, drawing diagrams, or creating a simplified version of the problem.
Once I have a plan, I execute it systematically, carefully performing each step and double-checking my work. I pay close attention to units and ensure my calculations are accurate. Finally, I review my solution to make sure it makes sense in the context of the original problem. I consider whether the answer is reasonable and if it answers the initial question. If the answer seems off, I retrace my steps to find any errors and refine my approach accordingly.
19. Can you describe a situation where you needed to estimate something?
During a recent project, we needed to estimate the time required to migrate a legacy database to a new cloud-based system. There were several unknowns, including the exact volume of data, the complexity of the data transformations needed, and the performance of the new cloud platform.
To tackle this, I broke down the migration into smaller, more manageable tasks, such as data extraction, transformation, loading, and testing. For each task, I considered best-case, worst-case, and most likely scenarios, and used a weighted average (PERT estimation technique) to arrive at an estimate. We also factored in buffer time for unforeseen issues. This provided a reasonable estimate, and we were able to complete the migration within the projected timeframe. We also created a monitoring dashboard to track progress and refine the estimates as we moved forward. I used this SQL code block, to estimate the amount of rows expected:
SELECT COUNT(*) FROM old_database.table_name;
20. What are the differences between estimation and precise calculation?
Estimation aims for an approximate value, useful when exact data is unavailable or a quick result suffices. Precise calculation strives for an exact value using all available data and defined formulas. Estimation prioritizes speed and practicality, while precise calculation emphasizes accuracy and correctness.
In essence, estimation is about 'good enough', while precise calculation is about 'exactly right'. Consider scenarios: estimating project costs upfront versus calculating payroll taxes. One is a ballpark, the other must be exact.
21. In what kind of scenarios is estimation useful?
Estimation is useful in various scenarios, primarily for planning and resource allocation. It's crucial when determining project timelines, budgets, and the necessary resources (personnel, equipment, materials). Accurate estimations help in setting realistic expectations with stakeholders and making informed decisions about project feasibility.
Specific use cases include:
- Software Development: Estimating story points, task duration, and sprint velocity.
- Project Management: Creating project timelines, resource allocation, and budgeting.
- Business Planning: Forecasting sales, expenses, and profitability. Deciding whether to pursue a new opportunity.
- Risk Assessment: Quantifying potential risks and their impact on a project or business.
- Capacity Planning: Determining infrastructure requirements and scaling needs.
22. How would you explain probability to someone who has never heard of it?
Imagine you have a bag of different colored marbles. Probability is how likely you are to pick a specific color marble from that bag. If half the marbles are red, you have a 50% chance (or a probability of 0.5) of picking a red marble. It's a way of measuring how likely something is to happen. A probability of 0 means it will never happen, and a probability of 1 means it will always happen.
Essentially, probability helps us understand and quantify uncertainty. The more marbles of a particular color in the bag, the higher the probability of picking that color. Likewise, if you flip a fair coin, the probability of getting heads is 0.5 (or 50%), since there are two equally likely outcomes: heads or tails.
23. If you flip a coin, what's the chance it will land on heads?
The chance of a fair coin landing on heads is generally considered to be 50%, or 1/2. This assumes the coin is unbiased, meaning it's equally likely to land on either side.
In reality, slight imperfections in the coin's shape or weight distribution could introduce a minuscule bias, but for all practical purposes, a 50/50 probability is the standard assumption.
24. What does probability tell us about future events?
Probability provides a framework for quantifying uncertainty about future events. It doesn't guarantee any specific outcome, but instead assigns a numerical value (between 0 and 1) representing the likelihood of that event occurring. A higher probability suggests a greater likelihood, but doesn't eliminate the possibility of low-probability events.
Ultimately, probability helps us make informed decisions by understanding the range of possible outcomes and their relative likelihoods, which is crucial for risk assessment and planning. It's a tool for managing expectations, not predicting the future with certainty.
25. How would you approach learning a new math concept?
First, I'd try to understand the core idea of the new concept. I would start by reading introductory materials, watching videos (Khan Academy, MIT OpenCourseware), and looking for real-world examples. The goal at this stage is to get a high-level overview and build intuition.
Next, I would dive deeper into the formal definitions, theorems, and proofs. I'd actively work through examples and practice problems. If I get stuck, I would try to find alternative explanations or consult with peers/online resources. I'd also focus on understanding how this new concept connects to my existing knowledge. Finally, I would try to implement the concept in a small programming project to solidify my understanding and see how it works in practice.
26. What resources do you use when you get stuck on a math problem?
When I get stuck on a math problem, I typically start with a few online resources. First, I'll often use Khan Academy; their video explanations and practice exercises are usually very helpful for reviewing fundamental concepts. Wolfram Alpha is also a great tool for quick calculations and exploring mathematical relationships, and it often provides step-by-step solutions.
If those resources don't resolve the issue, I might consult textbooks or lecture notes from previous courses. For more complex problems, I'll search for relevant articles or papers on arXiv or similar sites. Finally, I will ask peers or experts in the field to give me guidance or suggestions.
27. Can you give an example of a time when you improved your math skills?
During my previous role, I was tasked with optimizing a pricing model. While I had a basic understanding of statistics, I realized I needed to deepen my knowledge to accurately predict customer behavior and maximize revenue. I dedicated time to learning regression analysis and time series forecasting through online courses and textbooks.
As I gained proficiency, I applied these techniques to analyze historical sales data, identify trends, and build a more sophisticated pricing algorithm. This resulted in a measurable improvement in sales and a better understanding of the factors driving customer demand. The initial learning curve was steep, but the practical application solidified my math skills and improved my problem-solving abilities.
Quantitative Skills interview questions for juniors
1. Imagine you have a pile of toys. Can you sort them by color and then by size? How would you do it?
First, I'd sort the toys by color. I'd create separate piles for each color (e.g., red, blue, green). Then, within each color pile, I would sort the toys by size. I'd visually compare the toys and arrange them from smallest to largest, creating sub-piles within each color. For example, within the 'red' pile, I'd have sub-piles of 'small red toys', 'medium red toys', and 'large red toys'.
2. If you have five cookies and your friend has three, how many cookies do you both have together?
You both have 8 cookies together. 5 (your cookies) + 3 (your friend's cookies) = 8 cookies.
3. You have a dollar, and a candy costs 25 cents. How many candies can you buy?
You can buy 4 candies. A dollar is equal to 100 cents, and since each candy costs 25 cents, you can divide 100 by 25 to get the number of candies you can purchase: 100 / 25 = 4.
4. If a train leaves New York at 9 AM traveling at 60 mph, and another leaves Chicago at 10 AM traveling at 70 mph, how do you figure out when they might meet?
To determine when the trains might meet, you need to consider the distance between New York and Chicago, and the relative speed of the trains. First, find the distance between the two cities. Then, account for the fact that the New York train has a one-hour head start. Calculate the distance the New York train covers in that hour. After that, determine the relative speed at which the trains are approaching each other (add the speeds together). Finally, divide the remaining distance by the relative speed to find the time it takes for them to meet. This will provide the number of hours after 10 AM Chicago time (or 9 am NY time) when they meet. Without the initial distance, a specific meeting time cannot be calculated.
5. What’s the best way to count all the students in your school quickly?
The best way to quickly count all students depends on the school's existing systems. If a centralized database or Student Information System (SIS) exists, a simple query would provide the count instantly. For example, a query like SELECT COUNT(*) FROM Students; would work.
If no system exists, a practical approach would be to ask each homeroom or class teacher for their official roster count. Summing these counts provides a school-wide total. To ensure accuracy, cross-check these counts with attendance records or enrollment office records if discrepancies arise.
6. Let's say you're baking a cake and need to double the recipe. How would you figure out how much of each ingredient to use?
To double a recipe, you simply multiply the quantity of each ingredient by 2. For example, if the original recipe calls for 1 cup of flour, you would use 2 cups of flour. If it calls for 1/2 teaspoon of salt, you would use 1 teaspoon of salt.
It's crucial to be accurate when measuring ingredients, especially in baking, as incorrect proportions can affect the final product's texture and taste. Using measuring cups and spoons is highly recommended. If a recipe includes instructions like baking time or temperature, leave those as they are because doubling the ingredients doesn't necessarily mean you need to double the cooking time or temperature, unless stated otherwise.
7. You’re planning a party and need to buy snacks for 20 people. If each person eats two snacks, how many snacks do you need in total?
You need a total of 40 snacks.
Since each of the 20 people will eat 2 snacks, you can calculate the total number of snacks by multiplying the number of people by the number of snacks per person: 20 people * 2 snacks/person = 40 snacks.
8. If you save $2 each week, how many weeks will it take to save $20?
It will take 10 weeks to save $20. You can find this by dividing the total amount you want to save ($20) by the amount you save each week ($2). 20 / 2 = 10.
9. How do you compare the prices of two different boxes of cereal to figure out which is a better deal?
To compare cereal prices, calculate the price per ounce for each box. Divide the total price of the box by the number of ounces it contains. This gives you the unit price (price/ounce).
Then, compare the unit prices. The cereal box with the lower price per ounce is the better deal.
10. If you have a map, how do you figure out the distance between two places?
To find the distance between two places on a map, I would first identify the two locations on the map. Then, I would use the map's scale to determine the actual distance represented by a unit of measurement on the map (e.g., 1 inch equals 1 mile). Finally, I would measure the distance between the two points on the map using a ruler or other measuring tool and multiply that measurement by the map's scale to get the real-world distance. Online maps provide this distance information directly, typically using the Haversine formula or similar to calculate the great-circle distance based on latitude and longitude coordinates.
Specifically in code or for a mapping API, this is calculated with longitude and latitude like: calculateDistance(lat1, lon1, lat2, lon2) where you'd use the Haversine formula or a library utilizing it. The formula accounts for the curvature of the Earth to provide an accurate distance. Some libraries also consider road networks for driving distance.
11. Suppose you have a set of numbers. How do you find the biggest and smallest numbers?
To find the biggest and smallest numbers in a set, you can iterate through the set while keeping track of the current maximum and minimum values encountered. Initialize both the minimum and maximum to the first element of the set. Then, for each subsequent number, compare it to the current maximum and minimum. If the number is larger than the current maximum, update the maximum. If the number is smaller than the current minimum, update the minimum. After iterating through all the numbers, the maximum and minimum variables will hold the largest and smallest numbers in the set, respectively.
For example, in Python:
def find_min_max(numbers):
 if not numbers:
 return None, None
 min_num = numbers[0]
 max_num = numbers[0]
 for num in numbers:
 if num < min_num:
 min_num = num
 if num > max_num:
 max_num = num
 return min_num, max_num
12. If you are tracking the number of sunny days in a month, how would you organize that information to see trends?
To track and analyze trends in the number of sunny days per month, I would organize the data in a time series format. Specifically, I would create a table or spreadsheet with two columns: 'Month' and 'Number of Sunny Days'. Each row would represent a month and the corresponding count of sunny days. I would then enter the collected data for each month over multiple years. This arrangement allows for easy visualization of trends. I would use tools such as line charts to plot the data to look for seasonality, long-term increases or decreases, or anomalies. I would consider calculating rolling averages to smooth out short-term fluctuations to better visualize underlying trends. Statistical analysis like calculating mean, standard deviation, and correlation coefficients could also be helpful in identifying patterns and dependencies.
13. Describe how you might estimate the height of a tree without climbing it.
There are several ways to estimate the height of a tree without climbing it. One simple method is the "stick method." Hold a stick vertically at arm's length, ensuring the portion of the stick above your hand appears to be the same length as the tree. Then, keeping your arm extended and the stick vertical, turn your wrist so that the base of the stick is now horizontal. Have someone mark the point on the ground where the top of the stick appears to be. The distance from you to that mark is approximately the height of the tree.
Another approach involves using similar triangles. Measure the length of your shadow and the length of the tree's shadow. Since the angle of the sun is the same, the ratio of your height to your shadow's length will be equal to the ratio of the tree's height to its shadow's length. Using this proportion (your height / your shadow length = tree height / tree shadow length), you can solve for the tree's height. You'll need a tape measure or pacing to get shadow lengths, and you need to know your own height.
14. You are sharing a pizza with friends. How do you cut it so everyone gets an equal piece?
The goal is to divide the pizza into equal slices based on the number of people sharing. Here's the general approach:
- Count the number of people,
n. This is the number of slices you need. - Cut the pizza in half. Then cut each half in half again. This will create 4 equal pieces. If
n=4, you are done. - If
nis not a power of 2 (e.g., 3, 5, 6), you'll need to estimate the angles. Divide 360 degrees (full circle) byn. The result is the angle of each slice. Try to visualize these angles as you cut, aiming for equal portions. You can make initial cuts and then adjust the slice sizes as necessary to ensure fairness.
15. If you were given a budget to plan a field trip, what factors would you consider to stay within budget?
- Transportation: Compare costs of different options (bus, train, carpool). Consider distance and fuel efficiency. Negotiate group rates.
- Accommodation: Explore budget-friendly options like hostels or camping. Look for discounts or free options (e.g., staying with friends/family). Consider location relative to activities to minimize transportation costs.
- Activities: Prioritize free or low-cost activities (parks, museums on free days). Pack lunches/snacks to avoid expensive meals. Look for student/group discounts. Create a detailed itinerary and stick to it, avoiding impulse purchases.
- Food: Pack meals and snacks instead of buying them. Choose affordable restaurants. Set a daily food budget.
- Contingency: Set aside a small percentage of the budget for unexpected expenses.
16. Explain how you understand percentage with an example.
Percentage is a way of expressing a number as a fraction of 100. It represents how many parts out of one hundred a certain quantity represents. For example, if you score 80 out of 100 on a test, you scored 80%. This means you got 80 parts correct out of a possible 100.
Another example: If a store offers a 20% discount on an item priced at $50, the discount amount is calculated as (20/100) * $50 = $10. So, you would save $10 and pay $40 for the item.
17. Suppose you have to present data on favorite colors in class. How would you show that information?
I would use a bar chart or a pie chart to visually represent the data on favorite colors. A bar chart would clearly show the frequency of each color, making it easy to compare popularity. The x-axis would list the colors, and the y-axis would represent the number of people who chose each color.
Alternatively, a pie chart would show the proportion of each color relative to the whole group. Each slice of the pie would represent a color, and the size of the slice would correspond to the percentage of people who favor that color. I'd ensure the chart is clearly labeled with the color names and corresponding percentages for better understanding.
18. If a store offers a 20% discount, how do you calculate the sale price of an item?
To calculate the sale price after a 20% discount, you can follow these steps:
- Calculate the discount amount: Multiply the original price by 20% (or 0.20).
Discount = Original Price * 0.20 - Subtract the discount from the original price: This gives you the sale price.
Sale Price = Original Price - Discount
For example, if an item costs $100, the discount would be $100 * 0.20 = $20. The sale price would then be $100 - $20 = $80. Alternatively, you can directly calculate the sale price by multiplying the original price by 80% (or 0.80): Sale Price = Original Price * 0.80
19. How do you determine the average grade in a class based on individual scores?
To determine the average grade in a class, you sum all the individual scores and then divide by the total number of scores. For example, if you have the scores 85, 90, and 75, you would calculate (85 + 90 + 75) / 3, which equals 83.33. This is the average grade.
In code, this could look something like this (Python example):
def calculate_average(scores):
  total = sum(scores)
  average = total / len(scores)
  return average

scores = [85, 90, 75]
average_grade = calculate_average(scores)
print(average_grade)
20. Can you explain how you would use ratio and proportions in a real life example?
Ratio and proportion are incredibly useful in real life. For example, let's say I'm baking a cake, and the recipe calls for 2 cups of flour and 1 cup of sugar. That's a ratio of 2:1. If I want to make a bigger cake and use 6 cups of flour, I can use proportions to figure out how much sugar I need.
Setting up the proportion: 2/1 = 6/x. Solving for x (the amount of sugar) gives me x = 3 cups. So, to maintain the correct ratio for the larger cake, I'd need 6 cups of flour and 3 cups of sugar. This concept extends to things like scaling recipes, calculating fuel efficiency, or converting currencies.
21. You have a bunch of geometric shapes. How do you figure out which one has the biggest area?
To determine the shape with the largest area, you need to: 1. Identify the types of shapes you have. 2. Apply the correct area formula for each shape. For example, for a rectangle it is length * width, for a circle it is pi * radius^2, and for a triangle it can be 0.5 * base * height. 3. Calculate the area of each shape using the provided or measured dimensions. Finally, compare the calculated areas and identify the shape with the maximum value. If the shapes are complex or irregular, you might need to divide them into simpler shapes or use numerical integration techniques to estimate the area.
22. What is the process for estimating how long a group of people will take to complete a task?
Estimating task completion time for a group involves several steps. First, break down the task into smaller, well-defined subtasks. Next, individually estimate the time each person will need to complete their assigned subtasks, considering their skills and experience. Use techniques like planning poker or bottom-up estimating, and account for potential risks and dependencies.
Finally, aggregate the individual estimates, adding buffer time to account for unforeseen delays, communication overhead, and potential integration issues. Regularly track progress, compare it against the initial estimates, and adjust the remaining timeline as needed. Communication is key to keeping the project on track and ensuring everyone is aware of the timeline.
23. Explain a situation where understanding probability is useful.
Understanding probability is crucial in many real-world situations. One example is in medical diagnosis. When a doctor orders a test, it's important to understand the test's sensitivity and specificity. Sensitivity tells you the probability that a test will correctly identify someone with the disease (true positive rate). Specificity tells you the probability that a test will correctly identify someone without the disease (true negative rate). These probabilities, combined with the prevalence of the disease in the population, help determine the probability that a positive test result actually means the patient has the disease. Without this understanding, a patient might undergo unnecessary anxiety and further testing based on a false positive.
Another example occurs when evaluating A/B testing results in software development. Say we roll out a new feature to a small segment of our users (A/B test). We need to determine if the observed increase in a metric (e.g., click-through rate) is statistically significant or just due to random chance. Understanding p-values and statistical significance helps us decide whether to confidently launch the feature to all users, or to dismiss the observed effect as simply noise. We can calculate the probability that the increase in click-through rate happened because of the new feature and if it's above a threshold, we can roll it out. Otherwise the change is meaningless.
24. Describe your method for ensuring accuracy when calculating expenses.
My method for ensuring accuracy when calculating expenses involves several steps. First, I meticulously record every expense as it occurs, using a spreadsheet or dedicated expense tracking software. Each entry includes the date, vendor, description, amount, and payment method. Second, I reconcile these records regularly (at least weekly) against bank statements and credit card statements to identify any discrepancies. Any differences are investigated immediately and corrected. This reconciliation process helps catch errors like incorrect amounts or duplicate entries.
Finally, I utilize built-in formulas and functions within my spreadsheet software to automate calculations and minimize the risk of manual calculation errors. I double-check these formulas for accuracy and periodically review past expense reports to ensure consistency in categorization and reporting. Regular backups of my expense records are also maintained to prevent data loss.
25. How do you keep track of time when managing multiple activities?
When managing multiple activities, I prioritize using a combination of digital and analog tools to stay organized and on schedule. I leverage a digital calendar (like Google Calendar or Outlook Calendar) to block out specific time slots for each task or activity. This provides a visual representation of my day and helps me allocate time effectively. I also use a task management application like Todoist or Microsoft To Do to break down larger projects into smaller, manageable steps with due dates and reminders. These tools allow for prioritization and rescheduling as needed.
Additionally, I maintain a simple, physical notepad for quick notes, brainstorming, and capturing immediate action items. This helps me avoid digital distractions and stay focused during specific work blocks. Throughout the day, I regularly check my calendar and task list to ensure I'm on track and adjust my schedule as necessary. For example, if I'm working on a programming project, I might use a timer (like Pomodoro technique) to work in focused 25-minute intervals with short breaks in between, helping me manage time efficiently and avoid burnout.
26. If you need to compare two sets of data, how do you decide which comparison method to use?
When comparing two sets of data, the choice of comparison method depends on several factors including the data type, size, desired outcome, and available tools. If the data is numerical and I need to understand statistical differences, I'd use statistical tests like t-tests or ANOVA. If I need to simply identify differences or similarities in a list of items, set operations (intersection, union, difference) might suffice. For comparing strings, I'd consider techniques like Levenshtein distance or regular expressions.
For example, if comparing two lists of IDs in Python:
set1 = {1, 2, 3}
set2 = {2, 3, 4}
diff = set1 - set2 # Finds elements in set1 but not in set2
The goal is to use the most efficient and appropriate method to achieve the desired result with the data at hand. Understanding the data characteristics and desired comparison outcome is crucial in this decision process.
27. How do you apply logical reasoning when solving problems at work or school?
When tackling problems, I start by clearly defining the issue and breaking it down into smaller, manageable parts. Then, I gather relevant information and identify potential causes or solutions. I use deductive reasoning to eliminate possibilities that contradict the evidence and inductive reasoning to identify patterns or trends that point towards a likely solution. For example, if a software bug appears, I'll first reproduce the bug consistently. Then I might use a debugger and examine the call stack, variable states, and code execution path to pinpoint the exact line of code causing the issue. I use conditional logic to explore different scenarios and test assumptions.
Also, I actively consider alternative perspectives and challenge my own assumptions to avoid cognitive biases. I might create a decision matrix to weigh the pros and cons of each solution based on established criteria. Finally, I evaluate the effectiveness of the chosen solution based on data and feedback, making adjustments as needed. This iterative process helps ensure I arrive at the most logical and practical outcome. For programming, I will often follow this pattern:
- Identify the problem.
- Break the problem into smaller steps.
- Write psuedo code to outline the solution.
- Translate psuedo code into a working code example.
- Test the example.
- Refactor the code for improvements.
28. Explain a scenario where you had to analyze different options before making a decision.
A recent project involved choosing the optimal database for a new microservice. We had three main options: PostgreSQL, MongoDB, and Cassandra. I analyzed each option based on several criteria: data structure, scalability, consistency requirements, query complexity, and cost. PostgreSQL offered strong consistency and complex querying but potentially limited scalability. MongoDB offered flexibility and scalability but weaker consistency. Cassandra was highly scalable but required a different data modeling approach and had steeper learning curve.
After evaluating these options using a decision matrix that weighted each criterion based on project needs, I determined that PostgreSQL was the most suitable because its strong consistency and querying capabilities were paramount for the specific data and reporting requirements, outweighing the scalability benefits of the other options. We mitigated potential scalability issues through proper schema design and planned sharding.
29. How do you determine the range and variability within a dataset?
To determine the range, I'd calculate the difference between the maximum and minimum values in the dataset. This gives a simple measure of overall spread. For variability, I would typically use standard deviation or variance. Standard deviation represents the average distance of each data point from the mean, while variance is the square of the standard deviation.
Other measures of variability include the interquartile range (IQR), which is the difference between the 75th and 25th percentiles, making it robust to outliers. I'd choose the appropriate measure based on the data's distribution and sensitivity to outliers. For instance, IQR is preferred when the data contains extreme values.
Quantitative Skills intermediate interview questions
1. Describe a time you used regression analysis to solve a business problem. What were the challenges, and how did you overcome them?
In my previous role, we were experiencing inconsistent sales performance across different regions. To understand the drivers of sales and predict future performance, I used multiple linear regression. The independent variables included marketing spend, population density, average income, and number of competitors. One major challenge was multicollinearity between population density and average income. To address this, I used Variance Inflation Factor (VIF) to identify and remove highly correlated variables. Another issue was ensuring the assumptions of linearity, independence, homoscedasticity, and normality were met. I used residual plots and statistical tests like the Shapiro-Wilk test to check these assumptions and applied transformations (e.g., log transformation) to the dependent variable where necessary. The final model allowed us to identify that marketing spend and number of competitors were the most significant predictors of sales. This allowed the business to allocate marketing resources more efficiently and develop targeted strategies for competitive regions.
2. Explain how you would approach forecasting sales for a new product with limited historical data.
Forecasting sales for a new product with limited historical data requires a blend of qualitative and quantitative methods. I'd start by defining the target market and identifying comparable products (if any). I'd analyze market research reports, conduct surveys, and gather expert opinions to understand potential demand and market trends. This helps establish a baseline forecast.
Then, I'd use statistical techniques like regression analysis with proxy variables (e.g., data from similar products or related market indicators). Sensitivity analysis would be crucial to understand the impact of different assumptions on the forecast. Finally, I'd continuously monitor actual sales data as it becomes available and refine the forecast iteratively using time series methods as more data points accrue.
3. Walk me through your experience with A/B testing. What metrics did you focus on, and what were the key takeaways?
In my previous role, I actively participated in A/B testing to optimize user experience and improve key performance indicators. For example, we ran A/B tests on our landing page to increase conversion rates. We tested different headlines, call-to-action buttons, and images, splitting traffic equally between the control (original) and variant pages. The primary metric we focused on was conversion rate (percentage of visitors completing a desired action). Secondary metrics included bounce rate, time on page, and click-through rates on key elements.
Key takeaways included the importance of clearly defining the hypothesis before launching a test, ensuring sufficient sample size and statistical significance before making decisions, and continuously monitoring the results even after implementation. One test resulted in a 15% increase in conversion rates by simply changing the color and wording of the primary call-to-action button. Another taught us that sometimes, even seemingly small changes, like rearranging the layout of content, can dramatically improve user engagement. Regular A/B testing is vital for data-driven decisions.
4. How would you determine the optimal pricing strategy for a product, considering factors like cost, competition, and demand?
Determining the optimal pricing strategy involves a multi-faceted approach. First, calculate the cost (both fixed and variable) associated with producing and delivering the product. This sets a baseline price to ensure profitability. Then, analyze the competitive landscape. Identify key competitors and their pricing strategies. Understand the unique value proposition of your product compared to theirs.
Next, assess demand. Use market research, surveys, or historical sales data to understand price elasticity. Experiment with different price points through A/B testing or limited-time offers to gauge customer response. Finally, consider factors like brand perception, target audience, and overall business goals to refine the price. Iterate and adjust pricing based on ongoing performance monitoring and market changes.
5. Describe your experience with time series analysis. How did you handle seasonality and trends?
I have experience with time series analysis for forecasting sales, predicting website traffic, and analyzing stock prices. I've used various techniques, including ARIMA, Exponential Smoothing (like Holt-Winters), and Prophet, depending on the dataset's characteristics.
To handle seasonality, I've used techniques like seasonal decomposition to isolate the seasonal component, then applied methods like seasonal differencing within ARIMA models or incorporated seasonal parameters in models like Holt-Winters. For trends, I've used differencing to make the time series stationary before modeling, or incorporated trend components within the model itself (e.g., linear or exponential trends in Exponential Smoothing, or trend components within ARIMA). I've also used rolling statistics to identify and smooth out trends before modeling.
6. Explain how you would use Monte Carlo simulation to assess the risk of a project.
To assess project risk with Monte Carlo simulation, I'd first identify key project variables (e.g., cost, duration, resource availability) that have uncertainty. Then, I'd define probability distributions for each variable (e.g., triangular, normal, uniform) based on historical data, expert opinions, or realistic assumptions. The simulation involves running thousands of iterations, each time randomly sampling values from these distributions to calculate a project outcome (e.g., total cost, completion time).
By analyzing the distribution of these outcomes, I can quantify the probability of different scenarios, such as exceeding the budget or missing the deadline. This helps in understanding the range of possible results and the associated risks, allowing for better informed decisions and contingency planning. The output can be visualized using histograms or cumulative probability curves, highlighting the potential upside and downside of the project.
7. How would you analyze customer churn and identify key drivers?
To analyze customer churn and identify key drivers, I would start by defining churn clearly (e.g., customers who haven't made a purchase/used service in X days). Then, I'd gather relevant data like customer demographics, purchase history, website activity, support interactions, and survey responses. I'd use descriptive statistics to understand the overall churn rate and how it varies across different customer segments. After that, I'd perform exploratory data analysis (EDA) to look for correlations between churn and various features. Techniques could include visualizing churn rates by segment, calculating correlation coefficients, and using chi-squared tests.
Finally, I would build predictive models (e.g., logistic regression, survival analysis, random forests) to identify the most important predictors of churn. Feature importance from these models helps pinpoint key drivers. For example, a model might reveal that customer_satisfaction_score < 3 and number_of_support_tickets > 5 are strong predictors of churn. It's important to evaluate the model's performance (precision, recall, F1-score, AUC) and iterate to improve its accuracy and identify non-linear relationships. These models also help identify customers at high risk of churn.
8. Describe a situation where you had to present complex quantitative findings to a non-technical audience. How did you ensure they understood the key insights?
In a previous role, I analyzed website user behavior to identify areas for improvement in the user experience. The findings involved metrics like conversion rates, bounce rates, and funnel analysis, which were presented to the marketing team who primarily focused on creative and branding. To ensure understanding, I avoided technical jargon and focused on the 'so what?' I translated the data into actionable insights presented visually using charts and graphs with clear, concise labels. I emphasized the business impact of each finding, for example, instead of saying 'Bounce rate is 60%', I would say '60% of users leave the site after viewing only one page, indicating a potential issue with landing page content or design. This is costing us potential leads.'
I also used analogies and relatable examples. For instance, I compared the user journey to a shopping experience, explaining drop-off points as customers leaving a store without buying anything. I made sure to provide a clear narrative, highlighting the most important takeaways and answering any questions in plain language, ensuring the audience grasped the core message and its implications for their marketing strategies. I asked frequently if they understood, and asked clarifying questions of them to ensure I knew that they understood.
9. Explain how you would use statistical methods to detect fraud.
Statistical methods are invaluable for fraud detection because they can identify unusual patterns and outliers that might indicate fraudulent activity. I would start by defining what constitutes "normal" behavior for the data in question, creating baseline metrics using descriptive statistics such as mean, median, standard deviation, and percentiles. I'd then use inferential statistics and modeling techniques to identify deviations from these baselines.
Specifically, techniques like anomaly detection (e.g., using z-scores or clustering algorithms like k-means), regression analysis (to identify unexpected relationships between variables), and classification models (e.g., logistic regression or decision trees trained on labeled data) can be used. For example, Benford's Law can be applied to check if numerical data conforms to expected digit distributions, which can flag fabricated financial data. Additionally, hypothesis testing can be used to determine the statistical significance of observed differences between groups (e.g., fraudulent vs. non-fraudulent transactions). Regularly monitoring these metrics and models allows for the timely detection of suspicious activities.
10. How would you optimize a marketing campaign using data analysis?
To optimize a marketing campaign using data analysis, I would first define clear Key Performance Indicators (KPIs) like conversion rates, click-through rates, and cost per acquisition. Then, I'd gather data from various sources, including the campaign platform, website analytics, and CRM. I'd analyze this data to identify trends, patterns, and areas for improvement. For example, I might discover that specific demographics respond better to certain ad creatives or that particular landing pages have high bounce rates.
Based on these findings, I would make data-driven adjustments to the campaign. This could involve refining targeting parameters, A/B testing different ad copy or visuals, optimizing landing pages for better user experience, or reallocating budget to the most effective channels. Continuous monitoring and analysis of campaign performance are crucial to ensure ongoing optimization and improved results.
11. Describe your experience with hypothesis testing. What are some common pitfalls to avoid?
I've used hypothesis testing extensively to validate assumptions and draw conclusions from data. My experience includes formulating null and alternative hypotheses, selecting appropriate statistical tests (like t-tests, chi-square tests, and ANOVA), determining significance levels (alpha), calculating p-values, and interpreting the results to either reject or fail to reject the null hypothesis. I've applied this in A/B testing for product improvements, analyzing experiment data, and verifying model performance.
Common pitfalls to avoid include: p-hacking (manipulating data or analyses to achieve a statistically significant result), ignoring statistical power (the probability of detecting a true effect), confusing statistical significance with practical significance (a statistically significant result might not be meaningful in the real world), and failing to validate assumptions of the statistical tests used (e.g., normality, independence). Also, multiple comparisons without correction (e.g., Bonferroni correction) can inflate the false positive rate. Finally, interpreting correlation as causation is a frequent mistake.
12. Explain how you would use clustering techniques to segment customers.
I would use clustering techniques like K-Means or hierarchical clustering to group customers based on similar characteristics. First, I'd gather customer data such as demographics, purchase history, website activity, and survey responses. Then, I would preprocess the data by cleaning, normalizing, and handling missing values. Feature engineering might be used to create new features. After preparing the data, I'd apply a clustering algorithm, selecting the appropriate number of clusters using methods like the elbow method or silhouette analysis.
Finally, I would analyze each cluster to understand the common traits of customers within that segment. For example, one cluster might represent high-value customers who frequently purchase premium products, while another might represent price-sensitive customers who primarily buy discounted items. These segments can then be used to personalize marketing campaigns, develop targeted products, and improve customer service strategies. It helps in better resource allocation.
13. How would you evaluate the performance of a classification model?
To evaluate a classification model, several metrics are commonly used. Accuracy, which measures the overall correctness, is a basic starting point but can be misleading with imbalanced datasets. Precision (how many predicted positives are actually positive) and recall (how many actual positives are predicted positive) provide a more detailed view. The F1-score, the harmonic mean of precision and recall, offers a balanced measure. The Area Under the Receiver Operating Characteristic Curve (AUC-ROC) is another powerful metric that assesses the model's ability to distinguish between classes across various threshold settings.
For imbalanced datasets, metrics like precision, recall, F1-score, and AUC-ROC are generally preferred over accuracy. Additionally, one might use a confusion matrix to visualize the performance and identify specific areas where the model struggles, such as misclassifying one class more often than others. Evaluating the model on various subsets of the data, especially when dealing with known biases or variations in the population, can also provide a more thorough understanding of its performance.
14. Describe a time you had to deal with missing or incomplete data. How did you handle it?
In a previous role, I was working on a sales forecasting project, and we discovered a significant portion of historical customer order data was missing key product category information. Without this, accurate forecasting was impossible.
To address this, I first collaborated with the sales and data engineering teams to understand why the data was missing and to prevent future occurrences. Next, I employed a combination of methods to fill the gaps: I used existing customer profiles to infer likely product categories based on their past purchase history of similar products, and leveraged a rule-based approach based on product descriptions when customer data was insufficient. Finally, I documented all imputation decisions and caveats, clearly communicating the limitations of the data to stakeholders. This allowed us to proceed with the forecasting model while being transparent about the potential inaccuracies.
15. Explain how you would use data visualization to communicate insights.
Data visualization is key to translating complex data into understandable insights. I would first identify the target audience and the specific question I'm trying to answer. Then, I'd select the most appropriate chart type (e.g., bar chart for comparisons, line chart for trends, scatter plot for relationships). For instance, to show sales trends over time, a line chart is much better than a pie chart. Key steps include simplifying the data, choosing clear labels and titles, and using color effectively to highlight key findings.
For example, If I am showing some data about website engagement using visualization, I might use a bar chart to compare the number of clicks on different call to action buttons, or the time spent on different sections of the website, which helps identify where improvements can be made to increase user engagement. Ultimately, the goal is to make the data accessible and actionable for the audience, supporting better decision-making.
16. How would you determine the sample size needed for a survey?
To determine the necessary sample size for a survey, you need to consider several factors. First, define the population size (N) if known. Then, decide on the desired margin of error (E), which represents the acceptable range of difference between the sample results and the true population value. Next, determine the confidence level (e.g., 95% or 99%), indicating the probability that the true population parameter falls within the margin of error. Finally, estimate the population variance or standard deviation (σ). If unknown, a conservative estimate of 0.5 for proportions can be used.
Once you have these values, you can use a sample size formula. A common formula for estimating sample size for proportions is: n = (Z^2 * p * (1-p)) / E^2 , where Z is the Z-score corresponding to the desired confidence level, p is the estimated population proportion, and E is the margin of error. For continuous data, a formula incorporating the population standard deviation is used. Online sample size calculators can also be used to simplify the calculation process. Keep in mind that the calculated sample size may need to be adjusted upwards to account for potential non-response or attrition.
17. Describe your experience with optimization techniques. How did you formulate the objective function and constraints?
I have experience with various optimization techniques, including linear programming, gradient descent, and genetic algorithms. My approach typically starts with clearly defining the problem and identifying the decision variables. Formulating the objective function involves mathematically expressing the goal, whether it's maximizing profit, minimizing cost, or achieving a specific performance target. Constraints are then defined to represent limitations on resources, regulations, or technical specifications.
For example, in a resource allocation problem, the objective function might be to maximize the total output, with constraints on the available budget, labor hours, and raw materials. I've used libraries like SciPy in Python to solve linear programming problems, where the objective function and constraints are linear. I also have experience implementing gradient descent for optimizing model parameters in machine learning projects, and I've explored genetic algorithms for more complex, non-linear optimization scenarios. When possible, I prefer to visualize the constraints to ensure the problem is well formulated.
18. Explain how you would use machine learning to predict customer behavior.
To predict customer behavior using machine learning, I would start by collecting relevant data, such as purchase history, demographics, browsing activity, and customer service interactions. This data would then be preprocessed and cleaned to handle missing values and inconsistencies. Next, I'd explore various machine learning models, including:
- Classification models (e.g., logistic regression, support vector machines, random forests) to predict customer churn or likelihood to purchase a specific product.
- Regression models (e.g., linear regression, gradient boosting) to predict the amount a customer will spend.
- Clustering algorithms (e.g., k-means) to segment customers based on behavior patterns.
- Recommendation systems (e.g., collaborative filtering, content-based filtering) to predict what products a customer might be interested in. I would evaluate model performance using appropriate metrics (e.g., accuracy, precision, recall, F1-score, AUC) and choose the best-performing model. I'd ensure the model is generalizable by validating it with held-out test data and monitoring its performance on live data, retraining the model as needed to maintain its accuracy over time. Furthermore, I would consider explainable AI techniques to understand the model's predictions and ensure fairness and transparency.
19. How would you assess the statistical significance of a result?
To assess the statistical significance of a result, I primarily use the p-value. The p-value represents the probability of observing results as extreme as, or more extreme than, the observed results, assuming the null hypothesis is true. A low p-value (typically less than a chosen significance level, α, commonly 0.05) indicates strong evidence against the null hypothesis, suggesting the result is statistically significant.
Besides the p-value, I also consider the effect size and the context of the research. A statistically significant result with a very small effect size might not be practically meaningful. Conversely, a result with a larger effect size might be important even if the p-value is slightly above the significance level, especially if the sample size is small or the study is exploratory. Confidence intervals are also helpful in assessing statistical significance, showing a range of plausible values for the true effect.
20. Describe a project where your quantitative skills led to a significant business impact. What were the key steps you took?
In a marketing analytics project, I used quantitative skills to optimize our ad spend. Our team suspected that budget allocation across different platforms was not optimal, but lacked data-driven insights. I first collected data from all marketing platforms (Google Ads, Facebook, etc.) and consolidated it into a single database. I then built a regression model to predict conversion rates based on spend across each platform, factoring in seasonality and geographic location. The model revealed significant diminishing returns on one platform and under-investment in another.
Based on these findings, I recommended shifting budget from the underperforming platform to the one with higher potential. This was implemented, and within one quarter, we saw a 15% increase in conversions with the same overall marketing budget. This directly translated into increased revenue and a more efficient marketing strategy. The key steps were: 1) Data Collection & Cleaning, 2) Model Building (Regression Analysis), 3) Insight Generation, and 4) Actionable Recommendations.
Quantitative Skills interview questions for experienced
1. Walk me through a time you used regression analysis to solve a business problem. What were the challenges and how did you overcome them?
In my previous role at a marketing firm, we faced the challenge of predicting campaign performance based on various factors like ad spend, target audience, and seasonality. We used multiple linear regression to model the relationship between these independent variables and key performance indicators (KPIs) such as click-through rate and conversion rate.
A significant challenge was multicollinearity among the predictors – for instance, ad spend across different platforms was highly correlated. To address this, we used techniques like Variance Inflation Factor (VIF) analysis to identify and remove highly correlated variables. We also applied regularization techniques, specifically ridge regression, to reduce the impact of multicollinearity. Another challenge was ensuring the model's assumptions were met; we performed residual analysis and transformations (e.g., log transformation) where necessary to address non-normality and heteroscedasticity. By systematically addressing these challenges, we built a robust model that improved campaign performance prediction by 15%.
2. Describe a situation where your quantitative analysis led to a significant cost saving or revenue increase for your company. Quantify the impact.
In my previous role at a marketing firm, we were struggling to optimize ad spend across different platforms. I conducted a regression analysis to model the relationship between ad spend on each platform (Google Ads, Facebook, etc.) and customer acquisition cost (CAC). The model revealed that we were significantly overspending on Facebook, where the marginal CAC was much higher compared to Google Ads. Based on this quantitative analysis, I recommended shifting 20% of our Facebook ad budget to Google Ads. This resulted in a 15% decrease in overall CAC within the next quarter, translating to approximately $50,000 in cost savings per month, or $600,000 annually. The reallocation strategy also led to a 10% increase in lead generation, boosting potential revenue.
3. Explain a complex statistical concept, like Bayesian inference, to someone with no statistical background.
Imagine you're trying to guess if it will rain tomorrow. Bayesian inference is like updating your belief about rain as you get new information. You start with a prior belief – maybe you think there's a 20% chance of rain based on the season. Then, you check the weather forecast, which says there's a storm coming (evidence). Bayesian inference helps you combine your prior belief (20% chance) with this new evidence (the forecast) to arrive at a more accurate, updated belief about the probability of rain tomorrow.
Essentially, it's a way of learning from data and refining your understanding. You start with an initial guess, incorporate new data, and end up with a better guess. The 'Bayes' part refers to Bayes' theorem, which is the mathematical formula that governs how these updates are calculated. It's used in many areas, from spam filtering (updating belief about an email being spam based on its content) to medical diagnosis (updating belief about a disease based on symptoms).
4. Tell me about a time you had to deal with missing or incomplete data. What techniques did you use to handle it, and how did you validate your approach?
In a previous role, I worked on a project involving customer churn prediction. The dataset had missing values in several columns, including customer demographics and usage patterns. To address this, I first analyzed the missing data to understand its nature (e.g., missing completely at random, missing at random, or missing not at random). For columns with a small percentage of missing values and missing completely at random, I used imputation techniques like mean or median imputation. For other cases, I used more sophisticated methods like K-Nearest Neighbors (KNN) imputation, predicting the missing values based on similar customers.
To validate my approach, I split the data into training and testing sets before imputation to avoid data leakage. After imputation, I compared the performance of a churn prediction model trained on the imputed data with a baseline model trained on the original data with missing values dropped. I also performed sensitivity analysis by comparing results with different imputation methods. Specifically, I compared the accuracy of models trained after using mean imputation vs KNN imputation. This helped ensure that my imputation strategy did not introduce significant bias and improved model performance.
5. Describe your experience with time series analysis. How have you used it to forecast future trends, and what metrics did you use to evaluate your forecasts?
I have experience with time series analysis using techniques like ARIMA, Exponential Smoothing, and Prophet. I've applied these models to forecast sales, website traffic, and stock prices. For instance, I used ARIMA to predict future electricity consumption based on historical data, incorporating seasonality and trend components.
To evaluate my forecasts, I primarily used metrics such as Mean Absolute Error (MAE), Mean Squared Error (MSE), Root Mean Squared Error (RMSE), and Mean Absolute Percentage Error (MAPE). I also used visual inspection by plotting the predicted values against the actual values to assess model fit and identify any systematic biases. Additionally, I've used Rolling Forecast Origin to validate forecast accuracy.
6. How do you approach identifying and mitigating potential biases in your quantitative models?
To identify and mitigate biases in quantitative models, I employ a multi-faceted approach. First, I carefully examine the data used to train the model, looking for potential sources of bias in data collection, sampling, or labeling. This includes visualizing data distributions and calculating summary statistics for different subgroups to uncover disparities. I also consider the historical context of the data and whether it reflects existing societal biases.
Mitigation strategies include techniques like re-sampling or weighting the data to balance representation, using fairness-aware algorithms or loss functions that penalize biased outcomes, and employing regularization techniques to prevent overfitting to biased patterns. Additionally, I conduct rigorous testing and validation, including evaluating model performance across different demographic groups and using fairness metrics to quantify and track bias reduction. Finally, model explainability techniques like SHAP values help understand feature importance and identify potential sources of bias within the model itself.
7. Explain how you would design and analyze an A/B test to optimize a website's conversion rate.
To design an A/B test for conversion rate optimization, I'd first define a clear hypothesis (e.g., changing the call-to-action button color to green will increase clicks). Then, I'd identify the key metric (conversion rate) and target audience. I'd randomly split the website traffic into two groups: a control group (A) seeing the original version and a treatment group (B) seeing the variation. I'd use a tool like Google Optimize or Optimizely to implement the test, ensuring statistically significant sample sizes and random assignment. The test would run for a predetermined duration, long enough to account for weekly variations in traffic.
To analyze the results, I'd use statistical significance tests (e.g., Chi-squared test or t-test) to determine if the difference in conversion rates between groups A and B is statistically significant. I'd also calculate the confidence interval to quantify the uncertainty. If the treatment group (B) shows a statistically significant and positive impact on the conversion rate, I'd consider deploying the changes to the entire website. If not, I'd analyze the data to understand why the variation didn't perform as expected and iterate on the hypothesis. I'd also monitor the conversion rate after deployment to ensure the improvement is sustained.
8. Discuss a time when you had to present complex quantitative findings to a non-technical audience. How did you ensure they understood the key takeaways?
In a previous role, I analyzed marketing campaign performance to identify areas for improvement. The stakeholders were primarily marketing managers without a strong statistical background. I needed to convey insights derived from regression analysis and A/B testing.
To ensure understanding, I avoided technical jargon and focused on the 'so what?' I translated findings into actionable recommendations using visuals like charts and graphs with clear, concise labels. For instance, instead of saying "the p-value was below 0.05," I would say "this result is statistically significant, meaning we are 95% confident that the new campaign led to a 15% increase in leads." I also prepared a one-page summary highlighting the key findings and recommendations in plain language, emphasizing the potential impact on their goals.
9. Describe a project where you used Monte Carlo simulation. What were the benefits of using this approach?
In a previous role, I used Monte Carlo simulation to model the potential outcomes of a new product launch. We had limited historical data and several uncertain variables such as market demand, production costs, and competitor response. By running thousands of simulations with randomly generated values for these variables based on estimated probability distributions, we were able to generate a distribution of possible profit scenarios.
The benefits of using Monte Carlo in this case were several. It allowed us to quantify the risk associated with the launch, identify the key drivers of profitability, and determine the optimal pricing strategy. We obtained a range of probable outcomes, not just a single-point estimate, which helped in risk management and decision making.
10. How do you stay up-to-date with the latest advancements in quantitative analysis and modeling techniques?
I stay updated through a combination of active learning and professional engagement. This includes regularly reading research papers on platforms like arXiv and SSRN, following industry blogs and publications from institutions like QuantNet and Wilmott, and taking online courses and specializations on platforms such as Coursera, edX, and Udacity, focusing on areas like machine learning, statistical modeling, and financial engineering.
I also attend industry conferences and webinars to learn from experts and network with peers. I actively participate in online forums and communities related to quantitative finance and data science, where I discuss current trends, new methodologies, and practical applications. Furthermore, I experiment with new techniques and tools in personal projects and simulations, which helps solidify my understanding and identify potential applications in real-world scenarios. For example, I might implement a new reinforcement learning algorithm for portfolio optimization in Python using libraries like TensorFlow or PyTorch.
11. Walk me through your process of validating a complex financial model.
Validating a complex financial model involves a multi-faceted approach. First, I'd focus on input validation, ensuring all data sources are accurate and consistent. This includes verifying data integrity checks and range limitations. Secondly, I'd meticulously review the model's logic and formulas, tracing calculations to ensure they align with financial principles and the intended purpose of the model. This involves cross-referencing key outputs with alternative calculation methods or established benchmarks. Finally, I'd conduct sensitivity analysis and scenario testing, stressing the model with varying assumptions to identify potential vulnerabilities and assess its robustness. I'd also ensure clear documentation exists for all aspects of the model.
12. Imagine you are tasked with optimizing the pricing strategy for a new product. What quantitative methods would you employ?
To optimize the pricing strategy, I'd use several quantitative methods. First, I'd conduct price sensitivity analysis using methods like Van Westendorp's Price Sensitivity Meter or Gabor-Granger pricing. These help understand the price range customers find acceptable. Regression analysis, using historical sales data (if available) or market data from similar products, can model the relationship between price and demand, considering factors like competitor pricing and marketing spend. I would also use conjoint analysis to understand how customers value different product features at different price points. This informs optimal bundling and pricing strategies.
Finally, I'd implement A/B testing with different price points in different market segments (if feasible) to directly measure the impact of price changes on sales, conversion rates, and overall revenue. The results of A/B testing would validate or refine the pricing models built earlier. These data-driven methods would allow me to arrive at an optimal pricing level that maximizes profit or market share, as appropriate.
13. Describe a situation where you had to make a critical decision based on conflicting quantitative data. How did you reconcile the discrepancies?
In a previous role, I was tasked with optimizing our marketing spend across different channels. We had two conflicting datasets: one from our internal attribution model, which heavily favored paid search, and another from an external marketing analytics platform that showed a higher ROI for social media. To reconcile this, I first investigated the methodologies behind each dataset. The internal model used a last-click attribution, while the external platform employed a more sophisticated multi-touch attribution model. Recognizing the inherent bias in last-click attribution, I then dove deeper into the raw data. I segmented the customer base, analyzing the customer journey for different cohorts. I found that while paid search often initiated the customer journey, social media played a crucial role in nurturing leads and driving conversions later in the funnel.
Based on this analysis, I recommended shifting a portion of the budget from paid search to social media, while also implementing a more robust multi-touch attribution model internally. This decision was supported by A/B testing, which demonstrated a significant increase in overall ROI. We also set up more comprehensive tracking to ensure consistency and reliability in future data analysis, moving away from a single, biased attribution model.
14. How do you ensure the accuracy and reliability of the data you use for your quantitative analyses?
To ensure accuracy and reliability, I follow a multi-faceted approach. First, I validate data sources by understanding their origin, collection methods, and any known biases. This involves checking for proper documentation and, where possible, comparing data against other reputable sources to identify discrepancies. Second, I perform rigorous data cleaning and preprocessing. This includes handling missing values (through imputation or removal, depending on the context), identifying and correcting outliers using statistical methods (e.g., IQR), and ensuring data consistency and format.
Finally, I continuously test and validate my results throughout the analysis. This includes sanity checks on intermediate calculations, comparing results to expected values or established benchmarks, and performing sensitivity analyses to assess the impact of different data cleaning or modeling choices on the final conclusions. For example, in a regression analysis, I would check for multicollinearity and heteroscedasticity, and validate the model's assumptions using residual plots and statistical tests. I also document every step clearly so that my process is reproducible and auditable.
15. Explain your experience with different statistical software packages (e.g., R, Python, SAS). What are the strengths and weaknesses of each?
I have experience with R and Python for statistical analysis. R excels in statistical modeling and visualization, offering a vast ecosystem of packages like ggplot2 and dplyr. Its primary strength lies in its statistical focus, making it ideal for complex statistical analyses and custom model development. However, R can be less efficient for large datasets and its syntax can be less intuitive for those unfamiliar with statistical programming. Python, on the other hand, is a general-purpose language with powerful libraries such as scikit-learn and statsmodels for statistical tasks. Python's strengths include its readability, scalability, and integration with other systems. It is excellent for machine learning, data manipulation, and deployment of statistical models. A weakness of Python is that its statistical ecosystem, while growing, isn't quite as comprehensive as R's for very specialized statistical methods.
16. How do you approach feature selection in a high-dimensional dataset?
When approaching feature selection in a high-dimensional dataset, I prioritize methods that can efficiently identify relevant features while mitigating overfitting. First, I'd consider techniques like univariate feature selection (e.g., selecting top features based on chi-squared tests or mutual information) for a quick initial screening. Then, I'd explore more sophisticated approaches such as L1 regularization (Lasso), which can perform feature selection during model training by shrinking the coefficients of irrelevant features to zero. Tree-based methods (e.g., Random Forest, Gradient Boosting) can also provide feature importance scores to guide selection.
Furthermore, recursive feature elimination (RFE) can be used to iteratively remove the least important features based on model performance. Cross-validation is crucial throughout the process to evaluate the selected feature subset's generalization ability and prevent overfitting. If computational resources allow, I would also consider methods based on information theory or dimensionality reduction techniques like PCA or t-SNE for feature extraction or selection. Finally, I would always combine these quantitative methods with domain knowledge to ensure the selected features are meaningful and interpretable.
17. Describe a time you identified and corrected an error in a previously published quantitative analysis.
In a prior role, I published a regression analysis predicting customer churn. After the report was circulated, a colleague pointed out a potential issue: I had inadvertently included future data in my training set, creating a data leakage problem. This meant the model was 'seeing' information it wouldn't have in a real-world prediction scenario, inflating its apparent accuracy.
To correct this, I rebuilt the dataset, ensuring that only data prior to the prediction period was used for training. I then re-ran the regression and updated the published report with the revised findings. The updated model had a lower, but more realistic, accuracy score. This experience taught me the importance of rigorous data validation and the potential pitfalls of inadvertently introducing bias through improper dataset preparation.
18. How do you determine the appropriate sample size for a statistical analysis?
Determining the appropriate sample size involves several factors. Primarily, you need to consider the desired level of statistical power (typically 80% or higher), the significance level (alpha, often 0.05), the expected effect size, and the variability in the population (standard deviation). A larger effect size requires a smaller sample size, while higher variability necessitates a larger sample.
Formulas or statistical software (like G*Power or Python libraries such as statsmodels) can be used to calculate the required sample size. For example, a power analysis can be done using statsmodels in Python to determine the sample size needed to detect a specific effect size with a certain power. Ultimately, balancing statistical rigor with practical constraints like cost and time is crucial.
19. Explain how you would use quantitative methods to assess the risk associated with a new investment opportunity.
To assess the risk of a new investment opportunity using quantitative methods, I would employ a combination of statistical analysis and financial modeling. I'd start by gathering historical data on similar investments, including returns, volatility (standard deviation), and correlations with other asset classes. Then, I'd calculate key risk metrics like Value at Risk (VaR) and Expected Shortfall (ES). Scenario analysis, using Monte Carlo simulations, would help project potential outcomes under various market conditions, quantifying the range of possible returns and associated probabilities. I would also use regression analysis to identify the key drivers of the investment's performance and assess their potential impact on risk.
Further, I would conduct sensitivity analysis to determine how the investment's profitability is affected by changes in key assumptions, such as discount rates, growth rates, or market volatility. The resulting data will be used to build a risk profile for the investment, enabling informed decisions about whether the potential return justifies the level of risk involved. Finally, I'd compare these quantitative metrics against pre-defined risk thresholds and conduct stress tests to evaluate the investment's resilience to extreme market events.
20. Describe your experience with data visualization tools. How do you use visualizations to communicate quantitative insights effectively?
I have experience using data visualization tools like Tableau, matplotlib, and Seaborn to create charts and graphs that communicate quantitative insights effectively. In Tableau, I've built interactive dashboards that allow users to explore data and identify trends. With matplotlib and Seaborn in Python, I've generated custom visualizations for specific analyses and reports, focusing on clarity and conciseness. For example, I've used matplotlib.pyplot.scatter() to show the relationship between two variables.
To effectively communicate quantitative insights, I prioritize choosing the right chart type for the data and the message. I use bar charts for comparing categories, line charts for showing trends over time, and scatter plots for illustrating correlations. I also pay close attention to labeling, annotations, and color schemes to ensure the visualizations are easy to understand and highlight key findings. I always consider the audience and tailor the visualization to their level of technical expertise.
21. What steps do you take to ensure your quantitative analyses are reproducible?
To ensure reproducibility in my quantitative analyses, I prioritize meticulous documentation and version control. Specifically, I document every step, including data sources, data cleaning procedures, transformations, and the rationale behind analytical choices. I use tools like README files and inline code comments to make the process transparent. Version control systems like Git are essential for tracking changes to code and data. I commit frequently with descriptive messages.
For coding-based analysis, I use scripting languages like Python or R and save all code in .py or .R files respectively. I prefer using virtual environments to manage package dependencies, ensuring that the analysis can be run with the exact same package versions used during development. Sharing the code, data, and environment specifications enables others (and myself in the future) to replicate the results.
22. Describe a time you used quantitative analysis to identify a previously unknown pattern or trend in a dataset.
During my previous role as a data analyst, I was tasked with analyzing customer churn data for a subscription-based service. The initial focus was on demographic factors and service usage. However, I decided to explore interaction logs between customers and our support teams. Using regression analysis, I identified a strong correlation between the number of support tickets opened in the 30 days prior to subscription renewal and churn rate. Surprisingly, the content and tone (analyzed via sentiment analysis) of these tickets proved to be more predictive than the issues themselves.
Further investigation revealed a trend: customers who opened multiple emotionally charged tickets, regardless of whether their issue was resolved, were significantly more likely to cancel their subscriptions. This previously unnoticed pattern prompted the implementation of a proactive intervention program targeting these high-risk customers, ultimately reducing churn by 15%.
23. How do you balance the need for accuracy with the need for speed in quantitative analysis?
Balancing accuracy and speed in quantitative analysis often involves trade-offs. Prioritize accuracy when decisions hinge on precise results (e.g., risk management, scientific research). Here, invest time in thorough data validation, robust statistical methods, and sensitivity analysis. When speed is critical (e.g., high-frequency trading, real-time reporting), consider simplifying models, using faster algorithms, and accepting a slightly higher error rate. Techniques such as algorithmic approximations or employing optimized code (e.g., using NumPy instead of loops in Python) can significantly improve speed.
Ultimately, the optimal balance depends on the specific application and acceptable risk. A pragmatic approach often involves starting with a faster, simpler model and iteratively improving accuracy as needed. Error analysis is crucial to quantify the impact of speed optimizations on accuracy. For example, one might choose a faster algorithm like gradient boosting over a slower, more accurate one like a deep neural network, especially during model exploration.
24. Tell me about a time you had to defend your quantitative findings against strong opposition.
During a project aimed at optimizing marketing spend, my analysis indicated a significant portion of our budget was ineffective on a specific channel. This contradicted the marketing director's intuition and previous reports, which suggested strong performance. To defend my findings, I presented a detailed breakdown of the data, including conversion rates, customer acquisition costs, and A/B test results that directly correlated the spend on that channel to poor performance. I also showed a cohort analysis demonstrating that customers acquired through that channel had significantly lower lifetime value.
25. Explain how you would use quantitative methods to improve the efficiency of a supply chain.
I would leverage quantitative methods across various aspects of the supply chain to improve efficiency. For demand forecasting, time series analysis (using moving averages, exponential smoothing, or ARIMA models) would allow us to predict future demand more accurately, reducing inventory costs and minimizing stockouts. Simulation modeling (e.g., Monte Carlo) can be used to optimize inventory levels at different stages, considering lead times and variability.
For transportation optimization, linear programming can minimize transportation costs by selecting the most efficient routes and modes of transport. Statistical process control (SPC) charts can monitor supplier performance (delivery times, quality) and identify areas for improvement. Regression analysis can find the relationship between different metrics and find areas to improve like warehousing, where you can use queuing theory for optimizing warehouse layout to minimize wait times. All data used for these analyses would be tracked and measured using key performance indicators (KPIs) such as inventory turnover rate, fill rate, and on-time delivery percentage. Tools like SQL, Python (with libraries like Pandas, NumPy, and SciPy), and statistical software (R, SAS) would be essential for data analysis and model building.
26. Describe a project where you had to build a predictive model from scratch. What were the key challenges, and how did you address them?
In a prior role, I built a churn prediction model for a subscription-based service. The primary goal was to identify customers at high risk of canceling their subscriptions, allowing for proactive intervention. A key challenge was dealing with imbalanced data, as the churn rate was relatively low. To address this, I employed techniques like oversampling the minority (churned) class and using cost-sensitive learning in the model training process. Feature engineering was also crucial. I created features based on user activity, subscription tenure, and interaction history. Another challenge was model interpretability. While optimizing for accuracy, it was important to understand why the model was predicting churn. I used techniques like feature importance analysis and SHAP values to gain insights into the model's decision-making process and communicate them to stakeholders.
27. How do you ensure the ethical use of quantitative methods, particularly in situations where the results could have a significant impact on individuals?
Ensuring ethical use of quantitative methods requires careful consideration of potential biases, fairness, and transparency. It starts with clearly defining the problem and objectives to avoid manipulating data to fit a predetermined narrative. We must scrutinize data sources for representativeness and address potential biases in data collection or preprocessing. Model evaluation should include fairness metrics beyond overall accuracy, assessing disparate impact across different groups.
Transparency is crucial; models and methodologies should be clearly documented and explainable. This involves using techniques like model cards to show how the model performs on specific groups, as well as doing sensitivity testing to look for unintended or unexpected model behaviors. I'm also a big proponent of independent audits or peer review to identify potential ethical concerns before deployment. Communication of findings must be carefully crafted to avoid misinterpretation or oversimplification.
Quantitative Skills MCQ
Question 1.
A company's profit increased from $250,000 in 2022 to $300,000 in 2023. What is the percentage increase in profit?
Options:
Question 2.
A company sells widgets for $25 each. The variable cost per widget is $15, and the company has fixed costs of $50,000 per year. What is the break-even point in units?
Options:
Question 3.
A company has the following inventory data:
- Beginning inventory: 100 units at $10/unit
- Purchase 1: 200 units at $12/unit
- Purchase 2: 150 units at $11/unit
Assuming the company sells 300 units, what is the weighted average cost of goods sold?
Options:
Question 4.
What is the future value of a $5,000 investment after 3 years, compounded annually at an interest rate of 6%?
Options:
Question 5.
What is the present value of an annuity that pays $500 per year for 5 years, given a discount rate of 6%?
Options:
Options:
Question 6.
A company has current assets of $500,000 and current liabilities of $250,000. What is the company's current ratio?
Options:
Options:
Question 7.
A company has a cost of goods sold (COGS) of $500,000 and an average inventory of $100,000. What is the inventory turnover ratio?
Options:
Options:
Question 8.
A company has sales of $500,000, a cost of goods sold of $300,000, operating expenses of $100,000, and interest expenses of $20,000. What is the company's net profit margin?
Options:
Options:
Question 9.
A company invests $500,000 in a project. The project generates a profit of $150,000. What is the Return on Investment (ROI)?
Options:
Options:
Question 10.
A company has total liabilities of $500,000 and total equity of $250,000. What is the company's debt-to-equity ratio?
Options:
Options:
Question 11.
A project requires an initial investment of $50,000 and is expected to generate annual cash inflows of $15,000 for the next 5 years. What is the payback period for this project?
Options:
Options:
Question 12.
A company sells 10,000 units of a product annually. The ordering cost is $25 per order, and the carrying cost is $5 per unit per year. What is the Economic Order Quantity (EOQ)?
Options:
Options:
Question 13.
A company purchased a machine for $50,000. The estimated salvage value is $5,000, and the estimated useful life is 10 years. Calculate the annual depreciation expense using the straight-line method.
Options:
Options:
Question 14.
A company has fixed costs of $500,000, a selling price per unit of $50, and variable costs per unit of $30. If the company sells 40,000 units, what is the degree of operating leverage (DOL)?
Options:
Options:
Question 15.
A company has annual credit sales of $1,000,000 and average accounts receivable of $200,000. What is the accounts receivable turnover ratio?
Options:
Options:
Question 16.
The price of a product decreases from $10 to $8, and the quantity demanded increases from 50 units to 75 units. Using the midpoint method, what is the price elasticity of demand for this product?
options:
Options:
Question 17.
What is the variance of the following dataset: 2, 4, 6, 8, 10?
Options:
Question 18.
What is the standard deviation of the following dataset: 2, 4, 6, 8, 10?
Options:
Question 19.
A company sells a product for $50 per unit. The variable cost per unit is $30, and the fixed costs are $100,000. What is the contribution margin ratio?
Options:
Question 20.
A company has the following financial data:
- Net Income: $500,000
- Depreciation Expense: $100,000
- Capital Expenditures: $150,000
- Change in Net Working Capital: $50,000
What is the company's Free Cash Flow (FCF)?
options:
Options:
Question 21.
A company has a net income of $500,000 and average total assets of $2,500,000. What is the company's Return on Assets (ROA)?
Options:
Options:
Question 22.
A company budgeted to purchase 100 units of raw material at a standard cost of $10 per unit. However, they actually purchased 110 units at $9 per unit. What is the price variance?
Options:
Question 23.
An investor holds a portfolio comprised of two assets. Asset A has a weight of 60% and a standard deviation of 15%. Asset B has a weight of 40% and a standard deviation of 20%. The correlation coefficient between the returns of Asset A and Asset B is 0.5. What is the variance of the portfolio?
Options:
Question 24.
What is the Net Present Value (NPV) of a project with the following cash flows, assuming a discount rate of 10%?
Year 0: -$100,000 Year 1: $30,000 Year 2: $40,000 Year 3: $50,000 Year 4: $20,000
Options:
Options:
Question 25.
A company has beginning inventory of $50,000, purchases of $250,000, and ending inventory of $30,000. What is the Cost of Goods Sold (COGS)?
Options:
Options:
Which Quantitative Skills skills should you evaluate during the interview phase?
Assessing every facet of a candidate's skills in a single interview is unrealistic. However, for quantitative roles, focusing on a few core competencies is key. These skills will provide a solid understanding of their aptitude and potential.
Numerical Reasoning
An assessment test with relevant MCQs can help you quickly filter candidates strong in Numerical Reasoning. Adaface's Numerical Reasoning Test evaluates a candidate's ability to interpret data and solve numerical problems.
To further assess this skill, ask targeted interview questions that probe their approach to numerical challenges. These questions will reveal how they think on their feet and apply numerical concepts.
A company's revenue increased by 15% in the first year and 10% in the second year. What is the overall percentage increase in revenue over the two years?
Look for candidates who can clearly articulate the steps they take to solve the problem. The ability to break down the problem and explain the methodology of arriving at the final answer is important.
Data Interpretation
Using an assessment test with relevant scenarios is an effective way to quickly filter candidates. Adaface's Data Interpretation test assesses the candidate's ability to derive meaningful insights from various data formats.
Ask questions that require the candidate to analyze a complex chart or dataset. This will help reveal how they identify trends and draw conclusions.
Present a graph showing sales data for different product lines over the past year. Ask the candidate: What insights can you derive from this graph, and what recommendations would you make based on these observations?
The candidate should be able to quickly identify key trends and anomalies in the data. They should also justify their recommendations with evidence from the presented data, showcasing critical thinking.
Business Math
A business math assessment test is one way to evaluate this skill. Check out Adaface's Business Math test to evaluate the skills of the candidates.
Present a scenario that requires mathematical calculations to solve. See how the candidate responds and how they arrive at the answer.
A company invests $50,000 in a marketing campaign and generates $75,000 in revenue. The cost of goods sold is $25,000. What is the ROI of the marketing campaign?
Candidates should be able to correctly calculate and explain ROI in a clear and concise manner. Look for candidates who can show their work step by step so you know how they arrived at the answer.
Hire Data-Driven Talent with Quantitative Skills Tests
Looking to hire individuals with strong quantitative skills? It's important to accurately assess these abilities to ensure a successful fit for roles requiring data-driven decision-making.
Skills tests offer an effective way to evaluate candidates' quantitative aptitudes. Consider using our Quantitative Aptitude Test or the Numerical Reasoning Test for accurate results.
Once you've used quantitative skills tests, you can easily shortlist top candidates and invite them for interviews to evaluate their practical application of these skills.
Ready to find your next quantitative superstar? Explore our Aptitude Tests or Sign up to get started.
Quantitative Aptitude Online Test
45 mins | 18 MCQs
The Quantitative Aptitude Online Test uses scenario-based MCQs to evaluate candidates on their numerical and mathematical skills. The test assesses candidates on their ability to solve problems related to arithmetic, algebra, geometry, trigonometry, and statistics, as well as their ability to interpret and analyze data. It also evaluates their familiarity with quantitative concepts and formulas, such as percentages, ratios, and probability, and their ability to apply them in real-world scenarios.
Try Quantitative Aptitude Online Test
Download Quantitative Skills interview questions template in multiple formats
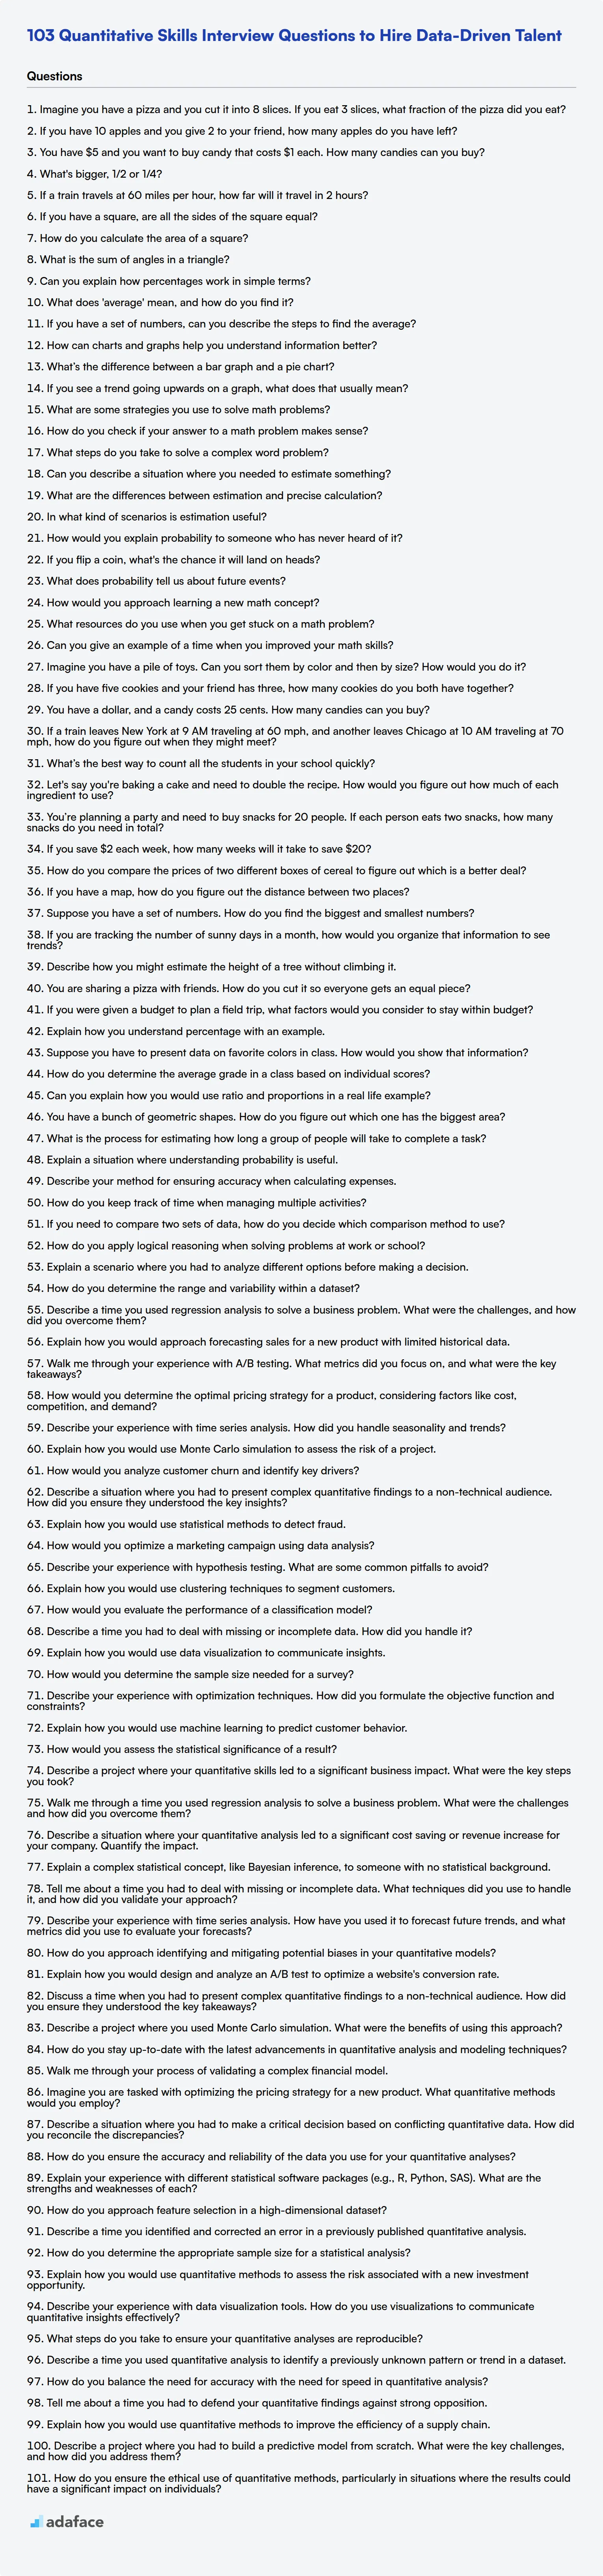
Quantitative Skills Interview Questions FAQs
What are quantitative skills?
Quantitative skills involve the ability to understand, interpret, and work with numerical data. They are important for data analysis, problem-solving, and decision-making.
Why are quantitative skills important in a job interview?
Assessing quantitative skills helps determine if a candidate can analyze data effectively, make informed decisions, and contribute to data-driven strategies within the organization.
What types of questions can assess quantitative skills?
Questions can range from basic math problems and data interpretation scenarios to complex statistical analysis and modeling tasks. The specific questions should align with the role's responsibilities.
How can I prepare for a quantitative skills interview?
Practice solving numerical problems, review statistical concepts, and familiarize yourself with data analysis tools. Be prepared to explain your thought process and reasoning behind your answers.
What should I look for in a candidate's response to quantitative questions?
Assess their ability to accurately interpret data, logically solve problems, and clearly communicate their approach. Also, consider their comfort level with relevant tools and techniques.
Are quantitative skills tests a good way to assess candidates?
Yes, quantitative skills tests offer a standardized and objective way to evaluate a candidate's abilities. They can help identify candidates with the necessary skills for data-related roles.
40 min skill tests.
No trick questions.
Accurate shortlisting.
We make it easy for you to find the best candidates in your pipeline with a 40 min skills test.
Try for freeRelated posts
Free resources

Join 1200+ companies in 80+ countries.
Try the most candidate friendly skills assessment tool today.

40 min tests.
No trick questions.
Accurate shortlisting.
No trick questions.
Accurate shortlisting.