
Basic PowerPoint interview questions
1. Can you explain what PowerPoint is used for, like explaining it to a kid?
2. What are slides in PowerPoint, and what kind of stuff goes on them?
3. Have you ever added pictures or shapes to a PowerPoint slide? How did you do it?
4. What’s your favorite thing about using PowerPoint?
5. If you wanted to make the words on your slide look different, how would you do that?
6. How would you add a new slide in PowerPoint?
7. What does 'formatting' mean in PowerPoint?
8. Have you ever seen a PowerPoint presentation? What did you like or not like about it?
9. Explain what slide layouts are and why they're useful?
10. What's the deal with saving a PowerPoint presentation? What happens if you don't?
11. How do you print a PowerPoint presentation?
12. What are transitions in PowerPoint, and can you give an example?
13. What are animations in PowerPoint, and how do they differ from transitions?
14. What is the 'Slide Master' in PowerPoint, and when would you use it?
15. What is the purpose of using headers and footers in a PowerPoint presentation?
16. How do you insert a chart or graph into a PowerPoint slide?
17. What are some best practices for making a PowerPoint presentation accessible to people with disabilities?
18. How do you record a narration for your PowerPoint presentation?
19. What are presenter notes in PowerPoint, and how can they be helpful during a presentation?
20. Describe the steps to embed a video into a PowerPoint slide?
21. What is the difference between 'design ideas' and manually designing a slide?
22. Can you explain what it means to 'align' objects on a slide, and why it's important?
23. What are the advantages of using templates in PowerPoint?
24. Explain how to insert and modify shapes in PowerPoint?
25. How do you check your presentation for spelling and grammar errors in PowerPoint?
Intermediate PowerPoint interview questions
1. Explain the difference between embedding a font and linking a font in PowerPoint, and when would you choose one over the other?
2. Describe a scenario where you would use the 'Morph' transition in PowerPoint, and how to set it up effectively.
3. How can you create a custom slide size in PowerPoint, and why might you need to do so?
4. What are the different types of Masters available in PowerPoint, and how do they influence the design of your presentation?
5. Explain how to use the 'Selection Pane' in PowerPoint, and what benefits it offers when working with complex slides.
6. Describe the process of creating and using custom color palettes in PowerPoint to maintain brand consistency.
7. How can you add and manage animations to individual objects on a slide, and what are some best practices for using animations effectively?
8. Explain how to record a narration for your PowerPoint presentation, and what equipment is needed for good audio quality.
9. Describe how to create interactive elements in PowerPoint, such as buttons that link to other slides or websites.
10. How do you use PowerPoint's 'Presenter View' effectively during a presentation, and what features does it offer?
11. What are the steps involved in creating a custom PowerPoint template, and how can it be used to ensure consistent branding?
12. Explain how to import data from Excel into a PowerPoint chart, and how to update the chart if the Excel data changes.
13. Describe how to use the 'Eyedropper' tool in PowerPoint, and why it's useful for design purposes.
14. How can you create a looping presentation in PowerPoint, and what are some use cases for this feature?
15. Explain how to reduce the file size of a PowerPoint presentation without significantly compromising the visual quality.
16. Describe how to add a watermark to every slide in a PowerPoint presentation, and why you might want to do so.
17. How do you use the 'Align' and 'Distribute' tools in PowerPoint to create a visually balanced slide layout?
18. What are the different options for saving a PowerPoint presentation as a video, and what are the pros and cons of each?
19. Explain how to use the 'Compress Pictures' feature in PowerPoint, and when it is most beneficial.
20. Describe how to create a photo album in PowerPoint, and how to customize its layout and design.
21. How can you insert and format audio and video files in PowerPoint, and what are the best practices for using multimedia effectively?
22. Explain how to use the 'Slide Master' to add a logo or other design element that appears on every slide.
23. Describe the process of creating custom shapes in PowerPoint using the 'Merge Shapes' tool.
24. How can you password protect a PowerPoint presentation, and what security considerations should you keep in mind?
25. Explain how to use the 'Action Settings' feature to create hyperlinks within your presentation. Describe different use cases.
Advanced PowerPoint interview questions
1. Explain how you would use PowerPoint's Morph transition to create a sense of smooth animation between slides.
2. How would you embed a live Excel chart within PowerPoint, ensuring that it updates automatically when the Excel data changes?
3. Describe your approach to designing a PowerPoint template that maintains brand consistency across multiple presentations.
4. What are some best practices for optimizing PowerPoint presentations for accessibility, particularly for users with visual impairments?
5. How would you use PowerPoint's Action Settings to create an interactive presentation with branching navigation?
6. Explain how to record and embed narration and video within a PowerPoint presentation for self-paced learning.
7. Describe your experience with using PowerPoint add-ins to enhance functionality and productivity.
8. How would you troubleshoot common PowerPoint issues such as corrupted files, slow performance, or compatibility problems?
9. Explain how you would prepare a PowerPoint presentation for delivery on different devices and screen sizes.
10. Describe your process for effectively using animations and transitions to enhance storytelling without distracting the audience.
11. How would you use PowerPoint's Presenter View to effectively manage your presentation and engage with the audience?
12. Explain your strategy for creating effective data visualizations in PowerPoint, considering clarity, accuracy, and impact.
13. Describe how you would use PowerPoint's Master Slide feature to create a consistent design and layout throughout a presentation.
14. How would you integrate multimedia elements like audio and video into a PowerPoint presentation to enhance engagement?
15. Explain how you would use PowerPoint's collaboration features to work with a team on a presentation.
16. Describe your approach to creating a visually appealing and engaging opening slide for a PowerPoint presentation.
17. How do you handle version control and track changes when collaborating on a PowerPoint presentation with multiple users?
18. Explain how you would optimize a PowerPoint presentation for online sharing and distribution, considering file size and security.
19. Describe your experience with using PowerPoint's chart animation features to tell a story with data over time.
20. How do you ensure that your PowerPoint presentations are compatible with different versions of PowerPoint and operating systems?
21. Explain how you would use PowerPoint's Selection Pane to manage and organize complex slide layouts with multiple objects.
22. Describe your approach to using SmartArt graphics to visually represent processes, relationships, and hierarchies in PowerPoint.
23. How would you create a custom PowerPoint theme with specific fonts, colors, and effects to align with a company's branding guidelines?
24. Explain how you would use PowerPoint's Merge Shapes feature to create custom graphics and illustrations.
25. Describe your strategy for creating a compelling call to action on the final slide of a PowerPoint presentation.
26. How would you use PowerPoint's Zoom feature to create a non-linear presentation with interactive navigation?
27. Explain the steps involved in setting up a PowerPoint presentation to run automatically as a kiosk or trade show display.
28. Describe how you would use PowerPoint Designer to quickly generate professional-looking slide layouts and design ideas.
Expert PowerPoint interview questions
1. Describe a complex PowerPoint animation you created and the steps you took to achieve it.
2. How do you ensure consistency in design and branding across multiple PowerPoint presentations?
3. Explain your process for creating interactive PowerPoint presentations with features like quizzes or simulations.
4. What are some advanced techniques you use to optimize PowerPoint files for size and performance?
5. How do you approach designing PowerPoint templates for different departments or purposes within an organization?
6. Describe a time you had to troubleshoot a complex PowerPoint issue. What was your approach and the solution?
7. What are your favorite PowerPoint add-ins and how do they enhance your presentation design process?
8. How do you use PowerPoint's master slides feature to create efficient and consistent presentations?
9. Explain how you would use PowerPoint to create a visually appealing and informative infographic.
10. What are some best practices for using multimedia elements (audio, video) effectively in PowerPoint?
11. Describe your experience with using VBA (Visual Basic for Applications) to automate tasks in PowerPoint.
12. How do you handle version control and collaboration when working on PowerPoint presentations with multiple people?
13. What are some creative ways you've used PowerPoint beyond traditional presentations, such as for training materials or interactive games?
14. How do you stay up-to-date with the latest PowerPoint features and design trends?
15. Explain your approach to designing PowerPoint presentations that are accessible to people with disabilities.
16. What are some common PowerPoint mistakes you see and how do you avoid them?
17. How do you use PowerPoint's Presenter View to deliver a more engaging and effective presentation?
18. Describe a time you had to adapt a PowerPoint presentation for different audiences or delivery methods (e.g., online vs. in-person).
19. What are your strategies for creating PowerPoint presentations that are both visually appealing and data-driven?
20. How familiar are you with using 3D models and animations within PowerPoint, and what are their ideal use cases?
21. Discuss your approach to integrating data from Excel or other sources into PowerPoint presentations dynamically.
22. Explain how you would use PowerPoint to create an interactive prototype for a website or application.
23. How do you optimize PowerPoint presentations for different screen sizes and resolutions?
24. Describe your experience with using PowerPoint's morph transition to create seamless animations and transitions.
25. What are your go-to resources for finding high-quality images, icons, and other visual assets for PowerPoint?
26. How do you use PowerPoint's recording features to create narrated presentations or training videos?
27. Explain how you would use PowerPoint to create a visually compelling annual report or investor presentation.
28. Can you describe a time when your PowerPoint skills significantly impacted a project or presentation outcome?

PowerPoint remains a staple in presentations and visual communication across industries, and knowing how to assess a candidate's skills is important. Ensuring a candidate understands slide layouts, animations, and multimedia integration is key.
This blog post provides a compilation of interview questions for various PowerPoint proficiency levels, from basic to expert, including multiple-choice questions. These questions are tailored to help you assess a candidate’s capabilities and practical knowledge.
By utilizing these questions, you can gauge a candidate’s readiness and skill, or better yet, use a Power BI online test before the interview to save valuable time.
Table of contents
Basic PowerPoint interview questions
Intermediate PowerPoint interview questions
Advanced PowerPoint interview questions
Expert PowerPoint interview questions
PowerPoint MCQ
Which PowerPoint skills should you evaluate during the interview phase?
3 Tips for Using PowerPoint Interview Questions
Hire Top PowerPoint Talent with Skills Tests
Download PowerPoint interview questions template in multiple formats
Basic PowerPoint interview questions
1. Can you explain what PowerPoint is used for, like explaining it to a kid?
Imagine you want to tell a story or show something cool to your friends or family. PowerPoint is like a digital poster board that helps you do that! You can put pictures, words, and even short videos on different slides (think of them like pages in a book).
PowerPoint helps you organize your ideas and make them look nice and easy to understand when you're sharing them with others. It's like using fancy crayons and stickers to make your story extra special and interesting!
2. What are slides in PowerPoint, and what kind of stuff goes on them?
In PowerPoint, slides are the individual pages of a presentation. They are the fundamental units used to convey information visually to an audience.
Slides typically contain various types of content, including:
- Text: Titles, headings, bullet points, and paragraphs.
- Images: Photographs, illustrations, and diagrams.
- Charts and Graphs: Visual representations of data.
- Shapes: Lines, arrows, boxes, and other graphical elements.
- Videos and Audio: Multimedia content to enhance engagement.
- Tables: Organized data in rows and columns.
- SmartArt: Pre-designed graphics for visualizing processes and relationships.
3. Have you ever added pictures or shapes to a PowerPoint slide? How did you do it?
Yes, I have added pictures and shapes to PowerPoint slides. To add a picture, I typically go to the "Insert" tab on the ribbon and click the "Pictures" button. Then, I can choose to insert a picture from a file on my computer or from online sources. Once inserted, I can resize, move, and format the picture using the options available in the "Picture Format" tab.
For shapes, I also use the "Insert" tab, but I click the "Shapes" button instead. This opens a dropdown menu with a variety of shapes to choose from, such as rectangles, circles, arrows, and lines. After selecting a shape, I click and drag on the slide to draw it. Similarly to pictures, shapes can be resized, moved, formatted (e.g., fill color, outline), and even have text added to them.
4. What’s your favorite thing about using PowerPoint?
My favorite thing about using PowerPoint is its versatility in visually communicating complex information. I appreciate how it allows me to structure ideas into a clear and engaging narrative using a combination of text, images, charts, and animations. It's a great tool for presenting information to diverse audiences.
Furthermore, I like the collaborative aspect. PowerPoint facilitates teamwork through easy sharing and editing, making it simple to gather feedback and refine presentations collectively. Features like slide masters and templates are also beneficial for maintaining consistency and efficiency across presentations.
5. If you wanted to make the words on your slide look different, how would you do that?
To make the words on a slide look different, I'd use several techniques. I could adjust the font type, size, and color. Applying italics or bolding specific words can also highlight key points. Additionally, changing the text alignment (left, center, right, justified) can drastically alter the appearance.
Furthermore, I might consider adding shadows or outlines to the text for emphasis. For a more subtle change, adjusting the letter spacing or line height can improve readability and visual appeal. Using different text effects offered by the presentation software, or incorporating creative formatting such as word art, can create a visually striking effect, but should be used sparingly to avoid distraction.
6. How would you add a new slide in PowerPoint?
There are several ways to add a new slide in PowerPoint:
- Using the Ribbon: Go to the "Home" tab, and in the "Slides" group, click the "New Slide" button. This usually adds a slide with a default layout.
- Right-Click: In the Slides pane (on the left), right-click between two slides or in the empty space and select "New Slide" from the context menu.
- Keyboard Shortcut: Use the keyboard shortcut
Ctrl + M(Windows) orCmd + Shift + N(Mac).
7. What does 'formatting' mean in PowerPoint?
In PowerPoint, 'formatting' refers to modifying the appearance of elements within a presentation to enhance its visual appeal and readability. This includes changing aspects like fonts, colors, sizes, alignment, and spacing of text, shapes, images, charts, and other objects.
Specifically, formatting covers aspects such as:
- Font formatting: Changing the font type, size, color, and style (bold, italic, underline). Changing character spacing.
- Paragraph formatting: Adjusting alignment (left, center, right, justified), indentation, line spacing, and adding bullet points or numbering.
- Object formatting: Modifying the fill color, outline color, outline style, and applying effects like shadows, reflections, and glows to shapes, images, and charts. Rotating, arranging and resizing the elements.
- Slide formatting: Changing background color, texture, or adding background images. Setting the slide size and orientation.
8. Have you ever seen a PowerPoint presentation? What did you like or not like about it?
Yes, I've seen many PowerPoint presentations. What I generally like is when a presentation is visually engaging and uses concise bullet points to highlight key information, avoiding large blocks of text. Good use of visuals, charts, and diagrams can really help to get the point across effectively.
What I dislike is when presentations are overloaded with text, read directly from the slides, or use distracting animations and transitions. Also, when the slides are cluttered, have poor color choices, or lack a clear structure, it makes it difficult to follow and understand the main message. Poorly sized fonts and distracting background images are also a pet peeve.
9. Explain what slide layouts are and why they're useful?
Slide layouts are pre-designed templates within presentation software (like PowerPoint or Google Slides) that define the arrangement of content on a slide. They control the position and formatting of placeholders for titles, text, images, videos, charts, and other objects.
Slide layouts are useful because they ensure consistency and efficiency in creating presentations. By using layouts, presenters can quickly add content without manually adjusting the position and size of elements on each slide. This saves time, reduces the risk of design inconsistencies, and contributes to a more professional and visually appealing presentation.
10. What's the deal with saving a PowerPoint presentation? What happens if you don't?
Saving a PowerPoint presentation stores your work persistently on a storage medium (hard drive, USB drive, cloud storage). This includes the slides, their content (text, images, videos), animations, transitions, and any other formatting you've applied. If you don't save, all your changes will be lost when you close the application or the computer shuts down unexpectedly. All of that work and effort evaporates.
Think of it like writing on a whiteboard. If you don't take a picture or transcribe it, the information is gone once the board is erased. Saving in PowerPoint is like taking that picture or writing everything down in a notebook to refer back to later.
11. How do you print a PowerPoint presentation?
To print a PowerPoint presentation, go to the 'File' menu and select 'Print'. This will open the print settings, where you can choose your printer, specify the number of copies, select which slides to print (all, current, or a custom range), and choose the print layout (e.g., full-page slides, notes pages, outline view, or handouts with multiple slides per page). Finally, click the 'Print' button.
12. What are transitions in PowerPoint, and can you give an example?
Transitions in PowerPoint are the visual effects that occur when moving from one slide to the next during a presentation. They add visual interest and help to create a smoother and more engaging viewing experience for the audience. Examples include:
- Fade: The current slide fades out while the next slide fades in.
- Wipe: The next slide wipes across the screen, covering the current slide.
- Push: The next slide pushes the current slide off the screen.
- Zoom: The current slide zooms in or out, transitioning to the next slide.
13. What are animations in PowerPoint, and how do they differ from transitions?
Animations in PowerPoint are effects applied to individual elements within a slide, such as text, images, or shapes. They control how these elements appear, move, or disappear on the slide. Animations add visual interest and emphasis to specific content. Transitions, on the other hand, are effects that occur between slides. They determine how one slide replaces another during a presentation. Transitions control the visual flow from one slide to the next, such as fades, wipes, or pushes. In short, animations affect objects on a slide, while transitions affect the movement between slides.
14. What is the 'Slide Master' in PowerPoint, and when would you use it?
The Slide Master in PowerPoint is the top slide in a hierarchy of slides that stores information about the theme and slide layouts of a presentation, including background colors, fonts, effects, placeholder sizes, and positioning. Changes made to the Slide Master affect all slides based on that master.
You would use the Slide Master when you want to make universal changes to the design and layout of your entire presentation. This ensures consistency across all slides and avoids having to manually adjust each slide individually. Examples include changing the font for all titles, adding a logo to every slide, or modifying the background color of the presentation.
15. What is the purpose of using headers and footers in a PowerPoint presentation?
Headers and footers in PowerPoint presentations serve to provide consistent information across all or selected slides. Their primary purpose is to enhance the professionalism, clarity, and organization of the presentation.
Specifically, headers and footers are useful for:
- Including the presentation title, date, or author's name.
- Displaying slide numbers for easy reference.
- Adding company logos or branding elements.
- Providing brief reminders of the presentation's topic or section.
- Adding confidentiality statements or disclaimers.
16. How do you insert a chart or graph into a PowerPoint slide?
To insert a chart or graph into a PowerPoint slide, you can typically use the following steps:
- Navigate to the slide where you want to insert the chart.
- Go to the "Insert" tab on the PowerPoint ribbon.
- Click on the "Chart" button. This will open a dialog box with various chart types available (e.g., Column, Line, Pie, Bar, etc.).
- Select the chart type that best suits your data and click "OK".
- A sample chart will appear on the slide, and an Excel spreadsheet will open. Enter your data into the Excel spreadsheet. The chart in PowerPoint will automatically update to reflect the data you enter.
- Close the Excel spreadsheet when you're done editing the data. You can then further customize the chart's appearance using the "Chart Design" and "Format" tabs that appear when the chart is selected.
Alternatively, if you already have a chart created in Excel or another program, you can copy and paste it into PowerPoint. You might have options to paste it as a picture, an embedded object, or a linked object. Choosing the appropriate paste option depends on whether you need to update the chart dynamically based on changes in the source data.
17. What are some best practices for making a PowerPoint presentation accessible to people with disabilities?
To make PowerPoint presentations accessible, consider these best practices. Use sufficient color contrast between text and background. A contrast ratio of at least 4.5:1 is recommended. Provide alternative text for all images and non-text elements. This helps screen readers describe the visual content to users. Use clear and concise language. Avoid jargon and complex sentence structures. Structure the presentation with headings, lists, and other semantic elements that screen readers can interpret.
Choose an accessible font like Arial or Verdana, and use a font size that is large enough to read easily (18pt or larger is recommended). Use the built-in slide layouts in PowerPoint instead of creating custom layouts, as these layouts are designed with accessibility in mind. Give each slide a unique title. Finally, check the presentation's accessibility using PowerPoint's built-in Accessibility Checker to identify and fix potential issues.
18. How do you record a narration for your PowerPoint presentation?
To record a narration in PowerPoint, navigate to the 'Insert' tab, then click on 'Audio' and select 'Record Audio'. This will open a recording dialog box. Click the record button to start narrating, and the stop button when finished. You can preview your recording, and then insert it onto the slide.
Alternatively, the 'Slide Show' tab provides the 'Record Slide Show' feature. You can choose to record from the current slide or from the beginning. This method allows you to record audio along with slide timings and animations, creating a more comprehensive presentation recording. Ensure your microphone is properly configured before starting.
19. What are presenter notes in PowerPoint, and how can they be helpful during a presentation?
Presenter notes in PowerPoint are notes that you can add to each slide to help you remember key talking points, statistics, or other relevant information during your presentation. These notes are not visible to the audience when you're presenting in slideshow mode; they are only visible to you on your presenter view.
Presenter notes are helpful because they can serve as a memory aid, preventing you from forgetting important details. They can also help you maintain a natural and engaging delivery by reducing your reliance on reading directly from the slides. Further, you can include cues for transitions, demonstrations, or audience interaction within the notes, contributing to a smoother and more effective presentation.
20. Describe the steps to embed a video into a PowerPoint slide?
To embed a video in PowerPoint, first navigate to the slide where you want to insert the video. Then, go to the 'Insert' tab on the PowerPoint ribbon. Click on 'Video' and choose either 'This Device...' to insert a video file from your computer or 'Online Videos...' to embed a video from a website like YouTube (if the version of PowerPoint supports it and the video allows embedding).
If selecting 'This Device...', browse to the video file and select it. If choosing 'Online Videos...', paste the embed code or URL of the video into the provided field. PowerPoint will then embed the video into your slide, allowing you to resize, move, and format it as needed.
21. What is the difference between 'design ideas' and manually designing a slide?
Design Ideas in presentation software (like PowerPoint) automatically generates slide design suggestions based on your content. It's a quick way to get visually appealing layouts without much effort. Manually designing a slide involves creating the layout, choosing fonts and colors, and positioning elements yourself, giving you full creative control.
Essentially, Design Ideas is an AI-powered suggestion tool, while manual design is a hands-on, customized approach. Design Ideas prioritizes speed and convenience, while manual design prioritizes precision and unique branding.
22. Can you explain what it means to 'align' objects on a slide, and why it's important?
Aligning objects on a slide refers to positioning them in a visually consistent and organized manner relative to each other or the slide itself. This involves ensuring objects are evenly spaced, lined up along their tops, bottoms, left sides, or centers. It might also include aligning objects to a grid or guide lines on the slide.
Alignment is important because it significantly improves the slide's clarity and visual appeal. Properly aligned objects make the slide easier to read and understand, conveying a sense of professionalism and order. Poor alignment can make a slide look cluttered, distracting, and unprofessional, hindering the audience's ability to focus on the content.
23. What are the advantages of using templates in PowerPoint?
Templates in PowerPoint offer several advantages. They ensure consistency in design and branding across all presentations, saving time and effort by providing pre-designed layouts, color schemes, and fonts. This consistency strengthens the overall professional image.
Using templates also simplifies the presentation creation process. With pre-defined placeholders for text and images, users can quickly populate slides with content without having to spend time on formatting and design. This leads to increased efficiency and allows presenters to focus on delivering their message effectively.
24. Explain how to insert and modify shapes in PowerPoint?
To insert shapes in PowerPoint, go to the 'Insert' tab, then click on 'Shapes' in the 'Illustrations' group. A dropdown menu will appear, offering various categories of shapes like lines, rectangles, basic shapes, etc. Select the desired shape and then click and drag on the slide to draw it.
To modify shapes, select the shape you want to change. You can then use the 'Shape Format' tab (which appears when a shape is selected) to alter its appearance. Common modifications include changing the fill color, outline color, line weight, shape effects (shadow, glow, reflection), and size/position. You can also right-click on the shape and use the context menu to access formatting options, or manually adjust its dimensions and position by dragging its handles.
25. How do you check your presentation for spelling and grammar errors in PowerPoint?
PowerPoint has a built-in spell checker that you can access by going to the 'Review' tab and clicking on 'Spelling'. This will scan your presentation for misspelled words and grammatical errors. You can choose to ignore, change, or add words to the dictionary.
Another option is to use the 'Editor' feature (also under the 'Review' tab) which provides more comprehensive grammar and style suggestions, similar to Microsoft Word's editor. You can also right-click on any word underlined in red (spelling error) or blue (grammar/style suggestion) and choose from the suggested corrections.
Intermediate PowerPoint interview questions
1. Explain the difference between embedding a font and linking a font in PowerPoint, and when would you choose one over the other?
Embedding a font in PowerPoint means including the font file within the presentation file itself. This ensures that the presentation will display correctly with the intended font on any computer, regardless of whether the font is installed on that machine. Linking a font, on the other hand, only stores a reference to the font file within the presentation. This means the presentation relies on the font being installed on the viewing computer to display correctly. If the font is missing, PowerPoint will substitute it, potentially changing the look and feel of the presentation.
You would choose to embed fonts when you need to guarantee the presentation's appearance across different computers, especially if you're using uncommon or custom fonts. This is useful for formal presentations, branding consistency, or sharing with external parties. Linking fonts is suitable when you know the target audience has the necessary fonts installed, perhaps within a corporate environment with standardized fonts, or when you want to reduce the file size of the presentation, as embedding fonts can significantly increase it. Be aware of licensing restrictions when embedding fonts, some fonts are restricted from embedding.
2. Describe a scenario where you would use the 'Morph' transition in PowerPoint, and how to set it up effectively.
I would use the 'Morph' transition in PowerPoint to create a dynamic and visually appealing flow between two similar slides. For instance, imagine presenting company growth. Slide 1 might show a small office building, while Slide 2 shows a much larger headquarters. Applying the 'Morph' transition would smoothly animate the change in building size and perhaps the addition of surrounding landscape, creating a sense of expansion and development.
To set it up effectively, first, duplicate the slide you want to transition from. Then, on the duplicated slide (the second slide), rearrange, resize, or modify the objects you want to morph. Finally, select the second slide and go to the 'Transitions' tab in PowerPoint. Choose 'Morph' from the transition options. To fine-tune the effect, use the 'Effect Options' to specify how the morphing should occur, such as by object, word, or character.
3. How can you create a custom slide size in PowerPoint, and why might you need to do so?
To create a custom slide size in PowerPoint, navigate to the "Design" tab, then click on "Slide Size" and select "Custom Slide Size...". In the dialog box, you can specify the width and height in inches or centimeters.
You might need a custom slide size for several reasons. Common reasons include creating slides for non-standard displays (like wide screens or projectors with unusual aspect ratios), preparing posters or banners that will be printed at a large size, or optimizing slides for specific video formats or online platforms with particular dimension requirements. Using a custom size ensures that your content is displayed correctly and avoids distortion or cropping.
4. What are the different types of Masters available in PowerPoint, and how do they influence the design of your presentation?
PowerPoint Masters control the overall design and layout of a presentation. There are three main types:
- Slide Master: This is the top-level master that controls the default styles, fonts, background, and placeholders for all slides in your presentation. Changes to the Slide Master cascade down to the other masters. It defines the global look and feel.
- Layout Masters: These are associated with the Slide Master and define the arrangement of content placeholders (text, images, charts, etc.) for specific slide types (e.g., Title Slide, Title and Content, Section Header). They control the specific arrangement of objects on a slide based on the theme.
- Handout Master: This controls how your presentation looks when printed as handouts. It defines the layout, header/footer, and number of slides per page for printed handouts.
The Masters influence the design by providing a centralized place to manage design elements. By modifying the Slide Master, you can change the font, color scheme, and background of all slides in your presentation at once. Layout Masters let you create custom slide layouts with specific placeholder arrangements, ensuring consistency and efficiency when creating new slides. The Handout Master ensures consistent branding on printed materials.
5. Explain how to use the 'Selection Pane' in PowerPoint, and what benefits it offers when working with complex slides.
The Selection Pane in PowerPoint allows you to manage the objects on your slides. You can open it by going to the 'Home' tab, then clicking 'Arrange' and selecting 'Selection Pane'. It displays a list of all objects on the current slide, enabling you to easily select, hide/show, and rename them. Renaming is particularly useful for keeping track of objects.
Using the Selection Pane offers several benefits when dealing with complex slides: it simplifies object selection, especially when objects are overlapping or hidden behind others. You can quickly find and select the desired element directly from the pane. Hiding objects is also useful for decluttering the view and focusing on specific elements during editing or presentation. Moreover, the ability to rename objects greatly improves organization and makes it easier to identify and manipulate them, particularly in slides with numerous elements.
6. Describe the process of creating and using custom color palettes in PowerPoint to maintain brand consistency.
To create a custom color palette in PowerPoint for brand consistency, go to the 'Design' tab and click the dropdown arrow in the 'Variants' group, then select 'Colors' > 'Customize Colors'. Here, you can define your brand colors by choosing specific RGB, HSL, or Hex values for each accent color, as well as for text and background. After creating your custom palette, save it with a descriptive name (e.g., "MyBrandPalette").
To use your custom palette, simply select it from the 'Colors' dropdown in the 'Variants' group on the 'Design' tab. Once selected, all PowerPoint elements, such as shapes, charts, and text, will automatically use colors from your custom palette, ensuring that all presentations adhere to your brand guidelines. Apply the theme to the slide master to apply to the whole presentation.
7. How can you add and manage animations to individual objects on a slide, and what are some best practices for using animations effectively?
To add and manage animations to individual objects on a slide (e.g., in PowerPoint or Google Slides), you typically use the animation pane or animation settings provided by the software. You can select an object, then choose an animation type (entrance, emphasis, exit, or motion path) and customize its properties like duration, delay, and trigger. Animations can be added to individual objects by selecting the target object and choosing the type of animation and its specific parameters. You can control the order of animations and timing between animation triggers.
Best practices for using animations effectively include: use animations sparingly to avoid distraction; ensure animations support, not detract from, the message; use entrance and exit animations subtly; maintain consistency in animation styles across slides; and test animations on different devices to ensure they render correctly. Overusing animations can also come across as unprofessional. They should guide the viewer's eye, not confuse them.
8. Explain how to record a narration for your PowerPoint presentation, and what equipment is needed for good audio quality.
To record narration in PowerPoint, navigate to the 'Insert' tab, then select 'Audio' -> 'Record Audio'. A small window will appear, allowing you to start and stop recording. Ensure your microphone is properly connected and configured in your system settings. After recording, you can insert the audio onto the desired slide and adjust playback options.
For good audio quality, a dedicated USB microphone is highly recommended over built-in laptop microphones. Position the microphone close to your mouth and away from any potential sources of noise like fans or air conditioners. Recording in a quiet environment and monitoring the audio levels during a test recording helps to avoid clipping or overly soft audio. Experiment with microphone placement to get the best sound.
9. Describe how to create interactive elements in PowerPoint, such as buttons that link to other slides or websites.
To create interactive elements in PowerPoint, you can use hyperlinks and actions. To link to another slide within the presentation, select the object (text, shape, image) you want to make interactive. Then, go to the 'Insert' tab and click on 'Link' (or 'Hyperlink'). In the 'Insert Hyperlink' dialog box, choose 'Place in This Document' and select the target slide.
For linking to a website, select the object, go to 'Insert' -> 'Link,' and enter the website URL in the 'Address' field. To add action buttons go to Insert -> Shapes and add one of the Action Button shapes. Upon adding the button, it will automatically prompt to add a hyperlink or an action. Use these features to add interactivity to PowerPoint.
10. How do you use PowerPoint's 'Presenter View' effectively during a presentation, and what features does it offer?
Presenter View in PowerPoint is a powerful tool for speakers. It allows you to see your notes, upcoming slides, and a timer while the audience only sees the current slide in presentation mode on the projector. To use it effectively, familiarize yourself with the layout beforehand. Place concise notes on each slide, focusing on key talking points rather than reading full sentences. Use the timer to manage your time effectively and stay on schedule.
Key features include:
- Notes: Display your speaker notes for each slide, visible only to you.
- Next Slide Preview: See the upcoming slide to prepare your transition.
- Timer: Track the elapsed time of your presentation.
- Clock: Displays the current time.
- Presentation Tools: Access tools like a pointer, pen, and highlighter to annotate slides in real-time.
- Slide Navigator: Quickly jump to any slide in the presentation.
- Zoom: Zoom in on specific parts of the slide for better visibility.You can start presenter view via the Slide Show tab and selecting 'Use Presenter View'.
11. What are the steps involved in creating a custom PowerPoint template, and how can it be used to ensure consistent branding?
Creating a custom PowerPoint template involves several steps to ensure consistent branding. First, define your brand elements: logos, colors, fonts, and imagery. Open PowerPoint and create a new presentation, then modify the Slide Master (View > Slide Master) to incorporate these brand elements. Customize slide layouts within the Slide Master to reflect typical content structures. Save the presentation as a PowerPoint Template (.potx) file.
To use the template, users select 'New' and then choose the custom template from the 'Custom' or 'Personal' tab. Because the brand elements and slide layouts are pre-defined in the .potx file, users are guided to create presentations that adhere to the established brand guidelines, ensuring consistency across all presentations.
12. Explain how to import data from Excel into a PowerPoint chart, and how to update the chart if the Excel data changes.
To import data from Excel into a PowerPoint chart, you can use the "Insert" tab, then select "Chart". Choose the desired chart type. Once the chart is created, right-click on it and select "Edit Data" or "Edit Data in Excel". This opens a linked Excel sheet. You can then either copy and paste your data from your existing Excel sheet into this linked sheet, or import your existing Excel sheet using 'Data' > 'Get & Transform Data' > 'From File' > 'From Excel Workbook'.
To update the chart when the Excel data changes, ensure the PowerPoint chart is linked to the Excel file. When you update the data in the linked Excel file and save it, the PowerPoint chart will automatically update. If it doesn't update automatically, right-click on the chart in PowerPoint and select "Refresh Data". Alternatively, you can check "Chart Design" > "Data" > "Refresh Data".
13. Describe how to use the 'Eyedropper' tool in PowerPoint, and why it's useful for design purposes.
The Eyedropper tool in PowerPoint allows you to sample a color from anywhere on your screen and apply it to another object within your presentation. To use it, select the object you want to change the color of (e.g., a shape, text box, or border). Then, go to the 'Shape Fill', 'Shape Outline', or 'Text Fill' option in the 'Format' tab. Select 'Eyedropper' from the dropdown menu. Your cursor will change to an eyedropper icon. Click on the color you want to sample, and PowerPoint will instantly apply that color to the selected object.
The Eyedropper is incredibly useful for maintaining a consistent color scheme and branding across your slides. It enables you to precisely match colors from images, logos, or other design elements, ensuring a professional and cohesive visual appearance. Instead of guessing and trying to find the right color using color palettes, you can directly sample and apply, saving time and improving accuracy.
14. How can you create a looping presentation in PowerPoint, and what are some use cases for this feature?
To create a looping presentation in PowerPoint, go to the 'Slide Show' tab, click on 'Set Up Slide Show'. In the 'Set Up Show' dialog box, under 'Show options', check the box labeled 'Loop continuously until Esc'. Then, click 'OK'. This will make the presentation automatically restart from the beginning after the last slide until you press the Esc key.
Some use cases include displaying information at a trade show booth, running a digital signage display in a waiting room, creating a self-running tutorial in a kiosk, or providing a looping background visual at an event.
15. Explain how to reduce the file size of a PowerPoint presentation without significantly compromising the visual quality.
To reduce PowerPoint file size without sacrificing too much visual quality, focus on image optimization. Compress images within PowerPoint using the built-in compression options (Picture Format > Compress Pictures). Choose a lower resolution, and delete cropped areas. Also, avoid embedding videos if possible; link to them instead. Convert complex vector graphics to images if they aren't frequently edited. Finally, remove any unused slide masters, layouts, or content.
Consider saving the presentation as a PPTX file instead of PPT, as PPTX uses better compression. When inserting images, use common formats like JPG or PNG, and ensure they are appropriately sized for their intended display resolution. For example, a 4K image displayed in a small portion of the slide can be significantly downsized without a noticeable visual impact. Audit embedded fonts; using only the necessary fonts and embedding only the characters used can drastically reduce file size.
16. Describe how to add a watermark to every slide in a PowerPoint presentation, and why you might want to do so.
To add a watermark to every slide in PowerPoint, you can use the Slide Master. Go to the 'View' tab and click 'Slide Master'. Insert a text box or image where you want the watermark to appear. Format it as desired (e.g., set transparency, color). PowerPoint automatically applies changes made in the Slide Master to every slide that uses the Master. Close the Master View when done.
Watermarks are useful for several reasons. They can protect your intellectual property by discouraging unauthorized use or distribution, identify draft versions, or reinforce branding by including a company logo. They help clearly define the status of the presentation.
17. How do you use the 'Align' and 'Distribute' tools in PowerPoint to create a visually balanced slide layout?
The 'Align' and 'Distribute' tools in PowerPoint are crucial for achieving a visually balanced slide layout. To use them effectively, first select the objects you want to align or distribute. Then, under the 'Arrange' group on the 'Home' or 'Format' tab, find the 'Align' dropdown.
Within 'Align', you can choose options like 'Align Top,' 'Align Middle,' 'Align Bottom,' 'Align Left,' 'Align Center,' or 'Align Right' to position objects relative to each other or the slide. For equal spacing, use the 'Distribute' options (e.g., 'Distribute Horizontally,' 'Distribute Vertically'). These tools help create a clean, professional look by ensuring elements are neatly arranged and spaced consistently.
18. What are the different options for saving a PowerPoint presentation as a video, and what are the pros and cons of each?
PowerPoint offers several options for saving presentations as videos, each with its own trade-offs. You can typically export as MP4 or WMV formats. MP4 is generally preferred for its wider compatibility across devices and platforms. WMV might offer slightly smaller file sizes in some cases but has limited compatibility.
- MP4: Pros: High compatibility, good quality, widely supported. Cons: Can result in larger file sizes compared to older formats.
- WMV: Pros: Potentially smaller file sizes. Cons: Limited compatibility, may not be supported on all devices, quality can be lower than MP4.
When saving, you can also adjust the video quality. Higher quality means larger file sizes. Consider your target audience and distribution method when choosing the export settings. For example, if the video will be streamed online, lower resolution might be acceptable. Also, consider including or excluding narrations and timings when saving.
19. Explain how to use the 'Compress Pictures' feature in PowerPoint, and when it is most beneficial.
The 'Compress Pictures' feature in PowerPoint reduces the file size of your presentation by optimizing the pictures within it. To use it, select a picture, go to the 'Picture Format' tab, and click 'Compress Pictures'. A dialog box will appear allowing you to choose the compression settings, such as target output resolution (e.g., email, web, print) and whether to apply the compression to all pictures in the presentation or just the selected one. You can also choose to delete cropped areas of pictures.
This feature is most beneficial when your PowerPoint presentation contains many high-resolution images and the overall file size is large. Compressing pictures makes the presentation easier to email, share online, and load faster. It's especially useful if the presentation will be viewed on screens with lower resolutions, as the high resolution isn't necessary, and simply increases file size unnecessarily.
20. Describe how to create a photo album in PowerPoint, and how to customize its layout and design.
To create a photo album in PowerPoint, go to the 'Insert' tab, then click the dropdown arrow on 'Photo Album' and select 'New Photo Album'. In the dialog box, click 'File/Disk' to insert pictures from your computer. You can adjust the picture order using the up/down arrows.
To customize the layout, choose a picture layout (e.g., 'Fit to Slide', '1 picture', '2 pictures') from the 'Picture Layout' dropdown. For design customizations, use the 'Frame Shape' dropdown to select a frame for your photos. You can also select a theme by clicking the 'Browse' button under the 'Theme' section to apply a coordinated color scheme and fonts. Click 'Create' to generate the photo album presentation. After creation, you can further customize the design using PowerPoint's standard formatting tools (e.g., slide backgrounds, transitions, animations).
21. How can you insert and format audio and video files in PowerPoint, and what are the best practices for using multimedia effectively?
To insert audio or video in PowerPoint, use the 'Insert' tab, then select 'Audio' or 'Video' to choose a file from your computer or an online source. Once inserted, you can format the media using the 'Playback' tab, adjusting volume, start/end times, looping, and playback options.
Best practices include: compressing media files for smaller presentation sizes, using universally compatible file formats (like MP4 for video and MP3 for audio), setting videos to play automatically or on click, using audio sparingly and only when necessary, ensuring good audio quality, and providing captions or transcripts for accessibility. Avoid autoplaying media at full volume, and always test your presentation on the intended projection system beforehand.
22. Explain how to use the 'Slide Master' to add a logo or other design element that appears on every slide.
To add a logo or design element to every slide using the Slide Master in PowerPoint, first go to the 'View' tab and click 'Slide Master'. This opens the Slide Master view where you can edit the master slides, which control the layout and design of your presentation. Insert the logo or design element onto the main Slide Master (the largest slide at the top) or onto specific layout masters if you only want it to appear on certain slide types. Position and size the element as desired.
Once the logo is placed on the Slide Master (or layout masters), it will automatically appear on all slides (or slide types) that use that master. To exit the Slide Master view and return to your normal presentation, click 'Close Master View' on the Slide Master tab. Now your logo will consistently appear across your slides.
23. Describe the process of creating custom shapes in PowerPoint using the 'Merge Shapes' tool.
The 'Merge Shapes' tool in PowerPoint allows you to combine multiple shapes into a single custom shape. First, insert the shapes you want to combine and position them as desired. Next, select all the shapes you want to merge. Then, under the 'Shape Format' tab, in the 'Insert Shapes' group, find the 'Merge Shapes' dropdown. Choose from options like 'Union' (combines all shapes into one), 'Combine' (removes overlapping areas), 'Fragment' (splits shapes at intersections), 'Intersect' (keeps only the overlapping area), or 'Subtract' (removes the front shape from the back shape). The resulting shape will be a single object that you can format like any other shape.
It's important to experiment with the different merge options to achieve the desired outcome. The order in which you select the shapes can affect the outcome of operations like 'Subtract'. Also, after performing a 'Fragment' operation, you will typically need to manually delete the unwanted shape parts.
24. How can you password protect a PowerPoint presentation, and what security considerations should you keep in mind?
To password protect a PowerPoint presentation, you can go to File > Info > Protect Presentation > Encrypt with Password. Then, enter and confirm your password. This encrypts the file, requiring the password to open or modify it. Consider the strength of your password; use a strong, unique password to avoid brute-force attacks. Keep the password in a secure location, as there's no way to recover the presentation if you lose it. Also, understand that this encryption isn't foolproof and skilled individuals might be able to bypass it, albeit with considerable effort and tools. Consider using additional security measures if you need exceptionally high-level protection such as Information Rights Management (IRM).
Keep in mind that this only protects against casual access. More sophisticated users might be able to use specialized tools to try and bypass the password protection. The effectiveness of the protection depends largely on the strength of the password itself. Also, anyone with the password has full access; there's no tiered access control with the standard PowerPoint password protection.
25. Explain how to use the 'Action Settings' feature to create hyperlinks within your presentation. Describe different use cases.
The 'Action Settings' feature (often found in presentation software like PowerPoint) allows you to create hyperlinks by assigning actions to objects or text within a slide. Select the object, go to 'Insert' then 'Action', and choose 'Hyperlink to'. You can then link to another slide in the presentation, a specific URL, another presentation file, or even send an email.
Common use cases include creating a table of contents with clickable links to different sections of the presentation, linking to external resources or websites for supplementary information, or creating interactive quizzes where clicking on an answer takes you to a 'correct' or 'incorrect' slide. You can also use it to create navigation buttons that allow users to jump to specific slides (e.g., "Back to Start" or "Next Slide") improving overall presentation flow.
Advanced PowerPoint interview questions
1. Explain how you would use PowerPoint's Morph transition to create a sense of smooth animation between slides.
PowerPoint's Morph transition smoothly animates changes between slides by analyzing objects and their attributes (position, size, color, text). To use it effectively, duplicate a slide. On the second slide, modify the objects you want to animate (move, resize, recolor, change text). Then, on the second slide, go to Transitions > Morph. PowerPoint will then automatically animate the changes between the first and second slide.
Key considerations include: ensuring objects you want to morph have similar names across slides (grouping similar objects can help), using the Selection Pane to rename objects for better morphing control, and being mindful of the type of changes you make, as complex or wildly different changes might not morph as expected and could appear jarring.
2. How would you embed a live Excel chart within PowerPoint, ensuring that it updates automatically when the Excel data changes?
To embed a live Excel chart in PowerPoint that automatically updates: Open the Excel file, select the chart, and copy it (Ctrl+C). In PowerPoint, go to the slide where you want to insert the chart. On the 'Home' tab, under 'Paste', select 'Paste Special'. In the Paste Special dialog box, choose 'Microsoft Excel Chart Object' and select the 'Paste link' option. This creates a linked object. When the data in the Excel file changes, the chart in PowerPoint will update automatically. Ensure that both the Excel and PowerPoint files are accessible in the same location or a shared drive for consistent updating.
3. Describe your approach to designing a PowerPoint template that maintains brand consistency across multiple presentations.
My approach to designing a PowerPoint template for brand consistency involves several key steps. First, I define the core brand elements: logo usage, color palettes (primary, secondary, and accent colors), typography (heading and body fonts), and image guidelines. Then, I create a master slide in PowerPoint that incorporates these elements. This includes setting up predefined layouts for title slides, content slides, section headers, and more, ensuring consistent placement of logos and proper use of colors and fonts. I would save this as a PowerPoint template (.potx file).
To ensure widespread adoption, I provide clear documentation outlining how to use the template effectively. This documentation includes examples of good and bad usage, specifies the intended purpose of each slide layout, and highlights how to incorporate approved imagery and graphics. Furthermore, I offer training sessions and support to address any questions and encourage proper implementation across different teams and presenters. Regular audits of presentations can help identify and correct any deviations from the template guidelines.
4. What are some best practices for optimizing PowerPoint presentations for accessibility, particularly for users with visual impairments?
To optimize PowerPoint presentations for accessibility, especially for users with visual impairments, several best practices should be followed. Use sufficient color contrast between text and background (at least 4.5:1 ratio) as a minimum. A contrast checker tool can ensure compliance. Provide alternative text for all images and visual elements; be descriptive and concise. Use meaningful hyperlink text, rather than just “click here”. Ensure a logical reading order by using PowerPoint's built-in features, such as the Selection Pane, and verifying the order in the accessibility checker. Use larger font sizes (18pt or greater) and sans-serif fonts like Arial or Helvetica for improved readability. Run the built-in Accessibility Checker to identify and fix potential issues, and use proper heading styles to structure the presentation.
Avoid relying solely on color to convey information, as colorblind users might miss it. Provide redundant cues such as text labels or patterns. Provide captions and transcripts for any audio or video content embedded in the presentation. Distribute the presentation in advance, allowing users to review it at their own pace with assistive technologies. Finally, when possible, include an agenda at the start of the presentation and verbally describe all visuals during the presentation.
5. How would you use PowerPoint's Action Settings to create an interactive presentation with branching navigation?
PowerPoint's Action Settings allow you to add interactivity by assigning actions to shapes, text, or images. To create branching navigation, select the object you want to make interactive, then go to Insert > Action (or Slide Show > Action Settings). Choose 'Hyperlink to' and select the destination slide (e.g., 'Next Slide,' 'Previous Slide,' 'Specific Slide...'). You can also trigger the action on mouse click or mouse over. Repeat this for other objects, linking them to different slides to create your branching structure. This creates a customized navigation experience beyond linear progression, based on audience interaction.
6. Explain how to record and embed narration and video within a PowerPoint presentation for self-paced learning.
To record and embed narration and video in PowerPoint for self-paced learning, first, navigate to the 'Insert' tab to embed a video file, or 'Record' tab to record directly through PowerPoint. For narration, go to the 'Slide Show' tab and select 'Record Slide Show'. You can choose to record from the current slide or the beginning. Ensure your microphone is configured correctly. While recording, narrate each slide and use the annotation tools as needed. To embed a webcam recording with the narration, enable the camera during the recording.
Once finished, save the presentation. The narration and video are embedded within the PowerPoint file. You can then distribute the presentation, and viewers can experience the content at their own pace. You can also export the PowerPoint to a video to ensure it is playable on a wider variety of devices.
7. Describe your experience with using PowerPoint add-ins to enhance functionality and productivity.
I've used PowerPoint add-ins to streamline presentation creation and delivery. Specifically, I worked with the 'think-cell' add-in to create complex charts and diagrams more efficiently than using PowerPoint's native tools. It significantly improved the visual clarity of data and reduced the time spent on formatting. I also used add-ins for polling and audience engagement during live presentations, allowing for real-time feedback and interactive Q&A sessions.
8. How would you troubleshoot common PowerPoint issues such as corrupted files, slow performance, or compatibility problems?
To troubleshoot corrupted PowerPoint files, I'd first try opening the file on a different computer or using PowerPoint's built-in repair tool (File > Open > Browse > select file > click the arrow next to Open > Open and Repair). If that fails, I'd attempt to recover the presentation from a temporary file or a backup if available. For slow performance, I'd check for large images or embedded videos and compress them. I would also disable unnecessary add-ins and ensure PowerPoint is updated to the latest version. I'd also check to see if the computer has the resources necessary for the powerpoint presentation.
For compatibility issues, I'd save the presentation in an older .ppt format for older PowerPoint versions or use the .pptx format for newer versions. I'd also advise the end users to download the powerpoint viewer, if they don't have powerpoint installed. I'd also verify fonts are supported on the recipient's system or embed the fonts in the presentation (File > Options > Save > Embed fonts in the file).
9. Explain how you would prepare a PowerPoint presentation for delivery on different devices and screen sizes.
To prepare a PowerPoint presentation for different devices and screen sizes, I'd start by using a widescreen aspect ratio (16:9) as it's more common and adapts better to various displays. I would also prioritize using high-resolution images and videos to ensure clarity on larger screens. When designing, I'd keep it simple and avoid overcrowding slides, ensuring text is large enough to be legible on smaller screens. Before presenting, I'd test the presentation on different devices (laptop, projector, tablet) to identify and resolve any formatting issues.
To make it more universally compatible, I would embed all fonts used within the presentation file to avoid font substitution issues on different devices. I would also save a copy of the presentation as a PDF to ensure the formatting remains consistent, especially when presenting on devices that might not have PowerPoint installed. Using cloud storage, like OneDrive or Google Slides, can provide cross-platform compatibility and make it easily accessible for various device types.
10. Describe your process for effectively using animations and transitions to enhance storytelling without distracting the audience.
When incorporating animations and transitions, my priority is to support the narrative, not overshadow it. I start by identifying key moments in the story where visual cues can amplify the emotional impact or clarify complex information. Then, I select animations and transitions that are subtle and purposeful. For instance, a slow fade-in might introduce a significant character, while a smooth slide transition could connect related ideas on screen. I always ensure the animation speed is appropriate for the content and the audience's viewing pace, preventing any jarring or overwhelming experiences.
I also adhere to consistency in animation styles throughout the storytelling experience. This creates a visual language that the audience can subconsciously understand, allowing them to focus on the story itself rather than decoding different animation techniques. Regularly testing the animations with different audiences helps identify potential distractions and refine the visual elements for maximum impact and clarity. It is a continuous refinement process.
11. How would you use PowerPoint's Presenter View to effectively manage your presentation and engage with the audience?
Presenter View in PowerPoint is a powerful tool for managing a presentation while keeping the audience focused on the slide show. I would primarily use it to see my notes, which are not visible to the audience. This helps me deliver a more natural and detailed explanation without constantly looking at the screen. I'd also use it to monitor the presentation timer, ensuring I stay within the allocated time.
Furthermore, I'd leverage the slide preview to anticipate upcoming content and prepare my explanations accordingly. The ability to see the next slide ensures a smoother transition and prevents me from being caught off guard. Finally, I would use the pen and highlighter tools in Presenter View to annotate slides in real-time (if needed), drawing attention to key points during the presentation without altering the original slide deck. These features help in maintaining a good flow and engaging the audience more effectively.
12. Explain your strategy for creating effective data visualizations in PowerPoint, considering clarity, accuracy, and impact.
My strategy for creating effective data visualizations in PowerPoint focuses on clarity, accuracy, and impact. I prioritize understanding the story the data needs to tell and the audience's understanding level. I choose the most appropriate chart type (bar, line, pie, etc.) based on the data and message, ensuring it avoids distortion or misrepresentation. I simplify the visual by removing unnecessary elements like gridlines or excessive labels, use clear and concise titles and axis labels, and maintain a consistent color palette to highlight key findings. The focus is to communicate the core message immediately.
To maximize impact, I use animation sparingly and strategically to guide the viewer's attention. I ensure the visual is large enough to be easily read on screen, even in a large room. I also consider the overall design of the slide, integrating the visualization seamlessly with the surrounding text and images. I always test the visualization with a sample audience to gather feedback and make necessary revisions before presenting.
13. Describe how you would use PowerPoint's Master Slide feature to create a consistent design and layout throughout a presentation.
To ensure a consistent design, I'd leverage PowerPoint's Master Slide feature. First, I'd access the Slide Master view (View > Slide Master). There, I'd modify the top-level Slide Master to define overall elements like fonts, background styles, and color schemes applicable to all slides. Then, I'd customize individual slide layouts below the main Master to tailor the placement of titles, text boxes, images, and footers to specific content types. Saving these changes ensures every new slide created will automatically inherit the defined design and layout, enforcing consistency. Further, any edits to the Master are immediately reflected in all linked slides.
14. How would you integrate multimedia elements like audio and video into a PowerPoint presentation to enhance engagement?
To integrate multimedia in PowerPoint, use the Insert tab, then choose either Audio or Video. For audio, you can select from a file or record directly. For video, options include files, online videos via URL, or embedding code. Optimize media for playback by compressing files and setting autoplay and loop options in the Playback tab after selection.
To enhance engagement, keep videos short and relevant. Use animations and triggers to control media playback based on audience interaction. Ensure good audio quality and clear visuals to avoid distractions. Also, consider accessibility by adding captions or transcripts.
15. Explain how you would use PowerPoint's collaboration features to work with a team on a presentation.
To collaborate on a PowerPoint presentation with a team, I would leverage several built-in features. First, I'd use the 'Share' button to invite collaborators via email, granting them either editing or viewing permissions. This allows multiple people to work on the presentation simultaneously or asynchronously. PowerPoint automatically saves changes to the cloud (OneDrive or SharePoint), ensuring everyone has the latest version.
Second, I would use the 'Comments' feature to provide feedback and discuss specific aspects of slides. I can tag team members in comments to draw their attention to particular issues. Finally, PowerPoint's 'Version History' allows us to track changes, revert to previous versions if needed, and compare different iterations to ensure no important content is lost during the collaborative process.
16. Describe your approach to creating a visually appealing and engaging opening slide for a PowerPoint presentation.
My approach to creating a visually appealing opening slide prioritizes clarity and engagement. I start by identifying the core message or theme of the presentation and choose a high-quality image or graphic that visually represents it. This image should be relevant, professional, and free of distractions. Then, I use a clear and concise title that immediately tells the audience what the presentation is about. The font should be easily readable and appropriately sized, with a color that complements the background. If appropriate, I also include my name and affiliation in a smaller font size.
To enhance engagement, I consider adding a subtle animation or visual effect to the title or image. However, I avoid anything too flashy or distracting. The goal is to create a professional and inviting first impression that piques the audience's interest and sets the tone for the rest of the presentation. I also ensure the slide adheres to any branding guidelines provided.
17. How do you handle version control and track changes when collaborating on a PowerPoint presentation with multiple users?
PowerPoint itself doesn't offer robust version control like Git for code. Typically, I rely on shared storage solutions like OneDrive, SharePoint, or Google Drive, which offer basic version history. I encourage collaborators to use descriptive filenames when saving new versions (e.g., Presentation_v2_JohnEdits.pptx). We also use the 'Track Changes' feature within PowerPoint (Review > Track Changes) to highlight specific modifications made by each user.
For more complex projects, I recommend breaking the presentation into smaller, modular sections. Each person can work on their section independently, and then we can merge them into a final master deck. Communicating clearly about who is working on which section and when is also key to prevent conflicts and overwrites.
18. Explain how you would optimize a PowerPoint presentation for online sharing and distribution, considering file size and security.
To optimize a PowerPoint presentation for online sharing, I'd focus on reducing the file size and enhancing security. File size can be minimized by compressing images (using PowerPoint's built-in options or external tools before inserting), embedding only necessary fonts, and avoiding unnecessary animations or videos. Save the presentation as a .pptx file, as it's generally smaller than .ppt. Use PowerPoint's 'Inspect Document' feature to remove any hidden data or personal information.
For security, I would consider password-protecting the presentation to restrict access or setting it to 'read-only' to prevent modifications. Additionally, converting the presentation to a PDF can limit editing capabilities and further reduce the file size, while also providing a more consistent viewing experience across different platforms. Using cloud storage options with sharing settings configured for specific individuals ensures only intended recipients can access the file. Watermarking can also deter unauthorized distribution.
19. Describe your experience with using PowerPoint's chart animation features to tell a story with data over time.
I've used PowerPoint's chart animation features to visually communicate data trends and changes over time. For example, when presenting sales data, I've used animations to reveal data points sequentially, highlighting growth periods or dips. This helps the audience focus on specific trends instead of being overwhelmed by the entire dataset at once. I've also used animations to emphasize comparisons between different data series, building the narrative step-by-step to make the insights more digestible and memorable. I find simple animations such as fades, wipes, and incremental additions most effective to avoid distracting from the data itself.
20. How do you ensure that your PowerPoint presentations are compatible with different versions of PowerPoint and operating systems?
To ensure PowerPoint presentation compatibility across different versions and operating systems, I primarily use the .pptx format, as it's the standard and most widely supported format for modern PowerPoint versions. I also avoid using very new or cutting-edge features that might not be available in older versions. When sharing, I might save a copy in the .ppt format for users with older software, although functionality may be reduced.
I test my presentations on different machines and operating systems when possible. Additionally, I embed fonts to prevent font substitution issues, and optimize images to reduce file size and ensure smooth playback on less powerful systems. Finally, I try to keep the design simple and avoid complex animations or transitions that could cause compatibility issues.
21. Explain how you would use PowerPoint's Selection Pane to manage and organize complex slide layouts with multiple objects.
The Selection Pane in PowerPoint is a powerful tool for managing complex slide layouts. I use it to easily select, rearrange, show/hide, and rename objects on a slide, especially when dealing with numerous overlapping or grouped elements. Instead of struggling to click on a specific object buried beneath others, I simply open the Selection Pane (usually found under the 'Arrange' dropdown in the 'Home' tab, or under the 'Format' tab when an object is selected), and select it from the list.
Furthermore, I can use the Selection Pane to change the stacking order of objects, bringing elements to the front or sending them to the back as needed. Renaming objects in the pane also helps with organization, making it easier to identify and manage specific elements. The ability to toggle the visibility of objects is particularly useful when experimenting with different layouts or preparing presentations with progressive reveals.
22. Describe your approach to using SmartArt graphics to visually represent processes, relationships, and hierarchies in PowerPoint.
When using SmartArt in PowerPoint, I start by identifying the process, relationship, or hierarchy I want to visualize. I then select a SmartArt graphic that best represents the data. PowerPoint offers a variety of layouts for lists, processes, cycles, hierarchies, relationships, matrices, pyramids, and pictures. The key is to choose the layout that effectively conveys the intended meaning. After inserting the SmartArt, I carefully input the data, focusing on clear and concise language within each shape. I often adjust the colors and fonts for visual appeal and consistency with the overall presentation theme. I also pay attention to the order and flow of information to ensure the SmartArt is easily understandable at a glance.
23. How would you create a custom PowerPoint theme with specific fonts, colors, and effects to align with a company's branding guidelines?
To create a custom PowerPoint theme aligning with company branding, I'd start by modifying the 'Theme Colors' and 'Theme Fonts' in the 'Design' tab. I'd input the exact hex codes for the company's primary and secondary colors, and select or upload the specified font families for headings and body text. For advanced customization, I'd delve into the 'Slide Master' view (View > Slide Master) to adjust slide layouts, placeholders, and background styles, ensuring consistency across presentations. Finally, I'd save the customized theme as a '.thmx' file for easy sharing and application across the organization.
To incorporate specific effects, such as subtle gradients or shadow styles, I'd use the formatting options within PowerPoint to apply these consistently to shapes and text boxes in the Slide Master. Additionally, I'd create a guidelines document alongside the theme file, detailing how to use the theme effectively and avoid deviations from the brand guidelines. For automated deployment or version control, the .thmx file could be managed through a shared network drive or a dedicated asset management system.
24. Explain how you would use PowerPoint's Merge Shapes feature to create custom graphics and illustrations.
PowerPoint's Merge Shapes feature is a powerful tool for creating custom graphics by combining multiple shapes in various ways. To use it, I would first insert the shapes I want to combine. Then, I'd select all the shapes, go to the 'Shape Format' tab, and choose 'Merge Shapes.' From there, I can select one of the options like 'Union' to combine them into a single shape, 'Combine' to merge them but remove overlapping parts, 'Fragment' to break them into separate pieces based on overlaps, 'Intersect' to keep only the overlapping area, or 'Subtract' to remove the front shape from the back shape.
For example, if I wanted to create a speech bubble with a custom tail, I could draw a rounded rectangle and a triangle. Selecting both, I would then use the 'Union' merge shape option to combine them into one graphic. By using different combinations and shape manipulations, the merge shape tool allows for creating complex and customized illustrations directly within PowerPoint.
25. Describe your strategy for creating a compelling call to action on the final slide of a PowerPoint presentation.
My strategy focuses on clarity, relevance, and urgency. The call to action (CTA) must be incredibly clear: tell the audience exactly what you want them to do. Use action verbs and simple language. It should be directly relevant to the presentation's content and the audience's needs, highlighting the benefit they'll receive by taking the action. Finally, create a sense of urgency, implying that there's a reason to act now rather than later; this can be achieved with deadlines, limited-time offers, or by emphasizing the potential consequences of inaction. The CTA should be prominently displayed and visually distinct on the final slide.
Examples of effective CTAs include: 'Visit our website to download the free ebook,' 'Contact us today for a personalized demo,' or 'Sign up for the workshop before seats fill up!'
26. How would you use PowerPoint's Zoom feature to create a non-linear presentation with interactive navigation?
PowerPoint's Zoom feature is perfect for non-linear presentations. First, create your slides, each covering a specific topic or section. Then, create a 'summary' or 'navigation' slide. On this slide, use the Zoom feature (Insert > Zoom) to insert Zoom links to the key slides or sections. The 'Summary Zoom' is particularly useful as it automatically generates zoom links to all your slides. During the presentation, instead of advancing linearly, you can click on these Zoom links to jump directly to the desired section. After viewing a section, clicking the zoom area again returns you to the navigation slide, allowing the audience to choose the next topic, creating an interactive, non-linear flow. You can also use 'Section Zoom' to group relevant slides into sections, providing a higher level of navigation.
27. Explain the steps involved in setting up a PowerPoint presentation to run automatically as a kiosk or trade show display.
To set up a PowerPoint presentation for a kiosk or trade show display to run automatically, first, design your presentation, focusing on clear, concise visuals and minimal text. Next, configure PowerPoint's settings. Go to 'Slide Show' tab and click on 'Set Up Slide Show'. Choose 'Browsed at a kiosk (full screen)' under 'Show type'. Set 'Show options' to loop continuously until 'Esc'. To advance slides automatically, use transitions. Set 'Advance slide' to 'Automatically after' and specify the duration for each slide. You may also remove the navigation buttons on the screen by hiding the mouse pointer. Then test thoroughly.
28. Describe how you would use PowerPoint Designer to quickly generate professional-looking slide layouts and design ideas.
PowerPoint Designer automatically generates design ideas for slides. To use it, I would insert content (text and/or images) onto a slide. PowerPoint Designer then analyzes the content and suggests various professional-looking layout options and design styles in the Design Ideas pane. I would simply browse the suggestions and choose the design that best suits my needs and the overall presentation's theme. I can also refresh the design ideas by modifying the slide content or by clicking the 'Design Ideas' button if the pane isn't automatically displayed.
Designer helps me quickly create visually appealing slides without needing advanced design skills. It provides diverse layout options, ensures visual consistency, and saves time by automating the design process. Furthermore, it's adaptive; modifications to the slide prompt new and relevant design ideas, keeping the design process dynamic and efficient.
Expert PowerPoint interview questions
1. Describe a complex PowerPoint animation you created and the steps you took to achieve it.
I once created a PowerPoint animation to visually represent a data pipeline. It involved multiple stages of data transformation and loading, each represented by a distinct shape. To simulate the flow, I used motion path animations to move data icons (small circles) sequentially through the pipeline. Each stage's shape would also subtly change color upon receiving a data icon, providing visual feedback. I combined several animation types: entrance animations (fade-in for initial shapes), motion paths (for data flow), emphasis animations (color changes), and exit animations (fade-out when complete). The timing was crucial to synchronize the movement of the data icons with the stage color changes. I used the Animation Pane extensively to adjust the timing and sequencing of each animation effect, often tweaking the delay and duration values to achieve a smooth, realistic flow. I grouped multiple shapes to animate them together as a single unit at some points to give a cleaner more cohesive look.
2. How do you ensure consistency in design and branding across multiple PowerPoint presentations?
To ensure consistency in design and branding across multiple PowerPoint presentations, I would primarily use a master template. This template would include the correct color palette, fonts, logo placement, and slide layouts that adhere to the established brand guidelines. All new presentations would then be created based on this master template.
Furthermore, I would maintain a style guide document which outlines the specifications mentioned in the master template to ensure all team members involved in creating presentations adhere to the same brand standards. Regular audits of existing presentations can also help identify and correct any inconsistencies that may arise.
3. Explain your process for creating interactive PowerPoint presentations with features like quizzes or simulations.
My process involves leveraging PowerPoint's built-in features and sometimes integrating external tools. I start by outlining the learning objectives and mapping out the interactive elements, like quizzes or simulations, that will reinforce those objectives. Within PowerPoint, I use features such as hyperlinks, action buttons, and triggers to create navigation and interactivity. For quizzes, I might use branching scenarios linked to different slides based on answer choices. Animations and transitions are carefully added to enhance user experience without being distracting. Occasionally, I embed web-based quizzes (using iframes via add-ins) or simulations created with tools like Articulate Storyline for more advanced interactivity. After building the presentation, I test it thoroughly to ensure all interactive elements function as expected and gather feedback for iterative improvements.
4. What are some advanced techniques you use to optimize PowerPoint files for size and performance?
To optimize PowerPoint files, I use several techniques. Firstly, I compress images aggressively. PowerPoint's built-in compression tool is a good starting point, but tools like TinyPNG can further reduce file size without significant quality loss. I also ensure images are sized appropriately for their display resolution; oversized images bloat the file unnecessarily. Secondly, I embed fonts sparingly and only when absolutely necessary, as this significantly increases file size. If possible, I use standard fonts that are likely already installed on the presentation machine. Thirdly, I avoid embedding unnecessary media or complex animations. Linked media files can reduce file size, but require the linked files to be accessible during presentation. Finally, I remove hidden data and unused layouts using PowerPoint's document inspector to eliminate unnecessary baggage.
5. How do you approach designing PowerPoint templates for different departments or purposes within an organization?
When designing PowerPoint templates, I start by understanding the specific needs of each department or purpose. This involves collaborating with stakeholders to define their communication goals, target audience, and branding guidelines. I then create templates that align with these requirements, ensuring consistent visual elements and branding across all presentations.
Specifically, this often means creating a master template with customizable slide layouts, pre-defined color palettes and fonts, and placeholders for logos and content. Each department might have its own variation of the master template, tailored to their specific content needs and branding variations while still remaining within organizational guidelines. Considerations include the use of relevant imagery, charts appropriate for data representation, and maintaining accessibility standards for all users.
6. Describe a time you had to troubleshoot a complex PowerPoint issue. What was your approach and the solution?
In a previous role, I was tasked with presenting quarterly results to the executive team. The PowerPoint presentation, built by another team, contained several embedded Excel charts linked to a shared network drive. During rehearsal, some charts displayed 'Update not available' errors or showed incorrect data, making the deck unreliable.
My approach involved several steps. First, I verified the network connection and confirmed access to the shared drive. Next, I broke the links for problematic charts using 'File > Info > Edit Links to Files', and then relinked them, ensuring the correct file path was selected. For charts still displaying errors, I copied the underlying Excel data, recreated the charts directly within PowerPoint, and formatted them to match the original style. Finally, I meticulously reviewed the entire presentation to guarantee accuracy and visual consistency before the final presentation.
7. What are your favorite PowerPoint add-ins and how do they enhance your presentation design process?
While my PowerPoint usage isn't heavily reliant on add-ins, I find think-cell and PowerPoint Labs particularly helpful. think-cell streamlines the creation of complex charts and diagrams, ensuring consistency and a professional look. It saves significant time and reduces manual adjustments. PowerPoint Labs offers a suite of tools, including features for animation, slide management, and resource library management, which enhance the overall design workflow.
I also sometimes use the Pexels add-in for easy access to high-quality, royalty-free stock photos directly within PowerPoint, which improves the visual appeal of my presentations. While I don't use it often, the Office Timeline add-in is useful when building roadmaps and project timelines, providing a clear and visually engaging way to present project progress. These add-ins primarily improve efficiency and visual impact, leading to more effective presentations.
8. How do you use PowerPoint's master slides feature to create efficient and consistent presentations?
Master slides in PowerPoint ensure consistency and efficiency. By modifying the master slides (View > Master Views > Slide Master), you can define the overall design, including fonts, colors, logos, and placement of elements, across all or specific slide layouts. Changes made to the master are automatically applied to all slides using that layout, reducing redundant formatting.
To effectively use master slides: 1) Establish a consistent visual identity, 2) Create custom layouts for different content types (e.g., title, content, section header), 3) Use placeholders to define content regions, and 4) Avoid direct formatting on individual slides; rely on the master for visual consistency.
9. Explain how you would use PowerPoint to create a visually appealing and informative infographic.
To create a visually appealing infographic in PowerPoint, I'd start by planning the content and flow, sketching a basic layout beforehand. I would then select a visually consistent color palette and font scheme. Using PowerPoint's built-in shapes, icons, and charts I will create supporting graphics, ensuring data visualizations are clear and easy to understand. I will also make sure to balance text and visuals, and using whitespace to make the infographic easy to scan.
Further enhance the infographic by applying subtle animations or transitions to guide the viewer's eye. When finished I'd get feedback to ensure clarity and visual appeal before exporting it as a high-resolution image or PDF for sharing.
10. What are some best practices for using multimedia elements (audio, video) effectively in PowerPoint?
When including audio/video in PowerPoint, prioritize user experience. Keep files small for quick loading, using optimized formats like MP4 for video and MP3 for audio. Embed videos instead of linking to prevent broken presentations when files move. Start videos automatically or on click, depending on the presentation flow, and provide clear playback controls. Ensure audio is balanced and not distracting, using it purposefully to enhance key points. Use captions/subtitles for accessibility and when audio might not be audible (e.g., noisy environments).
11. Describe your experience with using VBA (Visual Basic for Applications) to automate tasks in PowerPoint.
I've used VBA extensively within PowerPoint to automate repetitive tasks and create custom presentations. For example, I developed macros to automatically format slides based on pre-defined templates, ensuring consistency across large decks. This included standardizing font sizes, applying corporate color schemes, and positioning logos automatically. Another use case was generating slide content dynamically from external data sources like Excel spreadsheets; this saved a lot of time and eliminated manual data entry errors. I'm familiar with the PowerPoint object model and can manipulate shapes, text boxes, charts, and other slide elements programmatically.
Specifically, I've used VBA to:
- Automate the creation of agenda slides based on slide titles.
- Batch-update chart data from Excel.
- Add consistent footers to all slides.
- Create custom interactive elements within presentations. An example of code I might use to change the background colour of a slide is:
Sub ChangeBackground()
  With ActivePresentation.Slides(1).Background.Fill
      .ForeColor.RGB = RGB(255, 0, 0) 'Set to red
      .Type = msoFillSolid
  End With
End Sub
12. How do you handle version control and collaboration when working on PowerPoint presentations with multiple people?
When collaborating on PowerPoint presentations, I primarily use shared cloud storage services like OneDrive, Google Drive, or Dropbox. These platforms offer version history, allowing you to revert to previous versions if needed. I also encourage team members to clearly communicate changes and updates.
For more complex projects, consider breaking the presentation into sections and assigning each section to a different person. Establish clear naming conventions and a central location for all files. Regularly merge individual contributions into a master presentation, resolving conflicts promptly.
13. What are some creative ways you've used PowerPoint beyond traditional presentations, such as for training materials or interactive games?
Beyond presentations, I've utilized PowerPoint for various purposes. For training, I've created interactive modules with quizzes using hyperlinks and custom animations to guide users through different scenarios and assess their understanding. The non-linear navigation allows learners to explore topics at their own pace.
I've also developed simple interactive games using triggers and animations. For instance, a "choose your own adventure" style game can be built using hyperlinks to different slides based on user choices, making learning engaging. Also, created drag-and-drop style interactive exercise using animation pane. The ability to export as video also helps in creating animated explainers for concepts.
14. How do you stay up-to-date with the latest PowerPoint features and design trends?
I stay updated with PowerPoint features and design trends through a combination of online resources and practical application. I regularly read blogs and articles from Microsoft and other reputable sources in the presentation design community. I also follow industry experts on social media (LinkedIn, Twitter, etc.) to see examples of current work and discussions about new features.
Furthermore, I make it a point to explore new PowerPoint versions as soon as they're released, experimenting with the tools and templates. Taking online courses, attending webinars, and participating in design communities also helps me to learn new techniques and best practices. Finally, I incorporate what I learn into my own projects and presentations, which solidifies my understanding and keeps my skills sharp.
15. Explain your approach to designing PowerPoint presentations that are accessible to people with disabilities.
When designing PowerPoint presentations for accessibility, I prioritize several key elements. First, I ensure sufficient color contrast between text and background, using tools to verify compliance with WCAG guidelines. I also use a clear, sans-serif font like Arial or Calibri, and a font size of at least 18 points for body text. Structure is crucial, so I leverage PowerPoint's built-in heading styles to create a logical reading order for screen readers. Alt text is added to all images and non-text elements, providing concise descriptions of their purpose and content.
Further, I avoid using animations or transitions that could trigger seizures or distract users. Complex data is presented in multiple formats (e.g., charts with data tables). Hyperlinks are descriptive and meaningful, avoiding generic phrases like "click here." Finally, I run the PowerPoint Accessibility Checker to identify and resolve any remaining issues before sharing the presentation. Regular testing with assistive technologies helps to validate effectiveness.
16. What are some common PowerPoint mistakes you see and how do you avoid them?
Common PowerPoint mistakes include text-heavy slides, which make it difficult for the audience to follow along and can lead to them reading instead of listening. To avoid this, use concise bullet points and visuals. Another frequent issue is poor visual design - distracting animations, inconsistent fonts, and low-quality images. Stick to a simple, consistent template and use high-resolution visuals. Also, avoid reading directly from the slides. Use them as prompts and elaborate on the points with your own words, maintain eye contact and engage with your audience.
17. How do you use PowerPoint's Presenter View to deliver a more engaging and effective presentation?
Presenter View in PowerPoint is a valuable tool for delivering engaging presentations. It displays your slides on the main screen for the audience, while you see a different view on your monitor containing notes, upcoming slides, and a timer. Use your notes effectively. Avoid reading them verbatim; instead, use them as cues to remind you of key points, statistics, or stories you want to share. This keeps your delivery natural and conversational.
Additionally, Presenter View allows you to see upcoming slides, enabling you to smoothly transition between topics and prepare for what's coming next. The built-in timer helps you manage your time effectively, ensuring you stay within the allotted timeframe. Some versions also include tools to zoom in on specific parts of a slide or use a virtual laser pointer, further enhancing audience engagement.
18. Describe a time you had to adapt a PowerPoint presentation for different audiences or delivery methods (e.g., online vs. in-person).
I once prepared a PowerPoint presentation on a new data analytics platform for both senior management and the data science team. For senior management, I focused on the high-level business benefits, ROI, and strategic alignment, using minimal technical jargon and lots of visuals. The presentation was concise, highlighting key takeaways and decision points. When presenting to the data science team, I adapted the presentation to be much more technical, delving into the platform's architecture, features, and integration capabilities. I included code snippets demonstrating specific functionalities and opened the floor for a more in-depth Q&A session.
For online delivery, I made the presentation more self-explanatory by adding detailed notes and using clear, concise language. I also incorporated interactive elements like polls and quizzes to keep the audience engaged in a virtual setting, considering that online audiences have shorter attention spans compared to in-person presentations. For in-person delivery, I focused on visuals and storytelling, relying more on my verbal explanations and interactive discussions to convey key information.
19. What are your strategies for creating PowerPoint presentations that are both visually appealing and data-driven?
My strategies for creating visually appealing and data-driven PowerPoint presentations involve several key elements. I prioritize a clean and consistent design using a limited color palette and legible fonts. I leverage visuals such as charts, graphs, and images to represent data clearly and concisely, ensuring they are accurately labeled and relevant to the content. Animations and transitions are used sparingly to avoid distraction.
To ensure presentations are data-driven, I focus on telling a story with the data, highlighting key insights and trends. Data sources are always cited to maintain credibility. Before presenting, I always practice and refine the presentation to ensure a smooth delivery. Finally, I always seek feedback on both the visual design and data interpretation to make improvements for future presentations.
20. How familiar are you with using 3D models and animations within PowerPoint, and what are their ideal use cases?
I have some experience using 3D models and animations in PowerPoint. I've used them primarily for creating more engaging and visually appealing presentations. My experience includes inserting 3D models (often from online repositories), rotating and resizing them within slides, and applying basic animations to bring them to life or highlight specific features.
Ideal use cases include product demonstrations (showing a 360-degree view of a product), architectural visualizations, explaining complex processes or mechanisms, or even just adding a touch of visual flair to an otherwise static presentation. They are particularly effective when conveying spatial relationships or demonstrating movement that would be difficult to explain with 2D images or text alone. However, it's important to use them judiciously; overusing 3D models and animations can distract from the core message.
21. Discuss your approach to integrating data from Excel or other sources into PowerPoint presentations dynamically.
My approach to integrating data from Excel into PowerPoint dynamically typically involves linking the Excel data to the PowerPoint presentation. In PowerPoint, I use the 'Insert' tab and select 'Object,' then choose 'Create from File,' selecting the Excel file and checking the 'Link' box. This ensures that the data in the PowerPoint presentation is updated whenever the Excel file is modified. For more complex scenarios or when using other data sources, I may consider using VBA scripting within PowerPoint to automate the data import and formatting process, although this is less common.
Alternatively, if the data is relatively static or a one-time import is sufficient, I might simply copy and paste the data from Excel into PowerPoint, using the 'Paste Special' option to retain formatting or embed the data as a picture. However, this method does not provide dynamic updating capabilities. I would select the solution that best aligns with the specific data integration requirements and updating frequency.
22. Explain how you would use PowerPoint to create an interactive prototype for a website or application.
To create an interactive prototype in PowerPoint, I'd leverage its built-in features for simulating user interactions. I'd start by designing the key screens of the website or application as individual slides. Then, using hyperlinks and action buttons, I'd link these slides together to represent navigation flows. For example, clicking a button on the home page slide could link to the 'products' page slide. Animations and transitions can add visual feedback to simulate page loads or interactive elements. I can create a simulation with some basic interactions and navigation.
I'd use the 'Action' settings to trigger hyperlinks upon clicks or mouse hovers. For input fields, I would create static representations and use different slides to demonstrate the results of input (e.g., showing an error message on a separate slide if incorrect input is 'entered'). Although PowerPoint lacks true data handling or complex logic, it's useful for quickly visualizing user flows and gathering initial feedback on the user interface and navigation. I would also make sure to test the prototype thoroughly to ensure that the navigation works as expected and that there are no dead ends.
23. How do you optimize PowerPoint presentations for different screen sizes and resolutions?
To optimize PowerPoint presentations for various screen sizes and resolutions, start by designing for the lowest common denominator and scaling up. Set the slide size to a widescreen aspect ratio (16:9) as it's widely supported. Avoid using specific pixel dimensions in your design. Use relative sizing for fonts and elements to ensure they scale appropriately. Test the presentation on different screens before presenting. Consider saving a PDF version as a fail-safe if resolution issues persist. Use high-resolution images but compress them within PowerPoint to reduce file size.
For presentations that will be viewed on projectors, consider the projector's native resolution. You can adjust the slide size within PowerPoint to match the projector’s resolution. Keep in mind that smaller screens might require a different approach. Ensure text is readable on small screens by using larger font sizes.
24. Describe your experience with using PowerPoint's morph transition to create seamless animations and transitions.
I've used PowerPoint's Morph transition to create visually appealing and seamless animations. I've primarily used it to transition between slides with slightly different layouts, object sizes, or positions to give the impression of fluid motion. For example, I've used it to zoom in on a specific part of a diagram, move objects across the screen, and smoothly change the size and color of elements, creating a more engaging presentation experience.
Specifically, I've duplicated slides, made small changes to objects (position, size, color), and then applied the Morph transition to the second slide. This allows for a seemingly complex animation with minimal effort. Understanding that Morph relies on object names is crucial; renaming shapes to have identical names across slides allows morph to treat them as the same object during the transition.
25. What are your go-to resources for finding high-quality images, icons, and other visual assets for PowerPoint?
My go-to resources for finding high-quality images are Unsplash and Pexels. Both offer a wide selection of royalty-free images that are suitable for presentations. For icons, I frequently use Font Awesome and the Noun Project. Font Awesome is great for scalable vector graphics, while the Noun Project has a vast collection of diverse and simple icons. Another good option is Icons8, they provide both images and icons, often in a consistent style.
For other visual assets, I sometimes explore Canva's free templates and elements. It allows me to quickly create custom graphics or modify existing templates. When appropriate, I also use PowerPoint's built-in SmartArt features, especially for creating simple diagrams and flowcharts. It's all about balance, quality, relevance and ensuring the resources are legally safe to use.
26. How do you use PowerPoint's recording features to create narrated presentations or training videos?
To create narrated presentations or training videos using PowerPoint's recording features, first, navigate to the 'Recording' tab. If you don't see it, enable it in PowerPoint's options under 'Customize Ribbon'. Click 'Record Slide Show' and choose to record from the current slide or the beginning. During recording, you can use the pen, highlighter, and laser pointer tools to annotate your slides. Your narration is recorded along with these annotations.
After recording each slide, you can preview it. If you're not satisfied, clear the recording for that slide and re-record. Once you've recorded all slides, stop the recording and save your presentation. You can then export the presentation as a video file (MP4) for sharing. Remember to adjust video quality settings during export to balance file size and visual clarity.
27. Explain how you would use PowerPoint to create a visually compelling annual report or investor presentation.
To create a visually compelling annual report or investor presentation in PowerPoint, I'd prioritize a clean, modern design. I'd start with a consistent color palette and font scheme, using high-quality images and charts to illustrate key data points and achievements. Animations and transitions would be used sparingly to add subtle visual interest without being distracting.
I'd focus on storytelling, structuring the presentation with a clear narrative flow that highlights the company's performance, strategy, and future outlook. Data visualizations would be clear and concise, avoiding overly complex charts. I'd also ensure the presentation is optimized for the target audience, considering their level of financial knowledge and tailoring the content accordingly. Finally, I'd use PowerPoint's features like SmartArt and Morph transitions creatively to enhance the visual appeal and engagement.
28. Can you describe a time when your PowerPoint skills significantly impacted a project or presentation outcome?
In a previous role, our team was tasked with presenting a complex data analysis to senior management regarding a new marketing campaign's performance. Initially, the data was overwhelming, and the insights were difficult to grasp. I volunteered to revamp the PowerPoint presentation. I focused on creating clear, visually appealing charts and graphs that highlighted key performance indicators (KPIs). I also used animations and transitions strategically to guide the audience through the story of the data, emphasizing key findings and recommendations.
The revised presentation received overwhelmingly positive feedback. Senior management understood the data immediately and approved the proposed budget adjustments based on the clear insights. The campaign ultimately exceeded its targets by 15%, which was directly attributed to the informed decision-making facilitated by the improved clarity of the PowerPoint presentation. I believe this demonstrated the power of effective communication, especially through a well-crafted presentation.
PowerPoint MCQ
Question 1.
Which of the following is generally the MOST effective method for presenting quantitative data in a PowerPoint presentation?
Options:
Question 2.
Which of the following is the primary purpose of using transitions in a PowerPoint presentation?
Options:
Options:
Question 3.
Which of the following is the primary purpose of adding animations to objects on a PowerPoint slide?
Options:
Question 4.
What is the primary purpose of adding speaker notes to a PowerPoint presentation?
Options:
Question 5.
Which of the following methods is MOST appropriate for maintaining the aspect ratio of an image while resizing it in PowerPoint?
Options:
Question 6.
Which of the following is the primary benefit of using the Slide Master in PowerPoint?
Options:
Question 7.
Which file extension is used for PowerPoint templates?
Options:
Question 8.
Which of the following methods allows you to create a dynamic link in PowerPoint, so that changes in an external data source (like an Excel file) are automatically reflected in your presentation?
Options:
Question 9.
Which of the following is the MOST efficient way to embed a video directly into your PowerPoint presentation to ensure seamless playback during your presentation, without relying on an internet connection?
Options:
Question 10.
Which of the following is the MOST effective way to trim an audio clip that you have inserted into a PowerPoint slide?
Options:
Question 11.
Which of the following best describes the primary function of the Morph transition in PowerPoint?
Options:
Question 12.
Which of the following methods is best suited for multiple users to simultaneously edit a PowerPoint presentation in real-time?
Options:
Question 13.
Which PowerPoint view is most suitable for rearranging slides and getting an overview of the entire presentation? options:
Options:
Question 14.
Which of the following is the MOST effective way to ensure that a table inserted into your PowerPoint presentation is both visually appealing and easy to understand?
Options:
Question 15.
When printing a PowerPoint presentation as handouts, which of the following options allows you to include multiple slides on a single page, along with lines for note-taking?
Options:
Question 16.
Which of the following actions MOST directly creates a hyperlink in PowerPoint?
Options:
Question 17.
Which PowerPoint feature allows you to practice your presentation and receive feedback on pacing, including timing for each slide and the overall presentation?
Options:
Question 18.
Which of the following methods is the MOST effective way to protect a PowerPoint presentation from unauthorized access?
Options:
Question 19.
Why is understanding your target audience crucial when designing a PowerPoint presentation?
Options:
Question 20.
Which of the following methods is the MOST effective way to insert a pre-existing Excel chart into your PowerPoint presentation so that it updates automatically when the Excel data changes?
Options:
Question 21.
What is the recommended way to add a consistent watermark to every slide in a PowerPoint presentation?
Options:
Question 22.
What is the primary purpose of using sections in a PowerPoint presentation?
Options:
Question 23.
Which of the following chart types is generally MOST suitable for showing trends in data over time? options:
Options:
Question 24.
Which PowerPoint feature allows you to quickly apply the same formatting (fill, outline, effects, etc.) from one shape to another?
Options:
Question 25.
Which of the following is the most efficient way to add a page number and the presentation title to the bottom of every slide in a PowerPoint presentation?
Options:
Which PowerPoint skills should you evaluate during the interview phase?
While a single interview can't reveal everything about a candidate, focusing on key PowerPoint skills is possible. Evaluating these specific abilities will help you gauge their overall proficiency. Here are some skills to consider when interviewing PowerPoint candidates.
Presentation Design
Want to quickly filter candidates on their presentation design skills? Use an assessment test with relevant questions. Our HTML/CSS assessment can help you evaluate a candidate's design and visual communication abilities.
To further assess presentation design skills, ask targeted questions. These questions can reveal their thought process and design sensibilities.
"Describe a time when you had to present complex data in a PowerPoint presentation. How did you make it understandable for the audience?"
Look for answers that highlight the candidate's ability to simplify complex information. They should also demonstrate an understanding of visual hierarchy and audience engagement.
Animation and Transitions
Want to quickly filter candidates on their animation and transitions skills? Use an assessment test with relevant questions. Our UI/UX assessment can help you evaluate a candidate's design abilities.
To assess skills in animations and transitions, try asking targeted questions. These questions can reveal the candidate's knowledge and experience in this area.
"How do you decide when to use animations and transitions in a PowerPoint presentation? Give an example of when you used them effectively, and why."
The candidate should demonstrate a strategic approach to using animations and transitions. Look for explanations of how these elements were used to enhance understanding, not just for visual appeal.
Data Visualization
Do you want to filter candidates quickly on their Data visualization skills? Use an assessment test with relevant MCQs. Adaface's Data Analysis assessment can help you assess if the candidate knows how to tell a story using data.
Ask targeted interview questions to judge this subskill. These questions can reveal the candidate's knowledge and experience in this area.
"Describe a time when you transformed raw data into a visually appealing chart or graph in PowerPoint. What considerations did you make?"
The candidate should emphasize how they chose the right chart type. Also, the answer should showcase how they made sure the data was easy to interpret and any story they told.
3 Tips for Using PowerPoint Interview Questions
Before you start putting what you've learned into practice, here are a few tips to help you make the most of PowerPoint interview questions. These tips will help you assess candidates more effectively and make better hiring decisions.
1. Leverage Skills Assessments to Streamline the Screening Process
Using skills assessments can significantly improve your candidate screening process. These tests provide objective data on a candidate's abilities, helping you quickly identify those with the necessary skills for the role.
Consider using assessments like our Power BI Online Test to evaluate data visualization skills, or our PowerPoint Online Test to evaluate their ability to create presentations. These assessments can help you determine if candidates have the practical skills needed to succeed.
By using skills assessments before interviews, you can focus your interview time on candidates who have demonstrated a baseline level of proficiency. This saves time and ensures that you're only interviewing the most qualified candidates.
2. Outline Targeted Interview Questions to Maximize Assessment
Time is a valuable resource during interviews. Carefully select a limited number of questions that target the most important aspects of PowerPoint proficiency to ensure you're spending time wisely.
Consider complementing your PowerPoint-specific questions with inquiries about related skills, such as data analysis or communication. Our comprehensive list of interview questions covers a wide range of topics that can help you assess these skills.
Focusing on relevant questions allows you to evaluate candidates on the most important fronts, leading to a more informed hiring decision.
3. Ask Effective Follow-Up Questions to Gauge Candidate Depth
Simply asking interview questions isn't always enough. Asking the right follow-up questions is important to uncover the true depth of a candidate's knowledge and skills.
For example, if a candidate describes how to create a complex animation in PowerPoint, follow up with 'Can you describe a situation where this animation significantly improved a presentation's impact?' This will give a sense on their creative skills and understanding of its practical applications and ability to provide concise examples.
Hire Top PowerPoint Talent with Skills Tests
Looking to hire a PowerPoint expert? Ensuring candidates possess the necessary skills is paramount. The most accurate way to validate their abilities is through skills testing. Consider using a dedicated skills test like our Power BI Online Test to assess their proficiency.
Once you've identified top candidates using skills tests, streamline your hiring process by inviting them for interviews. Kickstart your assessment journey by signing up and discover how Adaface can transform your hiring process!
PowerShell Online Test
40 mins | 8 MCQs and 1 Coding Question
The PowerShell Online Test uses scenario-based MCQs to evaluate candidates on their proficiency in creating and running PowerShell scripts, managing Windows-based systems, automating system tasks, and working with .NET Framework. Other important topics that are covered in the test include security management, error handling, object manipulation, and remote server management.
Try PowerShell Online Test
Download PowerPoint interview questions template in multiple formats
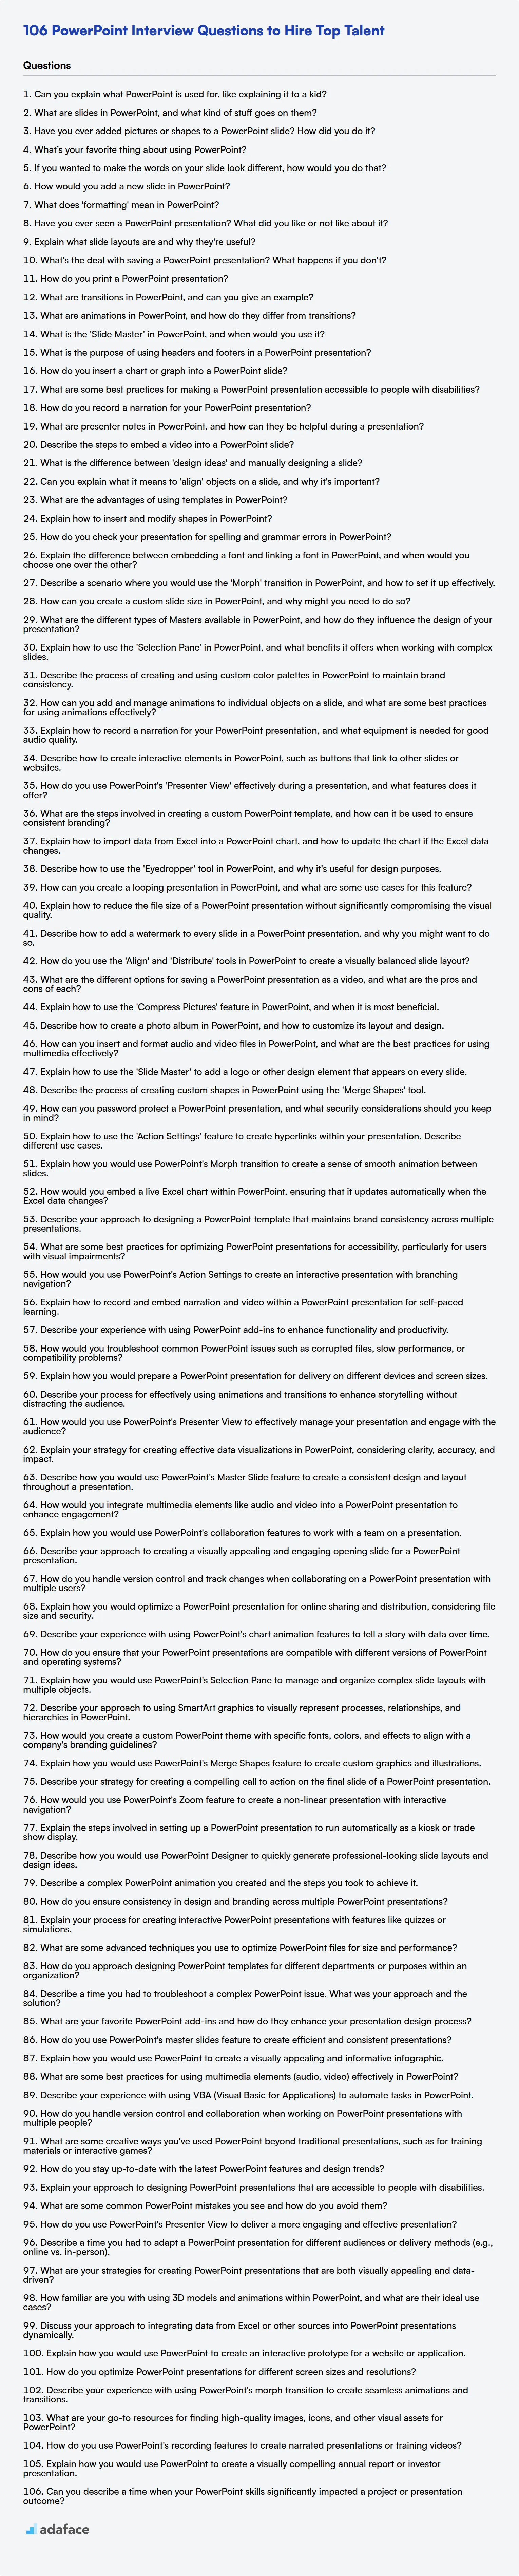
PowerPoint Interview Questions FAQs
What are some basic PowerPoint interview questions?
Basic PowerPoint interview questions often cover fundamental concepts like creating presentations, using templates, and inserting images.
What are some intermediate PowerPoint interview questions?
Intermediate questions explore features like animations, transitions, working with master slides, and embedding multimedia.
What are some advanced PowerPoint interview questions?
Advanced questions might focus on custom animations, using macros, integrating data from external sources, and designing interactive presentations.
What are some expert PowerPoint interview questions?
Expert-level questions assess in-depth knowledge of PowerPoint, including advanced scripting, troubleshooting complex issues, and optimizing presentations for performance and accessibility.
Why use PowerPoint interview questions?
PowerPoint interview questions help evaluate a candidate's proficiency with the software, ensuring they possess the skills needed to create impactful and effective presentations.
How can skills tests help in the PowerPoint hiring process?
Skills tests provide an objective assessment of a candidate's PowerPoint abilities, complementing interview questions and helping you identify top performers.
40 min skill tests.
No trick questions.
Accurate shortlisting.
We make it easy for you to find the best candidates in your pipeline with a 40 min skills test.
Try for freeRelated posts
Free resources

Join 1200+ companies in 80+ countries.
Try the most candidate friendly skills assessment tool today.
40 min tests.
No trick questions.
Accurate shortlisting.
No trick questions.
Accurate shortlisting.