

Ensuring candidates possess strong numerical reasoning skills during recruitment is essential for many analyst roles. It can be challenging to formulate relevant questions, so we've compiled a comprehensive list to assist you.
This blog post will cover various numerical reasoning interview questions for different experience levels, from junior to senior analysts. Additionally, it includes questions related to data interpretation and financial analysis to help you comprehensively evaluate candidates.
By utilizing these questions, you can streamline your interview process and identify top talent more effectively. Consider supplementing your interviews with our numerical reasoning tests to further ensure candidates meet your expectations.
Table of contents
10 common Numerical Reasoning interview questions to ask your applicants
7 Numerical Reasoning interview questions and answers to evaluate junior analysts
15 intermediate Numerical Reasoning interview questions and answers to ask mid-tier analysts
6 advanced Numerical Reasoning interview questions and answers to evaluate senior analysts
14 Numerical Reasoning questions related to data interpretation
10 Numerical Reasoning questions related to financial analysis
12 situational Numerical Reasoning interview questions for hiring top analysts
Which Numerical Reasoning skills should you evaluate during the interview phase?
Enhance Your Hiring Process with Numerical Reasoning Skills Tests and Interview Questions
Download Numerical Reasoning interview questions template in multiple formats
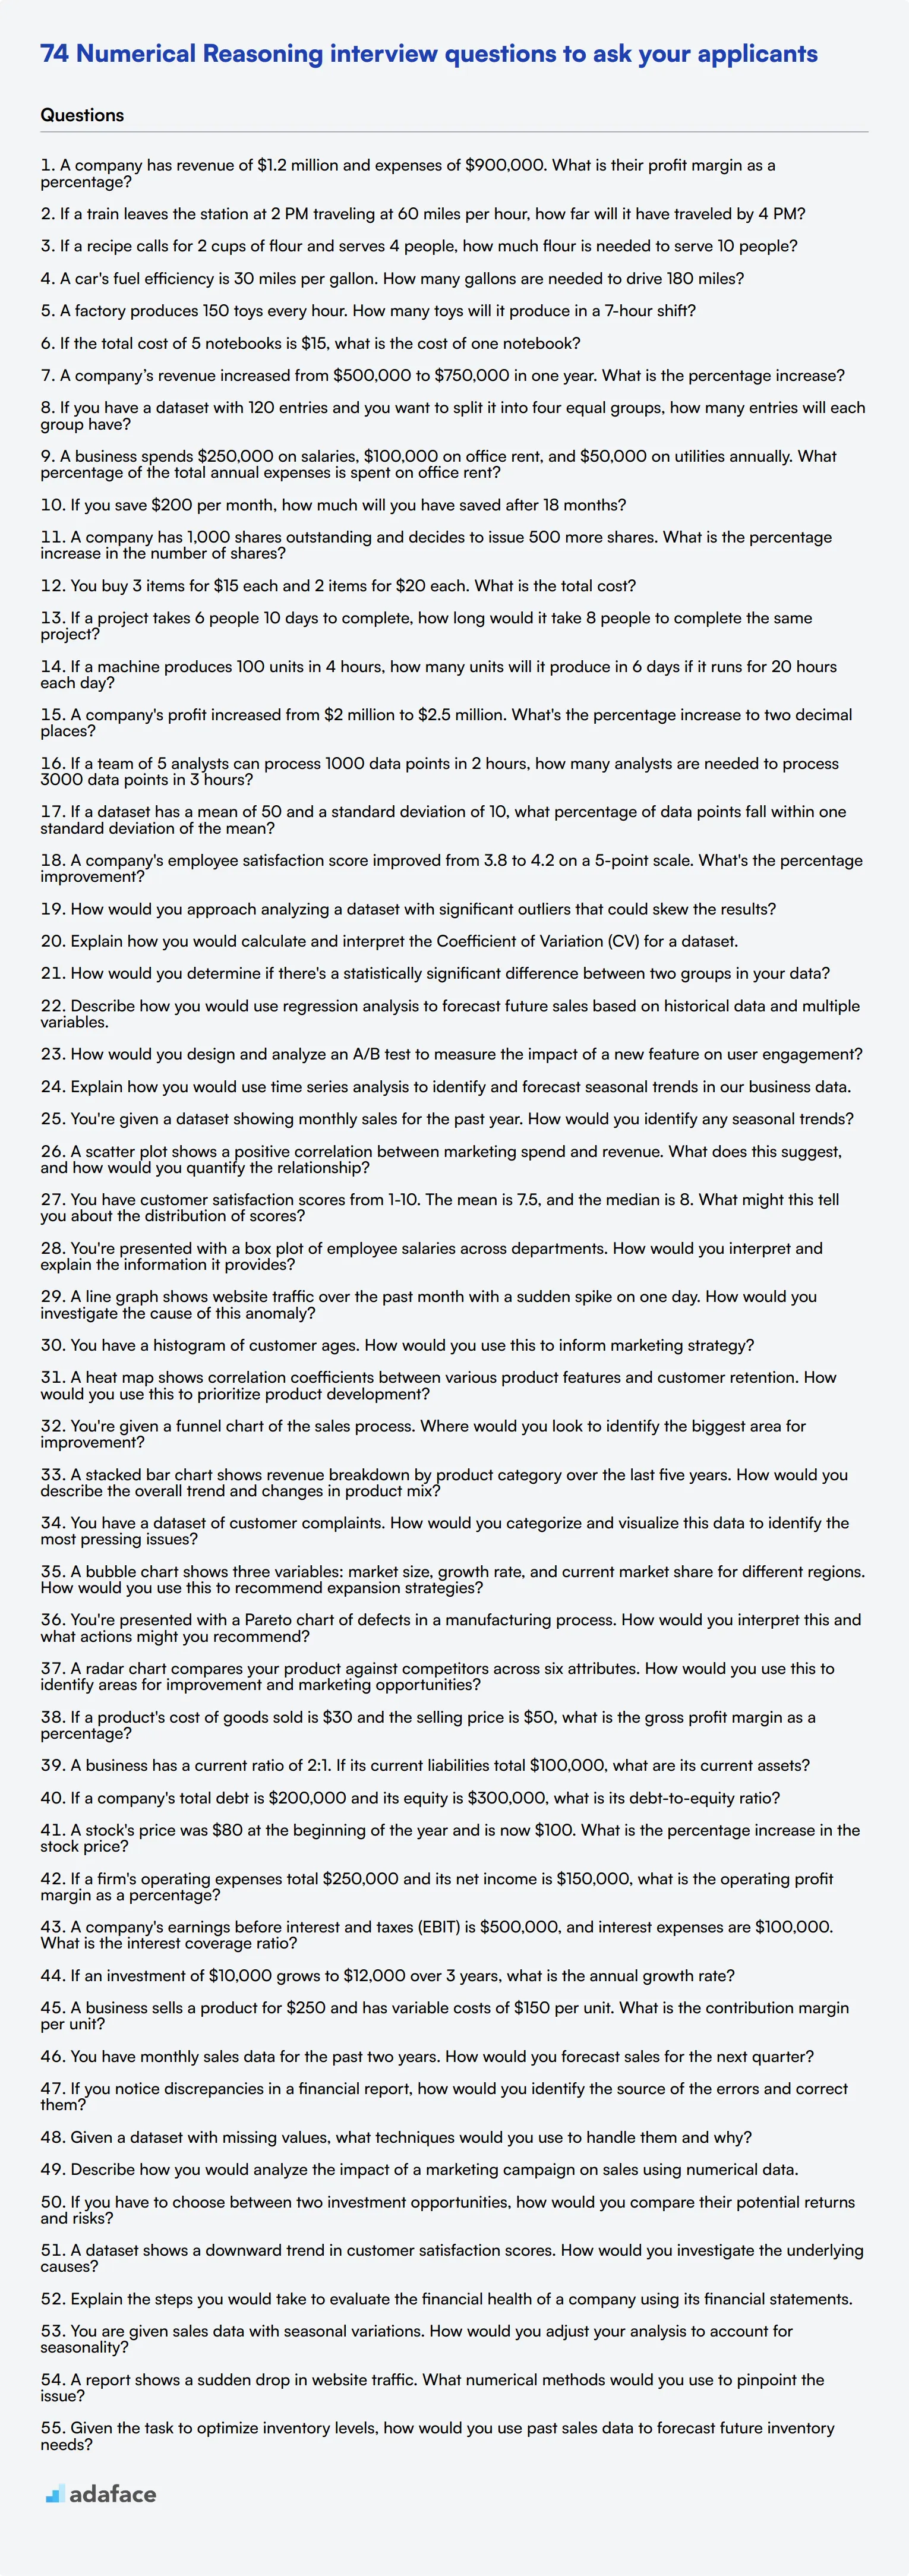
10 common Numerical Reasoning interview questions to ask your applicants

To gauge your applicants' numerical reasoning skills, consider using this list of common interview questions. These questions will help you assess their ability to analyze data and make informed decisions, which is essential for roles such as a data analyst.
- If a product costs $75 and is marked down by 20%, what is the new price?
- A company has revenue of $1.2 million and expenses of $900,000. What is their profit margin as a percentage?
- If a train leaves the station at 2 PM traveling at 60 miles per hour, how far will it have traveled by 4 PM?
- A store sells a shirt for $40 after a 10% discount. What was the original price of the shirt?
- If a recipe calls for 2 cups of flour and serves 4 people, how much flour is needed to serve 10 people?
- A car's fuel efficiency is 30 miles per gallon. How many gallons are needed to drive 180 miles?
- If a bank offers an interest rate of 5% per year, how much interest will be earned on a $1,000 deposit after 3 years?
- In a survey, 80% of respondents preferred Product A over Product B. If 200 people were surveyed, how many preferred Product A?
- A factory produces 150 toys every hour. How many toys will it produce in a 7-hour shift?
- If the total cost of 5 notebooks is $15, what is the cost of one notebook?
7 Numerical Reasoning interview questions and answers to evaluate junior analysts

To effectively evaluate junior analysts' numerical reasoning skills, you need a solid set of questions that don’t just test their math, but also their problem-solving abilities. Use these questions in your interviews to ensure your candidates can handle the demands of the role with confidence.
1. If an item costs $50 and the sales tax is 8%, what is the total cost of the item?
To calculate the total cost, you first find the amount of sales tax by multiplying the cost of the item by the sales tax rate. Here, 8% of $50 is $4. Adding this to the original price gives a total cost of $54.
An ideal candidate should clearly explain each step and demonstrate their ability to handle basic calculations without confusion.
2. A company’s revenue increased from $500,000 to $750,000 in one year. What is the percentage increase?
To find the percentage increase, subtract the original revenue from the new revenue and then divide the result by the original revenue. Finally, multiply by 100 to get the percentage. So, ($750,000 - $500,000) / $500,000 * 100 = 50%.
Look for candidates who can break down the formula and articulate each step clearly, indicating a strong grasp of percentage calculations.
3. If you have a dataset with 120 entries and you want to split it into four equal groups, how many entries will each group have?
To determine the number of entries in each group, simply divide the total number of entries by the number of groups. Here, 120 divided by 4 equals 30 entries per group.
Candidates should easily handle this division problem and should be able to communicate their process effectively.
4. A business spends $250,000 on salaries, $100,000 on office rent, and $50,000 on utilities annually. What percentage of the total annual expenses is spent on office rent?
First, calculate the total annual expenses by adding salaries, office rent, and utilities: $250,000 + $100,000 + $50,000 = $400,000. Then, divide the office rent by the total expenses and multiply by 100 to get the percentage: $100,000 / $400,000 * 100 = 25%.
Watch for candidates who can clearly explain how they arrived at the total expenses and then correctly calculated the percentage.
5. If you save $200 per month, how much will you have saved after 18 months?
To find the total savings, multiply the monthly savings by the number of months. Here, $200 multiplied by 18 months equals $3,600.
A strong candidate should be able to quickly perform this multiplication and explain their process confidently.
6. A company has 1,000 shares outstanding and decides to issue 500 more shares. What is the percentage increase in the number of shares?
To find the percentage increase, subtract the original number of shares from the new total number of shares, divide by the original number of shares, and multiply by 100. So, (1,500 - 1,000) / 1,000 * 100 = 50%.
Candidates should be able to follow the calculation steps and clearly articulate how they arrived at the percentage increase.
7. You buy 3 items for $15 each and 2 items for $20 each. What is the total cost?
Calculate the total cost by multiplying the quantity of each item by its price and then summing the results: (3 * $15) + (2 * $20) = $45 + $40 = $85.
Look for candidates who can perform these simple multiplications and additions confidently and explain their process without hesitation.
15 intermediate Numerical Reasoning interview questions and answers to ask mid-tier analysts
To assess the numerical reasoning skills of mid-tier data analysts, use these 15 intermediate questions. These questions are designed to evaluate candidates' ability to handle more complex calculations and data interpretations, helping you identify top talent for your analytical roles.
- A company's sales have grown by 5% each year for the past 3 years. If current sales are $1,000,000, what were the sales 3 years ago?
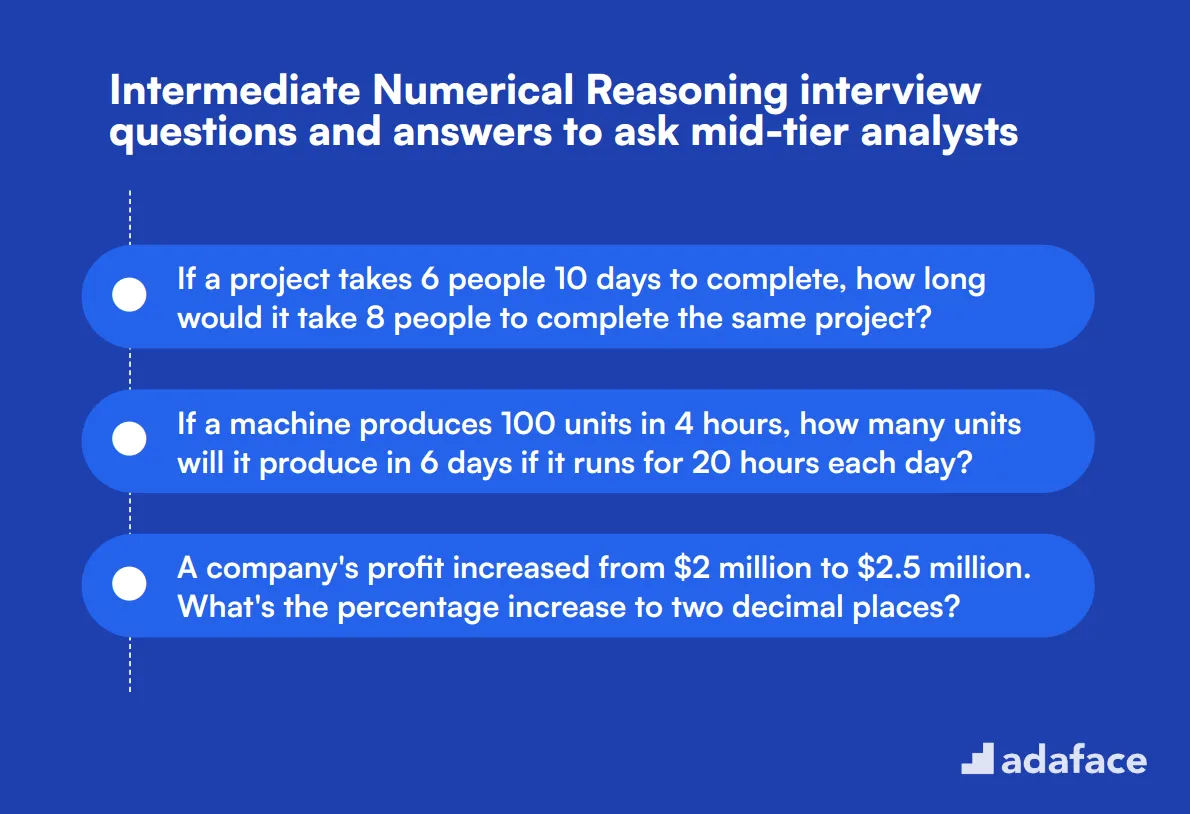
- If a project takes 6 people 10 days to complete, how long would it take 8 people to complete the same project?
- A dataset contains 1000 entries. If 40% are male, 55% are female, and the rest are non-binary, how many non-binary entries are there?
- If a machine produces 100 units in 4 hours, how many units will it produce in 6 days if it runs for 20 hours each day?
- A company's profit increased from $2 million to $2.5 million. What's the percentage increase to two decimal places?
- If 15% of customers churn each quarter, what percentage of customers remain after a full year?
- A product's price is increased by 10% and then decreased by 10%. What's the overall percentage change?
- If a team of 5 analysts can process 1000 data points in 2 hours, how many analysts are needed to process 3000 data points in 3 hours?
- A company's revenue is split 70-30 between two products. If total revenue is $10 million and Product A accounts for 70%, what's Product B's revenue?
- If a dataset has a mean of 50 and a standard deviation of 10, what percentage of data points fall within one standard deviation of the mean?
- A marketing campaign costs $50,000 and generates 2,500 leads. If 10% of leads convert to sales with an average value of $300, what's the ROI?
- If a company's market share increases from 15% to 18%, what's the relative percentage increase in market share?
- A product's price elasticity of demand is -1.5. If price increases by 10%, what's the expected change in demand?
- If a sample of 200 people shows 60% preference for a product, what's the margin of error at a 95% confidence level?
- A company's employee satisfaction score improved from 3.8 to 4.2 on a 5-point scale. What's the percentage improvement?
6 advanced Numerical Reasoning interview questions and answers to evaluate senior analysts
When evaluating senior analysts, it's crucial to delve deeper into their numerical reasoning skills. These advanced questions will help you assess candidates' ability to handle complex data scenarios, interpret trends, and make strategic decisions. Use them to identify top-tier talent who can truly drive your organization's data-driven success.
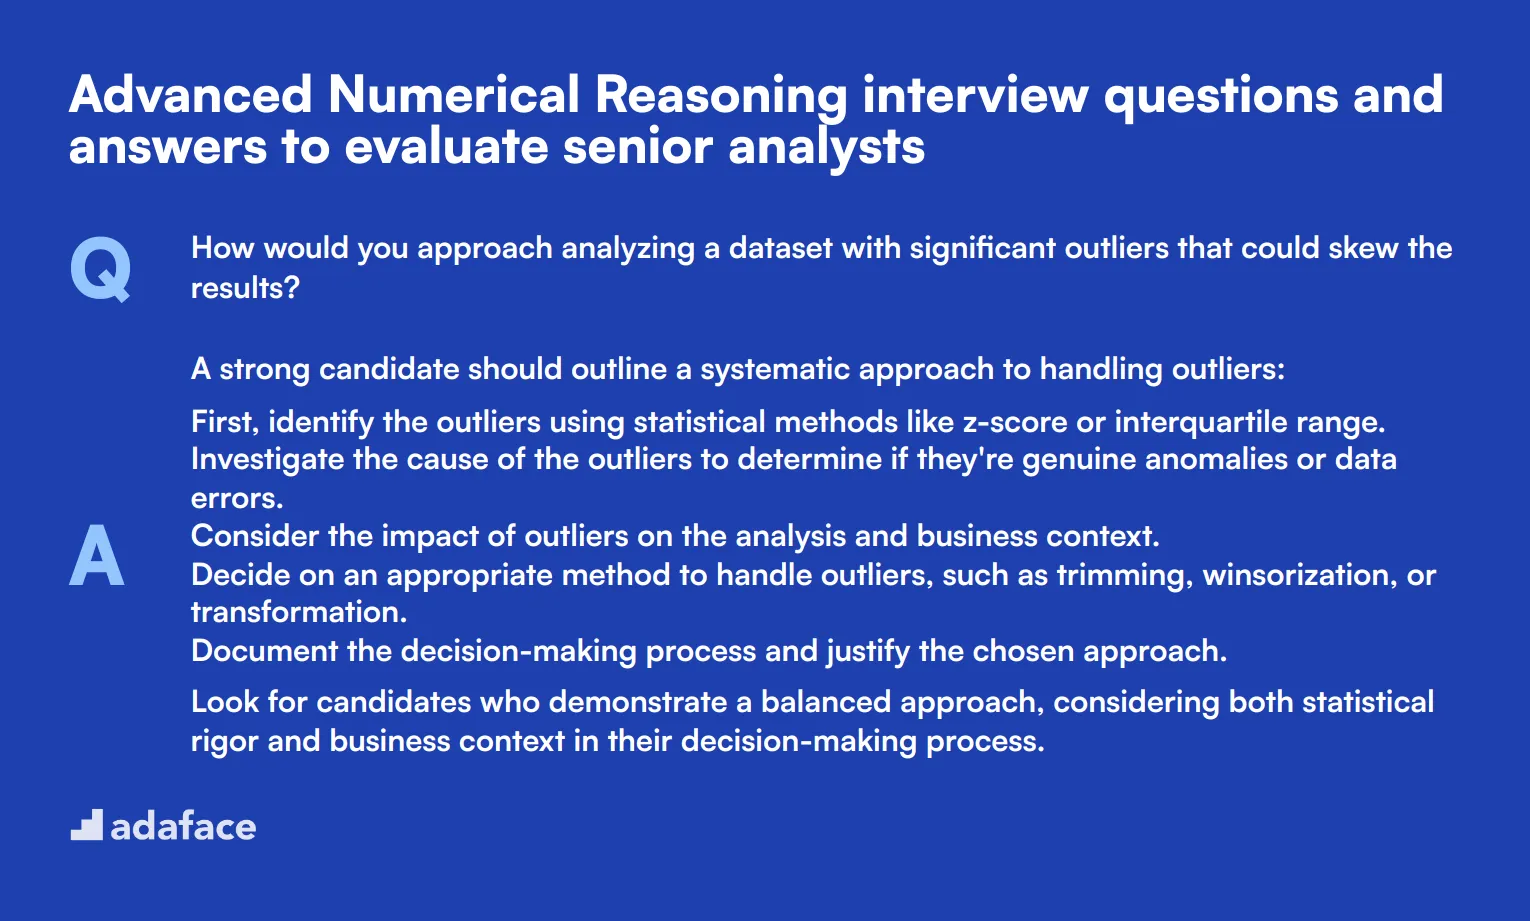
1. How would you approach analyzing a dataset with significant outliers that could skew the results?
A strong candidate should outline a systematic approach to handling outliers:
- First, identify the outliers using statistical methods like z-score or interquartile range.
- Investigate the cause of the outliers to determine if they're genuine anomalies or data errors.
- Consider the impact of outliers on the analysis and business context.
- Decide on an appropriate method to handle outliers, such as trimming, winsorization, or transformation.
- Document the decision-making process and justify the chosen approach.
Look for candidates who demonstrate a balanced approach, considering both statistical rigor and business context in their decision-making process.
2. Explain how you would calculate and interpret the Coefficient of Variation (CV) for a dataset.
The Coefficient of Variation (CV) is a measure of relative variability that allows comparison between datasets with different units or scales. To calculate the CV:
- Compute the standard deviation of the dataset.
- Calculate the mean of the dataset.
- Divide the standard deviation by the mean and multiply by 100 to express as a percentage.
Interpretation: A lower CV indicates less variability relative to the mean, while a higher CV suggests greater dispersion. This metric is particularly useful when comparing datasets with different units or scales.
Look for candidates who can explain practical applications of CV, such as comparing product consistency across different manufacturing lines or assessing risk in financial portfolios.
3. How would you determine if there's a statistically significant difference between two groups in your data?
A strong candidate should outline a step-by-step approach:
- Formulate null and alternative hypotheses.
- Choose an appropriate statistical test based on data characteristics (e.g., t-test for normally distributed data, Mann-Whitney U test for non-parametric data).
- Set a significance level (usually 0.05).
- Calculate the test statistic and p-value.
- Compare the p-value to the significance level to make a decision.
- Interpret the results in the context of the business question.
Look for candidates who emphasize the importance of checking assumptions before applying tests and who can explain the practical significance of results beyond just statistical significance.
4. Describe how you would use regression analysis to forecast future sales based on historical data and multiple variables.
A comprehensive answer should include the following steps:
- Collect and clean historical sales data along with potential predictor variables (e.g., marketing spend, economic indicators, seasonality).
- Explore the data visually and statistically to identify patterns and relationships.
- Select relevant variables and check for multicollinearity.
- Choose an appropriate regression model (e.g., multiple linear regression, polynomial regression).
- Split the data into training and testing sets.
- Fit the model to the training data and evaluate its performance on the test set.
- Analyze the model's coefficients and statistical measures (R-squared, p-values) to assess fit and significance.
- Use the model to make forecasts and provide confidence intervals.
- Continuously monitor and update the model with new data.
Look for candidates who discuss the importance of feature selection, model validation, and the ability to explain the model's insights to non-technical stakeholders.
5. How would you design and analyze an A/B test to measure the impact of a new feature on user engagement?
A strong response should cover the following aspects:
- Define clear objectives and success metrics for the test.
- Determine the required sample size using power analysis.
- Randomly assign users to control and treatment groups.
- Implement the new feature for the treatment group.
- Collect data over a sufficient time period.
- Analyze results using appropriate statistical tests (e.g., t-test for continuous data, chi-square for categorical data).
- Calculate the effect size and confidence intervals.
- Interpret results in the context of business goals and potential implementation costs.
Look for candidates who emphasize the importance of controlling for external factors, ensuring test duration is long enough to capture true effects, and considering both statistical and practical significance in decision-making.
6. Explain how you would use time series analysis to identify and forecast seasonal trends in our business data.
A comprehensive answer should include the following steps:
- Collect and preprocess time series data, ensuring consistent time intervals.
- Visualize the data to identify patterns, trends, and potential seasonality.
- Decompose the time series into trend, seasonal, and residual components.
- Test for stationarity using methods like the Augmented Dickey-Fuller test.
- If non-stationary, apply differencing or transformation to achieve stationarity.
- Identify the appropriate model (e.g., ARIMA, SARIMA) based on ACF and PACF plots.
- Fit the model to the data and evaluate its performance using metrics like MAPE or RMSE.
- Use the model to forecast future values and provide confidence intervals.
- Validate forecasts against new data as it becomes available and adjust the model if needed.
Look for candidates who discuss the importance of data visualization in identifying patterns, the need to account for external factors that might influence seasonality, and the ability to communicate findings to non-technical stakeholders.
14 Numerical Reasoning questions related to data interpretation
To assess candidates' ability to interpret and analyze data, use these data interpretation questions. These scenarios simulate real-world business situations, helping you evaluate how applicants process information and draw meaningful conclusions.
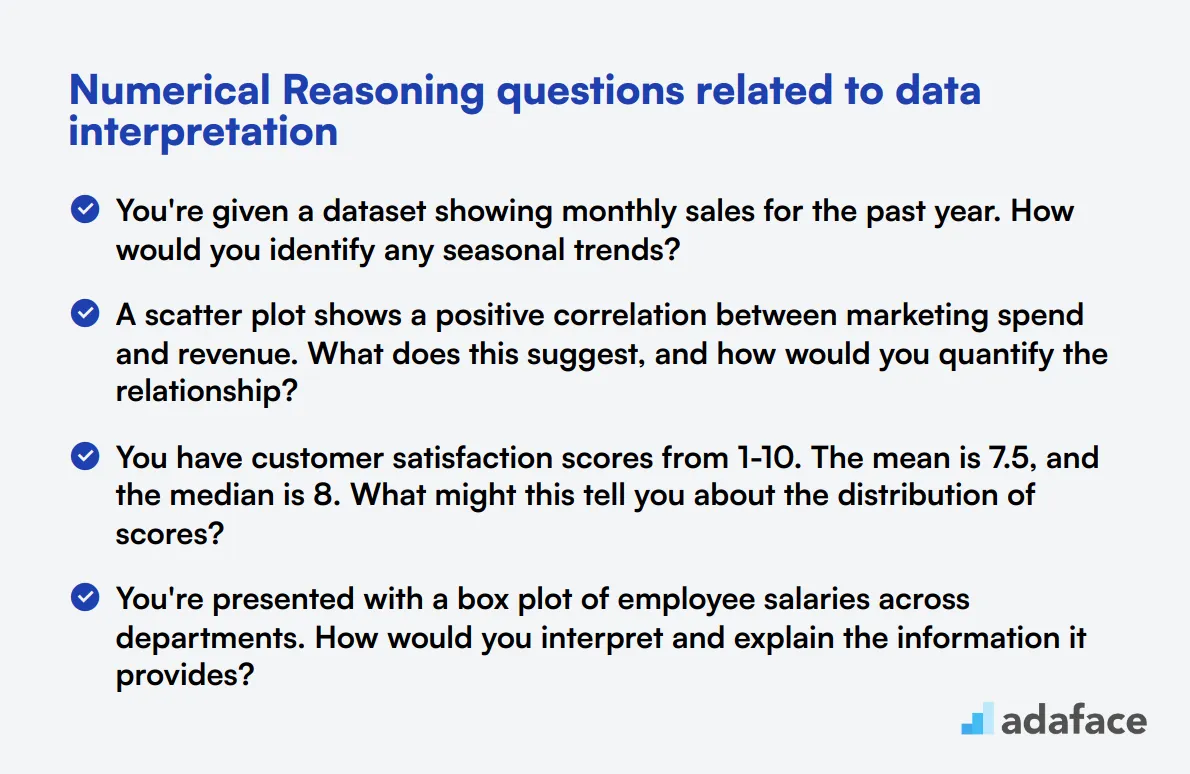
- You're given a dataset showing monthly sales for the past year. How would you identify any seasonal trends?
- A scatter plot shows a positive correlation between marketing spend and revenue. What does this suggest, and how would you quantify the relationship?
- You have customer satisfaction scores from 1-10. The mean is 7.5, and the median is 8. What might this tell you about the distribution of scores?
- A pie chart shows market share for five competitors. Your company's slice is 22%. How would you present this data to highlight your company's position?
- You're presented with a box plot of employee salaries across departments. How would you interpret and explain the information it provides?
- A line graph shows website traffic over the past month with a sudden spike on one day. How would you investigate the cause of this anomaly?
- You have a histogram of customer ages. How would you use this to inform marketing strategy?
- A heat map shows correlation coefficients between various product features and customer retention. How would you use this to prioritize product development?
- You're given a funnel chart of the sales process. Where would you look to identify the biggest area for improvement?
- A stacked bar chart shows revenue breakdown by product category over the last five years. How would you describe the overall trend and changes in product mix?
- You have a dataset of customer complaints. How would you categorize and visualize this data to identify the most pressing issues?
- A bubble chart shows three variables: market size, growth rate, and current market share for different regions. How would you use this to recommend expansion strategies?
- You're presented with a Pareto chart of defects in a manufacturing process. How would you interpret this and what actions might you recommend?
- A radar chart compares your product against competitors across six attributes. How would you use this to identify areas for improvement and marketing opportunities?
10 Numerical Reasoning questions related to financial analysis
Using these numerical reasoning questions can help you assess a candidate's ability to analyze financial data effectively. This is crucial for roles such as a financial analyst where financial insights are key to decision-making. Incorporate these questions into your interview process to gauge the applicant's quantitative skills in real-world scenarios.
- A company has an investment of $50,000 that earns 7% annual interest. What will the investment be worth at the end of 5 years, assuming the interest is compounded annually?
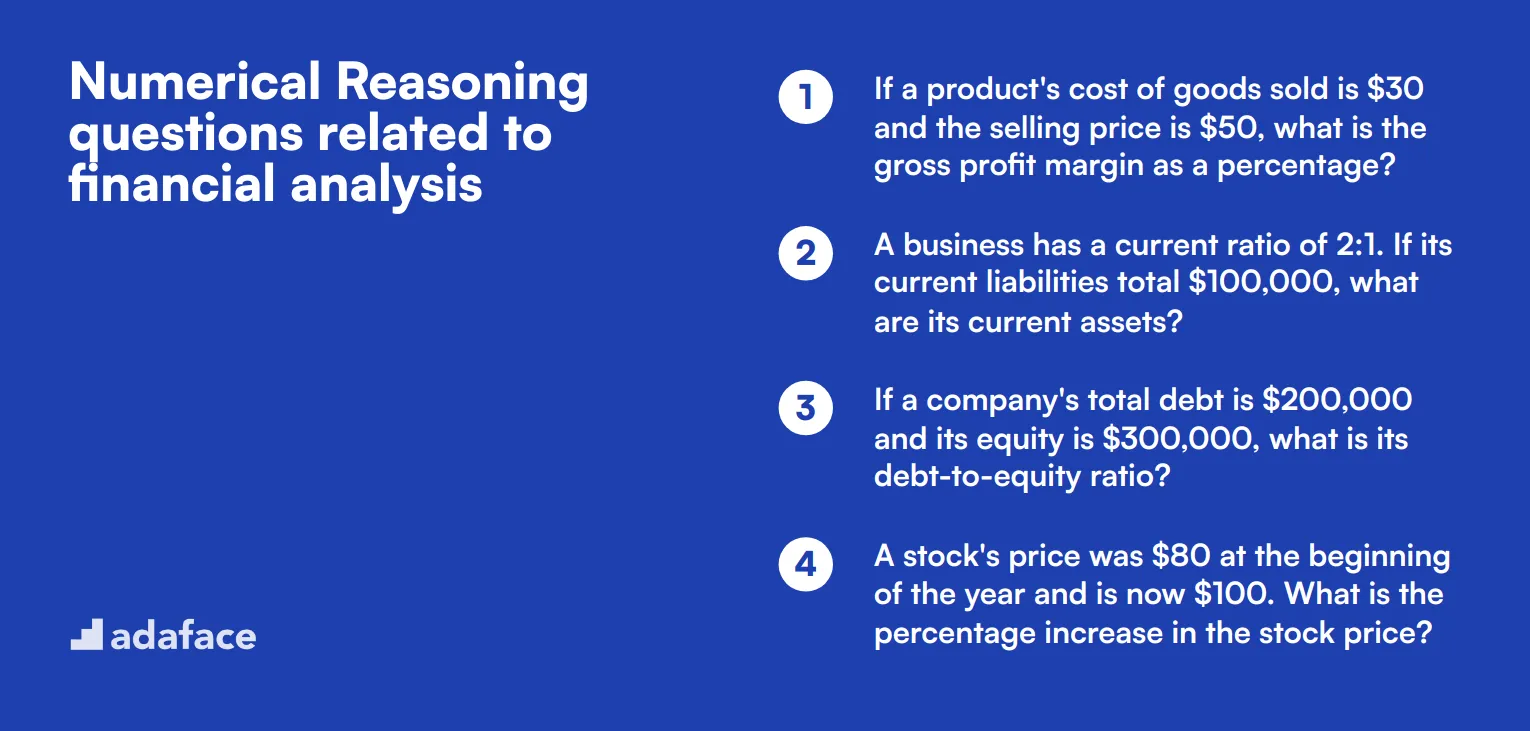
- If a product's cost of goods sold is $30 and the selling price is $50, what is the gross profit margin as a percentage?
- A business has a current ratio of 2:1. If its current liabilities total $100,000, what are its current assets?
- If a company's total debt is $200,000 and its equity is $300,000, what is its debt-to-equity ratio?
- A stock's price was $80 at the beginning of the year and is now $100. What is the percentage increase in the stock price?
- If a firm's operating expenses total $250,000 and its net income is $150,000, what is the operating profit margin as a percentage?
- A bank charges a 1.5% annual fee on a line of credit of $30,000. How much will be paid in fees over one year?
- A company's earnings before interest and taxes (EBIT) is $500,000, and interest expenses are $100,000. What is the interest coverage ratio?
- If an investment of $10,000 grows to $12,000 over 3 years, what is the annual growth rate?
- A business sells a product for $250 and has variable costs of $150 per unit. What is the contribution margin per unit?
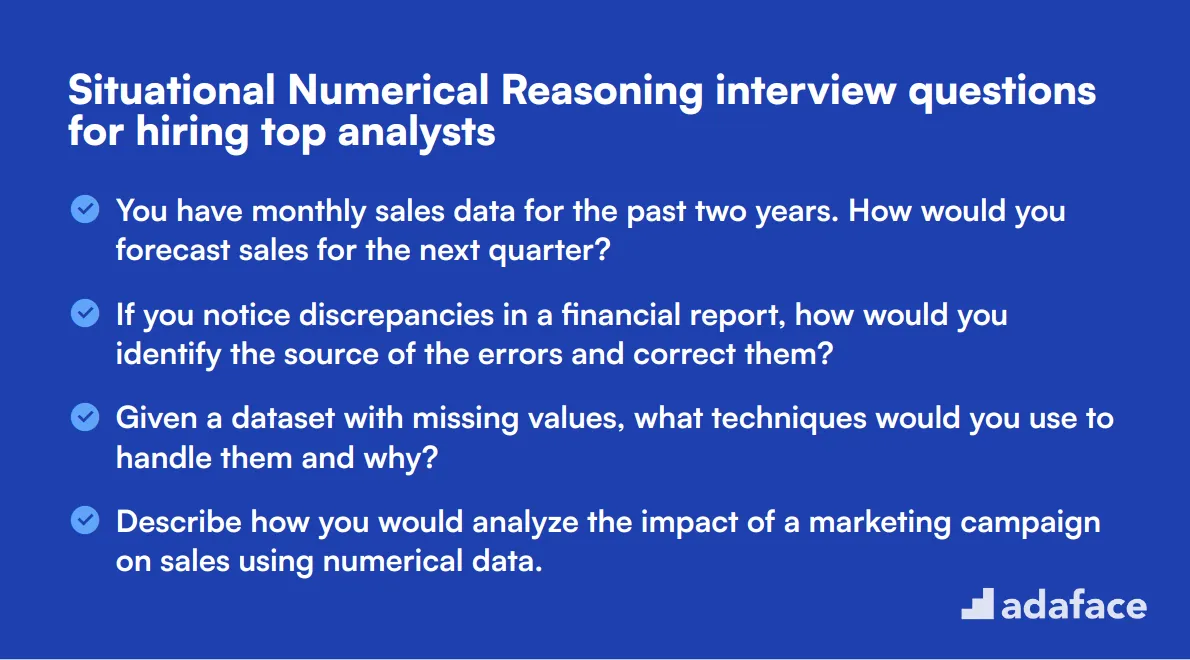
12 situational Numerical Reasoning interview questions for hiring top analysts
To identify top analysts for your team, use these situational numerical reasoning questions in your interviews. These questions will help you gauge analytical skills in real-world scenarios, ensuring candidates can handle complex data-driven tasks. For more insights on hiring the right talent, check out this data analyst job description.
- You have monthly sales data for the past two years. How would you forecast sales for the next quarter?
- A company's profit margin decreased from 20% to 15%. What could be the potential reasons and how would you investigate them?
- If you notice discrepancies in a financial report, how would you identify the source of the errors and correct them?
- Given a dataset with missing values, what techniques would you use to handle them and why?
- Describe how you would analyze the impact of a marketing campaign on sales using numerical data.
- If you have to choose between two investment opportunities, how would you compare their potential returns and risks?
- A dataset shows a downward trend in customer satisfaction scores. How would you investigate the underlying causes?
- Explain the steps you would take to evaluate the financial health of a company using its financial statements.
- You are given sales data with seasonal variations. How would you adjust your analysis to account for seasonality?
- If tasked with reducing costs by 10% in a department, how would you identify areas for potential savings?
- A report shows a sudden drop in website traffic. What numerical methods would you use to pinpoint the issue?
- Given the task to optimize inventory levels, how would you use past sales data to forecast future inventory needs?
Which Numerical Reasoning skills should you evaluate during the interview phase?
While a single interview can't assess every aspect of a candidate's numerical reasoning abilities, focusing on core skills is crucial. By evaluating key competencies, interviewers can gain valuable insights into a candidate's potential for success in roles requiring numerical aptitude.
Data Interpretation
Data interpretation is a fundamental skill in numerical reasoning. It involves analyzing and drawing meaningful conclusions from numerical information presented in various formats such as graphs, charts, and tables.
To assess this skill efficiently, consider using a data interpretation test with relevant multiple-choice questions. This approach can help filter candidates based on their ability to interpret numerical data accurately.
During the interview, you can ask targeted questions to evaluate a candidate's data interpretation skills. Here's an example question to consider:
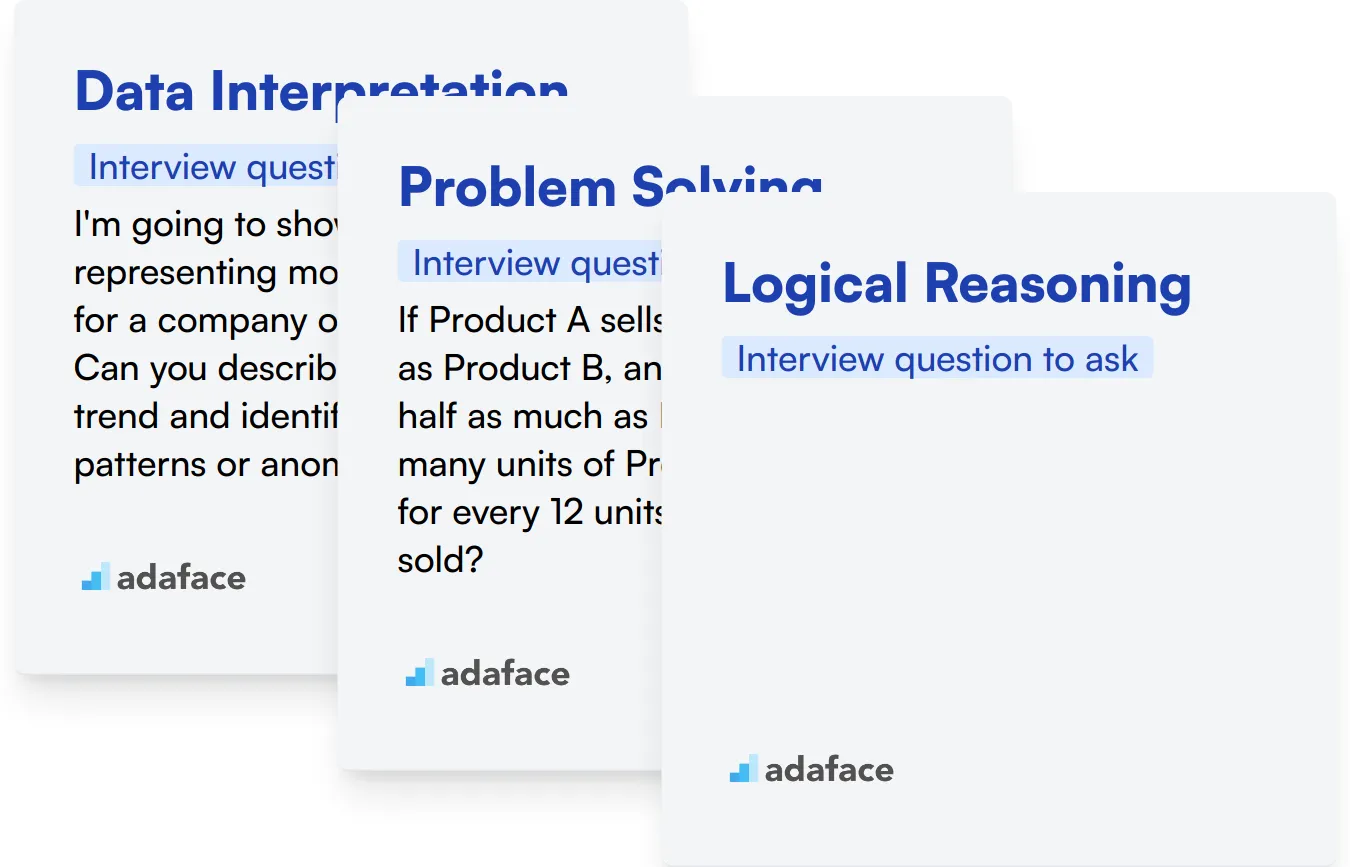
I'm going to show you a bar graph representing monthly sales data for a company over the past year. Can you describe the overall trend and identify any significant patterns or anomalies?
When asking this question, look for the candidate's ability to quickly grasp the main trends, spot any outliers or seasonal patterns, and provide a concise summary of the data. Pay attention to how they articulate their observations and any insights they draw from the information presented.
Problem Solving
Problem-solving is essential in numerical reasoning as it involves applying mathematical concepts to real-world situations. This skill enables candidates to approach complex numerical challenges systematically and find effective solutions.
To evaluate problem-solving abilities, you might consider using a numerical reasoning test that includes scenario-based questions. This can help identify candidates who excel at applying numerical concepts to solve practical problems.
During the interview, you can pose a problem-solving question to assess how candidates approach numerical challenges. Here's an example:
A company needs to reduce its operating costs by 15% to break even. If their current monthly expenses are $100,000, what should be their target monthly expense, and how much do they need to cut?
When evaluating the response, focus on the candidate's approach to solving the problem. Look for their ability to break down the question, perform accurate calculations, and clearly explain their reasoning. Pay attention to any additional insights they might offer, such as suggesting areas where costs could potentially be reduced.
Logical Reasoning
Logical reasoning is crucial in numerical contexts as it involves drawing valid conclusions based on given information. This skill is particularly important when dealing with complex datasets or when making decisions based on numerical evidence.
To assess logical reasoning skills effectively, consider using a logical reasoning test that includes questions designed to evaluate a candidate's ability to draw logical conclusions from numerical premises.
During the interview, you can ask a question that tests the candidate's logical reasoning skills in a numerical context. Here's an example:
If Product A sells twice as much as Product B, and Product C sells half as much as Product B, how many units of Product C are sold for every 12 units of Product A sold?
When assessing the candidate's response, pay attention to their thought process and how they logically work through the problem. Look for their ability to establish relationships between the given information and arrive at the correct conclusion. Also, note how clearly they can explain their reasoning and any assumptions they make along the way.
Enhance Your Hiring Process with Numerical Reasoning Skills Tests and Interview Questions
If you're aiming to hire talent proficient in numerical reasoning, it's important to verify their competencies accurately. Knowing the candidate's skill level ensures they match your organization's needs.
The best method to assess these skills is through specialized tests. Consider using the Numerical Reasoning Test or the Data Interpretation Numerical Reasoning Spatial Reasoning Test to evaluate applicants effectively.
After administering these tests, you can confidently shortlist the most promising candidates. This enables a more focused and insightful interview process, centered on discussing relevant challenges and scenarios.
To initiate your enhanced hiring process, why not start today? Sign up here and discover how Adaface can streamline your recruitment and find the perfect match for your team.
Numerical Reasoning Test
35 mins | 15 MCQs
The pre-employment numerical reasoning test assesses a candidate's ability to work with numbers. The scenario based questions in this test require them to understand numerical data in the form of numbers, tables or graphs, interpret the numbers and underlying relationships and make calculations to solve problems.
Try Numerical Reasoning Test
Download Numerical Reasoning interview questions template in multiple formats
Numerical Reasoning Interview Questions FAQs
What are Numerical Reasoning interview questions?
Numerical Reasoning interview questions assess a candidate's ability to interpret and analyze numerical data, make calculations, and draw logical conclusions from quantitative information.
How can I use Numerical Reasoning questions in interviews?
Use these questions to evaluate candidates' analytical skills, problem-solving abilities, and their capacity to work with numbers and data in job-related scenarios.
Are there different levels of Numerical Reasoning questions?
Yes, this post includes questions for junior, intermediate, and senior analysts, allowing you to tailor your interview to the specific role and experience level.
Can Numerical Reasoning questions help in hiring for finance roles?
Absolutely. The post includes questions related to financial analysis, making them particularly useful for finance-related positions.
How do situational Numerical Reasoning questions differ from others?
Situational questions present real-world scenarios, allowing you to assess how candidates apply their numerical skills to practical workplace challenges.
40 min skill tests.
No trick questions.
Accurate shortlisting.
We make it easy for you to find the best candidates in your pipeline with a 40 min skills test.
Try for freeRelated posts
Free resources

Join 1200+ companies in 80+ countries.
Try the most candidate friendly skills assessment tool today.

40 min tests.
No trick questions.
Accurate shortlisting.
No trick questions.
Accurate shortlisting.