
Basic Google Analytics interview questions
1. What's Google Analytics, in super simple words?
2. Imagine a website is a lemonade stand. How does Google Analytics help the owner?
3. If someone says 'bounce rate,' what does that even mean for a website?
4. What are 'sessions' in Google Analytics? Think of it like a visit to a park.
5. Can you explain the difference between users and sessions, like I'm learning to count?
6. What's a 'conversion' in Google Analytics? Pretend we're talking about turning visitors into happy customers.
7. If a website wants to see where its visitors are coming from, how does Google Analytics help?
8. Why is it important to filter out internal traffic in Google Analytics?
9. What are the different types of goals you can track using Google Analytics?
10. Explain the importance of setting up goals in Google Analytics.
11. Can you describe how Google Analytics tracks user behavior on a website?
12. What's the difference between a dimension and a metric in Google Analytics? Give examples.
13. How would you use Google Analytics to identify underperforming pages on a website?
14. Explain the purpose of the Google Analytics tracking code and how it works.
15. What are some limitations of Google Analytics data?
16. How does Google Analytics handle personally identifiable information (PII)? Why is this important?
17. Describe how you would set up event tracking in Google Analytics to track button clicks.
18. What are some key reports in Google Analytics that you find most useful and why?
19. If a website's traffic suddenly drops, what are some things you would investigate using Google Analytics?
20. How can you use Google Analytics to measure the success of a marketing campaign?
21. Explain the difference between a segment and a filter in Google Analytics.
22. How would you track the performance of different versions of a landing page using Google Analytics?
23. Can you explain how attribution modeling works in Google Analytics, and why it's important?
24. If a client asks you to improve their website's engagement, what Google Analytics metrics would you focus on?
Intermediate Google Analytics interview questions
1. How would you track user engagement on a single-page application using Google Analytics?
2. Explain how you would set up cross-domain tracking in Google Analytics.
3. Describe how you would use calculated metrics to derive insights beyond standard GA metrics.
4. How do you identify and troubleshoot data discrepancies between Google Analytics and other data sources?
5. Explain how you would use Google Tag Manager to implement custom event tracking.
6. Describe a scenario where you would use segments in Google Analytics, and explain the steps to create them.
7. How would you use regular expressions in Google Analytics to filter data in reports?
8. Explain how you would configure goal tracking for a lead generation form on a website.
9. Describe how you would use the Behavior Flow report to identify drop-off points in the user journey.
10. How would you analyze website performance using landing page reports and identify areas for improvement?
11. Explain how you would use Google Analytics to measure the effectiveness of an email marketing campaign.
12. Describe how you would set up and use custom dimensions to track user attributes.
13. How would you use the User Explorer report to analyze individual user behavior?
14. Explain how you would use Google Analytics to track the performance of internal promotions on a website.
15. Describe how you would use the content grouping feature to analyze website content performance.
16. How would you set up event tracking for video views and interactions on a website?
17. Explain how you would use the multi-channel funnel reports to understand the customer journey.
18. Describe how you would use the attribution modeling tool to evaluate the impact of different marketing channels.
19. How can you use Google Analytics to understand if website changes impacted conversion rate?
20. Explain how you would use the custom reports feature to create specific reports tailored to business needs.
21. Describe your approach to auditing a Google Analytics setup to ensure data accuracy and completeness.
22. How would you identify and address bot traffic in Google Analytics?
Advanced Google Analytics interview questions
1. How would you track user engagement on a single-page application using Google Analytics?
2. Explain how you would implement cross-domain tracking in Google Analytics and why it's important.
3. Describe a scenario where you would use custom dimensions and metrics, and how you would set them up.
4. How do you handle personally identifiable information (PII) in Google Analytics to comply with privacy regulations?
5. What are some strategies for dealing with bot traffic in Google Analytics?
6. How would you use Google Tag Manager in conjunction with Google Analytics to track specific user interactions?
7. Explain how you would analyze user behavior using cohort analysis in Google Analytics.
8. Describe your process for auditing a Google Analytics setup to identify potential issues and areas for improvement.
9. How would you measure the impact of a website redesign on key performance indicators (KPIs) using Google Analytics?
10. Explain how you can use the Measurement Protocol to send data to Google Analytics from sources other than a website or app.
11. How would you use Google Analytics to track the effectiveness of an email marketing campaign?
12. Describe how you would implement event tracking to measure video views on a website.
13. How would you analyze the customer journey across multiple devices using Google Analytics?
14. Explain how you can use the User ID feature in Google Analytics to track users across different sessions and devices.
15. How would you troubleshoot discrepancies between data in Google Analytics and other data sources?
16. Describe how you would use Google Analytics to identify and address website performance issues that impact user experience.
17. How would you segment users based on their engagement with specific website features?
18. Explain how you can use the Content Grouping feature in Google Analytics to analyze website content performance.
19. How would you measure the success of a content marketing campaign using Google Analytics?
20. Describe your approach to creating custom dashboards and reports in Google Analytics to meet specific business needs.
21. How would you use Google Analytics to optimize a website's conversion funnel?
22. Explain how you can use the Enhanced Ecommerce feature in Google Analytics to track online sales performance.
23. How would you use Google Analytics to understand the impact of social media marketing efforts on website traffic and conversions?
24. Describe how you would implement and analyze A/B tests using Google Analytics and Google Optimize.
25. How would you approach analyzing a sudden drop in website traffic reported by Google Analytics?
26. Imagine a client wants to track how many users download a PDF from their site. How would you set this up using Google Analytics and Tag Manager?
Expert Google Analytics interview questions
1. How would you approach setting up Google Analytics for a brand new website with a complex user journey and multiple conversion points?
2. Imagine a scenario where data discrepancies arise between Google Analytics and your internal database. How would you investigate and resolve these discrepancies?
3. Can you describe your experience with implementing and utilizing the Google Analytics API for custom reporting or data integration purposes?
4. How would you design a comprehensive A/B testing strategy using Google Optimize and Google Analytics to improve website conversion rates?
5. Let's say a client wants to track user engagement with embedded videos on their website. How would you configure Google Analytics to capture meaningful video interaction data?
6. Explain your process for identifying and mitigating bot traffic or spam referrals in Google Analytics to ensure data accuracy.
7. How would you leverage Google Analytics data to build predictive models for forecasting website traffic or user behavior?
8. Describe a time when you had to troubleshoot a complex Google Analytics implementation issue. What steps did you take to diagnose and resolve the problem?
9. How would you approach measuring the impact of offline marketing campaigns (e.g., print ads, events) on website traffic and online conversions using Google Analytics?
10. Can you explain the differences between session-scoped, user-scoped, and hit-scoped custom dimensions in Google Analytics, and provide examples of when you would use each?
11. How would you use Google Analytics to analyze the effectiveness of different content marketing strategies (e.g., blog posts, ebooks, infographics) in driving website engagement and lead generation?
12. Describe your experience with setting up and using Enhanced Ecommerce tracking in Google Analytics to measure product performance and sales funnel metrics.
13. How would you approach auditing an existing Google Analytics setup to identify areas for improvement and ensure data quality?
14. Let's say a client wants to understand the cross-device behavior of their users. How would you configure Google Analytics to track users across multiple devices and browsers?
15. Explain your understanding of the Google Analytics data processing pipeline, from data collection to reporting, and how it impacts data accuracy and availability.
16. How would you leverage Google Analytics data to personalize website content and user experiences based on user behavior and preferences?
17. Describe your experience with using Google Analytics segments to analyze specific user groups or cohorts and identify trends and patterns in their behavior.
18. How would you approach measuring the impact of website redesigns or major updates on website traffic, user engagement, and conversion rates using Google Analytics?
19. Can you explain the concept of attribution modeling in Google Analytics, and how you would choose the most appropriate attribution model for a specific marketing campaign?
20. How would you use Google Analytics to identify and address website performance issues that are impacting user experience and conversion rates?
21. Describe your experience with using Google Tag Manager to implement and manage Google Analytics tracking code and other marketing tags on a website.
22. How would you approach measuring the effectiveness of internal site search in helping users find the information they need on a website?
23. Can you explain the GDPR implications for Google Analytics and how to ensure compliance with data privacy regulations?
24. How would you use Google Analytics data to inform decisions about website navigation and information architecture?
25. Describe a situation where you had to present complex Google Analytics data to a non-technical audience. How did you communicate the insights effectively?
26. How would you use Google Analytics to evaluate the success of a mobile app marketing campaign?
27. How would you define and measure customer lifetime value (CLTV) using Google Analytics data?

Hiring for Google Analytics roles can be challenging. You need to ensure candidates possess the technical skills and analytical mindset to translate data into actionable insights, similar to hiring web analysts.
This blog post provides a curated list of Google Analytics interview questions, covering basic to expert levels, along with multiple-choice questions (MCQs).
By using these questions, you can effectively evaluate a candidate's Google Analytics skills; you can also use our Google Analytics Test to streamline the assessment process before the interview.
Table of contents
Basic Google Analytics interview questions
Intermediate Google Analytics interview questions
Advanced Google Analytics interview questions
Expert Google Analytics interview questions
Google Analytics MCQ
Which Google Analytics skills should you evaluate during the interview phase?
3 Tips for Maximizing Your Google Analytics Interview Process
Evaluate Google Analytics Skills with Precision
Download Google Analytics interview questions template in multiple formats
Basic Google Analytics interview questions
1. What's Google Analytics, in super simple words?
Google Analytics is like a website traffic counter. It tells you who visits your site, how long they stay, and what they click on. It helps you understand what's working and what's not so you can improve your website.
2. Imagine a website is a lemonade stand. How does Google Analytics help the owner?
Google Analytics is like the lemonade stand owner's observation notebook. It helps them understand how people are interacting with their stand (website). For example, the owner can track:
- How many people visit the stand (website traffic).
- Where they came from (referral sources).
- Which lemonade flavors are most popular (popular pages).
- How long people stay at the stand (time on site).
- Where people are leaving without buying anything (bounce rate/exit pages).
With this data, the owner can improve the lemonade stand by optimizing the stand's layout (website design), advertising more effectively, stocking up on popular flavors (content optimization), and fixing any issues that are causing customers to leave. It's all about data-driven decisions.
3. If someone says 'bounce rate,' what does that even mean for a website?
Bounce rate is the percentage of visitors who enter the site and then leave ('bounce') without viewing any other pages. A high bounce rate often indicates that the landing page isn't relevant to the visitor's search query or that the website has design or usability issues. It's calculated as (Total number of single-page sessions / Total number of sessions) * 100.
Essentially, it's a measure of how well your website captures the attention of its visitors. A lower bounce rate is generally preferred, implying that users are finding what they need and exploring more of your site.
4. What are 'sessions' in Google Analytics? Think of it like a visit to a park.
In Google Analytics, a session represents a single visit to your website. Think of it like a visit to a park: a session begins when someone enters the park (your website) and ends when they leave (or after a period of inactivity). By default, a session automatically closes after 30 minutes of inactivity.
More specifically, a session is a group of user interactions with your website that take place within a given timeframe. These interactions can include pageviews, events, transactions, and more. Google Analytics uses sessions to calculate important metrics such as session duration, pages per session, and bounce rate, providing insights into user behavior and engagement.
5. Can you explain the difference between users and sessions, like I'm learning to count?
Imagine you're counting people entering a room. A user is like a specific person. They have a name, or maybe a unique identifier. It's about who they are. A session is like that person's visit to the room. It's about when they came in, how long they stayed, and what they did while they were there. One user can have many sessions, maybe they visit the room every day.
Technically speaking, a session is a period of interaction a user has with a website or application. The website uses cookies or other methods to track that session, usually assigning it a session ID. When the user leaves or after some time of inactivity, the session is over and may be deleted. A user, however, remains a user regardless of whether they are actively using the website or not.
6. What's a 'conversion' in Google Analytics? Pretend we're talking about turning visitors into happy customers.
In Google Analytics, a 'conversion' is a completed activity that's important to the success of your business. Think of it as a visitor achieving a goal that you've set. In the context of turning visitors into happy customers, a conversion could be several things:
- A purchase is made on your e-commerce site.
- A user submits a lead form requesting more information.
- Someone signs up for a newsletter or creates an account.
- A visitor spends a certain amount of time on the site, indicating engagement.
- A user views a key page, such as a pricing page. Basically, it's any action that shows the visitor is moving closer to becoming a customer.
7. If a website wants to see where its visitors are coming from, how does Google Analytics help?
Google Analytics provides website owners with detailed insights into their website traffic, including the sources of their visitors. It helps determine where visitors are coming from by tracking referral data. This data reveals which websites, search engines (like Google, Bing, etc.), social media platforms, or marketing campaigns are driving traffic to the website.
Specifically, Google Analytics identifies traffic sources through several channels, such as:
- Organic Search: Visitors who found the website through search engine results.
- Referral: Visitors who clicked on a link to the website from another website.
- Direct: Visitors who typed the website's address directly into their browser or used a bookmark.
- Social: Visitors who came from social media platforms.
- Paid Search: Visitors who came from paid advertising campaigns (e.g., Google Ads).
By analyzing this data, website owners can understand which channels are most effective at attracting visitors and optimize their marketing efforts accordingly.
8. Why is it important to filter out internal traffic in Google Analytics?
Filtering out internal traffic in Google Analytics is crucial for obtaining accurate and reliable data about real user behavior on your website. Internal traffic (visits from employees, developers, or testing teams) can skew your analytics, leading to misinterpretations of key metrics such as bounce rate, session duration, conversion rates, and page views.
By removing internal traffic, you ensure that your Google Analytics reports reflect the actions of your actual audience, allowing you to make informed decisions about website optimization, marketing strategies, and user experience improvements. This leads to better resource allocation and a clearer understanding of user journeys.
9. What are the different types of goals you can track using Google Analytics?
Google Analytics allows tracking goals that fall into several categories based on user behavior. These generally are:
- Destination Goals: Triggered when a user reaches a specific page (e.g., a thank-you page after form submission).
- Duration Goals: Activated when a user spends a certain amount of time on your site or app.
- Pages/Screens per session Goals: Tracked when a user views a specific number of pages or screens during a single session.
- Event Goals: Triggered by specific actions or events like playing a video, downloading a file, or clicking a button. Events are customizable using
gtag.jsor Google Tag Manager, allowing you to track almost any user interaction.
10. Explain the importance of setting up goals in Google Analytics.
Setting up goals in Google Analytics is crucial because it allows you to measure the success of your website and marketing efforts. Goals define specific actions you want users to take, such as submitting a form, making a purchase, or spending a certain amount of time on a page. By tracking these actions as goals, you can quantify how well your website is achieving its objectives. Without goals, you're just looking at traffic and basic metrics, making it difficult to understand what's working and what isn't.
Specifically, goals enable you to calculate conversion rates (the percentage of visitors who complete a goal), identify high-performing content and channels, and optimize your website for better results. The insights derived from goal tracking inform data-driven decisions, leading to improved ROI and a more effective online presence. They provide actionable data for making improvements.
11. Can you describe how Google Analytics tracks user behavior on a website?
Google Analytics tracks user behavior primarily through JavaScript code embedded in a website's pages. When a user visits a page with the Google Analytics tracking code, the code executes, collecting data about the user's interaction, such as page views, session duration, bounce rate, and events triggered (e.g., button clicks, form submissions). This data is then sent to Google Analytics servers.
The tracking code uses cookies to identify unique users across multiple sessions. It also collects information about the user's browser, operating system, device, and network. All of this data allows website owners to analyze user behavior patterns, understand their audience, and optimize their website for better performance and user experience.
12. What's the difference between a dimension and a metric in Google Analytics? Give examples.
In Google Analytics, dimensions are descriptive attributes or characteristics of your data. They are qualitative values that can be segmented and analyzed. Examples include: city, browser, pageTitle, and deviceCategory.
Metrics, on the other hand, are quantitative measurements. They represent the numerical values associated with dimensions. Examples of metrics are: sessions, pageviews, users, and bounceRate. In essence, you analyze how much (metric) of what (dimension) occurred.
13. How would you use Google Analytics to identify underperforming pages on a website?
To identify underperforming pages using Google Analytics, I would primarily focus on several key metrics. First, I'd examine the Bounce Rate. A high bounce rate often indicates that users are landing on a page and immediately leaving, suggesting the content isn't engaging or relevant. I'd also look at Exit Rate. Pages with a high exit rate are where users are leaving the site, and identifying these can reveal pain points in the user journey. I would analyze Time on Page to see how long users are spending on a page; low time spent can signify disinterest. Finally, I'd monitor Conversion Rate on goal-oriented pages like product pages or sign-up forms. Low conversion rates mean the page isn't effectively achieving its purpose.
To take this analysis further, I would segment the data to understand why pages are underperforming. For example, are mobile users experiencing a higher bounce rate than desktop users? Are specific traffic sources sending unqualified visitors? Examining these segments can provide actionable insights for improving page performance. Based on these insights, I would then conduct A/B testing to test different strategies for improvement and validation.
14. Explain the purpose of the Google Analytics tracking code and how it works.
The Google Analytics tracking code is a snippet of JavaScript code that you add to your website to collect data about user behavior. Its primary purpose is to track website traffic, user interactions, and conversions, providing valuable insights into how visitors engage with your site.
When a user visits a page with the tracking code installed, the code executes in their browser. It collects information such as the user's IP address, browser type, operating system, pages visited, and actions taken (e.g., clicks, form submissions). This data is then sent to Google Analytics servers for processing and reporting, enabling website owners to analyze trends, optimize content, and improve the overall user experience. The code uses cookies to identify unique users across multiple sessions. It can be implemented using Google Tag Manager as well.
15. What are some limitations of Google Analytics data?
Google Analytics data has several limitations. A significant one is its reliance on JavaScript and cookies. Users who disable JavaScript or block cookies will not be tracked, leading to incomplete data collection. Additionally, data sampling can occur in high-traffic scenarios, providing only an estimated view of user behavior rather than precise figures.
Privacy regulations like GDPR and CCPA also impact data collection. To comply, IP anonymization is often enabled, which reduces data granularity. Furthermore, Google Analytics primarily captures website and app data, offering limited insights into offline conversions or interactions occurring on other platforms. Finally, attribution modeling in Google Analytics can be complex and may not accurately reflect the true customer journey.
16. How does Google Analytics handle personally identifiable information (PII)? Why is this important?
Google Analytics prohibits sending PII. This includes things like names, email addresses, social security numbers, phone numbers, and precise location data. They implement various mechanisms to prevent PII collection, including data redaction and policies against its storage. If PII is detected, Google Analytics' terms of service dictate that the data may be deleted.
This is important for several reasons, primarily related to privacy regulations (like GDPR and CCPA) and user trust. Collecting and storing PII without proper consent and security measures can lead to severe legal and reputational consequences. Failure to comply with these regulations can result in hefty fines and loss of user trust. Protecting user privacy is also simply the right thing to do.
17. Describe how you would set up event tracking in Google Analytics to track button clicks.
To track button clicks in Google Analytics, I'd use Google Tag Manager (GTM). First, I'd create a new tag in GTM. I'd select 'Google Analytics: GA4 Event' as the tag type, and configure the event name (e.g., 'button_click') and any relevant event parameters (e.g., 'button_text', 'page_location').
Next, I would set up a trigger. I would choose 'Click - All Elements' or 'Click - Just Links' (depending on the button implementation). Then, I'd configure the trigger to fire only when specific conditions are met, such as the button's id or class. For example, I might set it to fire when Click Element matches CSS selector #my-button. Finally, I'd test the setup in GTM's preview mode and publish the changes. In GA4, I'd check the 'Events' report and mark the event as a conversion if needed.
18. What are some key reports in Google Analytics that you find most useful and why?
Some key Google Analytics reports I find most useful are the Acquisition reports, particularly the Source/Medium report. This helps me understand where my website traffic is coming from (e.g., Google organic search, social media, email marketing) and the effectiveness of different marketing channels. This is crucial for optimizing marketing spend and strategies.
Another essential report is the Behavior > Site Content > All Pages report. This provides insights into the most popular pages on the website, bounce rates, and exit pages. Identifying high-bounce pages can highlight areas where content or user experience needs improvement, ultimately leading to a better user journey and higher conversion rates. The Conversions > Goals section is also critical for tracking progress against defined objectives.
19. If a website's traffic suddenly drops, what are some things you would investigate using Google Analytics?
First, I'd verify that Google Analytics is still properly installed and collecting data across all pages. Then, I'd examine the following in Google Analytics:
- Audience Overview: Check for overall traffic trends, comparing the drop-off period to previous periods (e.g., week over week, month over month). Look at metrics like users, sessions, pageviews, bounce rate, and session duration to pinpoint anomalies.
- Acquisition Channels: Identify which traffic sources (organic search, direct, referral, social, paid) are contributing most to the decline. A drop in organic search could signal SEO issues; a paid traffic drop might indicate campaign problems.
- Landing Pages: See if specific pages are experiencing significant traffic declines. This can highlight problems with specific content or user flows.
- Geographic Reports: Determine if the traffic drop is isolated to a particular region.
- Mobile vs. Desktop: Check if the drop is more pronounced on mobile or desktop devices.
- Real-Time Reports: Useful to confirm if there's any current traffic, as a basic validation step.
I'd also investigate external factors like recent website changes, marketing campaign alterations, algorithm updates from search engines (especially for organic search decline), and competitor activities.
20. How can you use Google Analytics to measure the success of a marketing campaign?
To measure the success of a marketing campaign using Google Analytics, you can track key metrics and compare them against your campaign goals. Define your campaign goals beforehand (e.g., increased website traffic, lead generation, sales). Then, use Google Analytics to monitor relevant metrics such as:
- Traffic Sources: Identify the channels driving traffic to your website as a result of the campaign (e.g., social media, email, paid advertising).
- Landing Page Performance: Analyze the bounce rate, time on page, and conversion rate of the landing pages associated with your campaign.
- Conversions: Track the number of conversions (e.g., form submissions, purchases) directly attributed to the campaign.
- Goal Completion: Set up specific goals in Google Analytics that align with your campaign objectives and monitor their completion rate.
- Campaign ROI: Calculate the return on investment by comparing the cost of the campaign to the revenue generated or value obtained from conversions.
By analyzing these metrics, you can determine if your campaign is achieving its objectives and identify areas for improvement.
21. Explain the difference between a segment and a filter in Google Analytics.
In Google Analytics, both segments and filters are used to refine data, but they operate at different stages and serve different purposes.
Filters permanently modify the data collected in a specific view. They are applied before the data is stored, so any data excluded by a filter is lost forever. Segments, on the other hand, are non-destructive. They are applied after the data has been processed and allow you to isolate and analyze specific subsets of your data without altering the underlying dataset. You can create multiple segments to compare different user behaviors or traffic sources, and easily remove them to see the full picture.
22. How would you track the performance of different versions of a landing page using Google Analytics?
To track the performance of different landing page versions in Google Analytics, I'd primarily use A/B testing, also known as split testing. First, I'd implement Google Optimize (or a similar A/B testing tool that integrates with Google Analytics). Then I would create different versions of the landing page within Optimize. Each version will have a different variation (e.g., headline, image, call-to-action). Next, I configure Google Optimize to split traffic evenly (or according to a specified distribution) between the different versions.
Google Analytics automatically tracks metrics like bounce rate, conversion rate, time on page, and page views for each version. By setting up clear goals in Google Analytics (e.g., form submissions, purchases) and linking them to the Optimize experiment, I can directly compare the performance of each version and determine which one performs best based on statistically significant results. After the experiment concludes, Google Optimize will identify the winning variation, and it will be deployed to all users. The results are clearly presented in Google Analytics, allowing for data-driven decisions on landing page optimization.
23. Can you explain how attribution modeling works in Google Analytics, and why it's important?
Attribution modeling in Google Analytics is the process of assigning credit for conversions to different touchpoints in a user's journey. It helps you understand which marketing channels and campaigns are most effective at driving desired outcomes, such as sales or leads. Different models exist, like 'Last Click' (giving all credit to the last interaction before conversion), 'First Click' (giving all credit to the first interaction), 'Linear' (distributing credit evenly across all touchpoints), and 'Time Decay' (giving more credit to recent interactions). Data-driven attribution uses machine learning to determine the actual contribution of each touchpoint.
Attribution modeling is important because it provides a more accurate view of your marketing performance than simply relying on the last click. This allows you to optimize your campaigns, allocate your budget more effectively, and improve your return on investment. Without proper attribution, you may be under or overvaluing certain marketing activities, leading to inefficient spending and missed opportunities for growth.
24. If a client asks you to improve their website's engagement, what Google Analytics metrics would you focus on?
I'd focus on several key Google Analytics metrics to understand and improve website engagement. First, I would look at Bounce Rate to see if users are leaving the site immediately without interacting. A high bounce rate suggests issues with landing page relevance or usability. Next, Session Duration and Pages per Session are crucial for understanding how long users stay on the site and how deeply they explore. Low numbers indicate a lack of engaging content or poor site navigation. Event tracking can measure specific interactions like video plays, button clicks, and form submissions, providing granular insights into user behavior. Finally, I would analyze Conversion Rate (if applicable) to see if engagement is leading to desired actions, and optimize for conversions. Analyzing exit pages can show where users are leaving the site, highlighting possible problem areas.
Intermediate Google Analytics interview questions
1. How would you track user engagement on a single-page application using Google Analytics?
To track user engagement on a single-page application (SPA) with Google Analytics, you'll primarily use virtual pageviews and event tracking. Since SPA navigation doesn't trigger traditional page loads, virtual pageviews are essential. You trigger them whenever the user navigates to a new section or state within the application, for example:
gtag('config', 'GA_TRACKING_ID', {'page_path': '/new-page'});
For more granular engagement metrics, utilize event tracking to record specific user interactions like button clicks, form submissions, video plays, or downloads. This provides insights beyond just page views. For example:
gtag('event', 'button_click', { 'event_category': 'navigation', 'event_label': 'go_to_dashboard' });
2. Explain how you would set up cross-domain tracking in Google Analytics.
To set up cross-domain tracking in Google Analytics, you need to modify the Google Analytics tracking code on all domains you want to track as a single user session. First, configure your Google Analytics property to include all the domains in the referral exclusion list. This prevents sessions from different domains being counted as separate sessions.
Then, modify the Google Analytics tracking code on each domain to enable cross-domain tracking. This typically involves adding code to the gtag('config', 'UA-XXXXX-Y', { ... }); call to configure the cookie_domain and linker parameters. Specifically, cookie_domain: 'auto' is often used, and linker: { 'domains': ['domain1.com', 'domain2.com'] } specifies the domains to track. In many cases, the allowLinker: true parameter may also be required. This enables parameters to be passed between domains, stitching the user session together. Ensure consistent implementations across all tracked domains. Verify setup in Google Analytics real-time reports.
3. Describe how you would use calculated metrics to derive insights beyond standard GA metrics.
Calculated metrics in Google Analytics allow for creating custom metrics derived from existing standard metrics, unlocking deeper insights. For example, bounce rate is standard, but 'Engaged Bounce Rate' (bounces > X seconds) reveals if short bounces are actually valuable visits. Similarly, 'Conversion Rate per User' is more meaningful than overall conversion rate, pinpointing user conversion patterns, and better segment analysis. Calculated metrics facilitate creating ratios or differences that highlight performance nuances not visible through standard reporting.
Specifically, I can combine metrics like 'Revenue' and 'Sessions' to create a metric called 'Revenue per Session'. This is better than just looking at overall revenue as you can track which marketing campaigns are providing more qualified traffic. You could also calculate 'Customer Lifetime Value' by combining 'Revenue' and 'Number of Transactions' with additional data from an external source imported via data import. This would give a holistic view of the average value a customer brings over time.
4. How do you identify and troubleshoot data discrepancies between Google Analytics and other data sources?
To identify and troubleshoot data discrepancies between Google Analytics and other data sources, I would first define the key metrics to compare (e.g., sessions, transactions, revenue). Then, I'd ensure consistent definitions across platforms, checking for differences in attribution models, time zones, and filters. I would then systematically check data collection setup, including tag implementation and event tracking. For example, a common discrepancy with revenue is failing to correctly implement the ecommerce tracking. Verify that the dataLayer object is correctly set up for your ecommerce platform.
Next, I would investigate potential data processing differences. Google Analytics uses sampling, so comparing against unsampled data is necessary. I would segment data to isolate the source of discrepancies (e.g., by browser, device, or campaign). Tools such as Google Tag Assistant, browser developer tools, and GA Debugger can help validate data collection. I would also compare against exported raw data where possible. Code review, especially where custom tracking is involved, is helpful in uncovering errors like typos in event names or incorrect data being pushed to the dataLayer.
5. Explain how you would use Google Tag Manager to implement custom event tracking.
To implement custom event tracking with Google Tag Manager (GTM), I'd first define the events I want to track (e.g., button clicks, form submissions). Then, within GTM, I would create a new tag. This tag would be configured to send an event to Google Analytics (or another analytics platform). The tag type would typically be 'Google Analytics: Universal Analytics' or 'Google Analytics: GA4 Event'. I would set the track type to 'Event' and then define the Category, Action, and Label (and optionally Value) for the event.
Next, I'd create a trigger to fire the tag when the specific event occurs. This could be a click trigger configured to fire on clicks of a specific button (using CSS selectors or click classes) or a custom event trigger that listens for a dataLayer.push() event. For example, if my javascript code has dataLayer.push({'event': 'formSubmission'}), then, my trigger would be based on 'Custom Event' and set the 'Event name' as 'formSubmission'. Finally, I'd test the implementation using GTM's preview mode to ensure the events are firing correctly and appearing in Google Analytics.
6. Describe a scenario where you would use segments in Google Analytics, and explain the steps to create them.
I would use segments in Google Analytics to analyze the behavior of users who visited a specific landing page from a recent marketing campaign. This allows me to isolate and understand the effectiveness of that campaign. For example, I want to see the conversion rate and bounce rate of only users who landed on /campaign-page from an email promotion. This is a much better alternative to looking at all users.
To create this segment:
- Navigate to the desired report in Google Analytics (e.g., Acquisition > All Traffic > Source/Medium).
- Click "+ Add Segment".
- Click "+ New Segment".
- Give the segment a descriptive name (e.g., "Campaign Landing Page Visitors").
- Go to "Conditions".
- Set "Include" users where "Page" exactly matches
/campaign-pageand "Source/Medium" containsemail(assuming your email campaign is tagged correctly). - Save the segment. Now you can analyze the data only for those visitors.
7. How would you use regular expressions in Google Analytics to filter data in reports?
Regular expressions in Google Analytics allow for flexible and powerful filtering of data in reports. They are used to match patterns in dimensions like page URLs, event categories, and user attributes. You can use regex in the filters of custom reports, segments, goals, and audiences.
For example, to filter for page URLs containing either "/blog/" or "/news/", you would use the regex /blog/|/news/. Common regex operators include . (any character), * (zero or more occurrences), + (one or more occurrences), ? (zero or one occurrence), ^ (start of string), $ (end of string), and | (or). Using these operators effectively lets you create precise filters to isolate specific data sets for analysis. Remember to escape special characters like / using \/.
8. Explain how you would configure goal tracking for a lead generation form on a website.
To configure goal tracking for a lead generation form, I'd use a web analytics platform like Google Analytics. First, I'd set up a destination goal triggered when a user reaches a specific 'thank you' page after submitting the form. Alternatively, I could implement an event goal. This involves setting up an event listener (using JavaScript) on the form submission. The event listener would push an event to Google Analytics upon successful form submission.
For event goals, I'd define categories (e.g., 'Form'), actions (e.g., 'Submit'), and labels (e.g., form name) in Google Analytics. Then, I'd configure the JavaScript code to push these events. This approach allows more granular tracking, such as tracking individual form fields or submission errors. Code example:
ga('send', 'event', 'Form', 'Submit', 'Contact Form');
9. Describe how you would use the Behavior Flow report to identify drop-off points in the user journey.
The Behavior Flow report visually maps the paths users take through a website or app. To identify drop-off points, I would analyze the nodes (representing pages or events) and the connections between them. Significant drops in traffic flow between nodes indicate areas where users are abandoning the journey.
Specifically, I'd look for nodes with high entrance rates but low exit rates to subsequent nodes. Clicking on the connection (the line between nodes) allows you to highlight the traffic through that specific path. Observing at which points the number of users falls drastically helps to pinpoint the problematic steps. This information can then be used to investigate and improve those specific pages or processes.
10. How would you analyze website performance using landing page reports and identify areas for improvement?
To analyze website performance using landing page reports, I'd start by identifying key metrics like bounce rate, conversion rate, time on page, and exit rate for each landing page. Then, I'd segment the data by traffic source (e.g., organic, paid, social) to understand how different channels perform. High bounce rates often indicate issues with page relevance or loading speed. Low conversion rates suggest problems with the call to action, form design, or overall user experience. Pages with short time on page might have irrelevant content or poor readability. Analyzing exit pages can point to areas where users are dropping off unexpectedly.
Based on these insights, I'd prioritize areas for improvement. For example, if a landing page has a high bounce rate for mobile users, I'd focus on optimizing the mobile experience. If conversion rates are low, I'd A/B test different headlines, copy, or call-to-action buttons. Tools like Google Analytics, Hotjar (for heatmaps and session recordings), and Google PageSpeed Insights (for performance analysis) are extremely helpful in pinpointing specific problems and tracking the impact of changes.
11. Explain how you would use Google Analytics to measure the effectiveness of an email marketing campaign.
To measure the effectiveness of an email marketing campaign using Google Analytics, I would focus on tracking user behavior after they click links within the email. First, I would use UTM parameters (e.g., utm_source, utm_medium, utm_campaign) to tag all URLs within the email. This allows Google Analytics to accurately attribute website traffic and conversions to the specific email campaign. Key metrics to monitor include the number of sessions originating from the email campaign, bounce rate of those sessions, pages per session, session duration, and most importantly, goal completions (e.g., form submissions, purchases).
By analyzing these metrics in Google Analytics, I can assess the campaign's success. For example, a high bounce rate might indicate that the landing page is not relevant to the email content. Low conversion rates could suggest issues with the landing page design or the offer itself. Comparing results across different email campaigns (using the utm_campaign parameter) helps to identify which strategies are most effective. Ultimately, this data informs optimizations to improve future email campaigns.
12. Describe how you would set up and use custom dimensions to track user attributes.
To set up custom dimensions, first, define the dimension in your analytics platform (e.g., Google Analytics, Adobe Analytics). This involves giving it a name and scope (user, session, hit, or product). The scope determines how broadly the attribute applies. For user attributes, I would typically use 'user' scope. In Google Analytics, this is done via the admin interface under 'Custom Definitions'.
Next, I would implement code to populate the custom dimension with the relevant user attribute value. For example, if I wanted to track a user's subscription level, I would set the custom dimension value in my application's tracking code when the user logs in or changes their subscription. In Google Analytics using gtag.js, the code would look like this:
gtag('config', 'GA_TRACKING_ID', {
 'custom_map': {
 'dimension1': 'subscription_level'
 }
});
gtag('event', 'login', { 'subscription_level': 'premium' });
Finally, the data is available in reports allowing segmentation and analysis based on these attributes.
13. How would you use the User Explorer report to analyze individual user behavior?
The User Explorer report in tools like Google Analytics allows you to drill down into the actions of individual users on your website or app. To analyze individual user behavior, you can start by identifying users based on their Client ID or User ID. Then, examine the timeline of events for a specific user to understand their journey through your site. This includes the pages they visited, the actions they took (e.g., button clicks, form submissions), and the time spent on each page.
By analyzing these individual user journeys, you can identify patterns in user behavior, troubleshoot issues users might be encountering (e.g., drop-off points in a funnel), and understand how different user segments interact with your content. You can also use this information to personalize the user experience and optimize your website or app for better engagement and conversions. For example, if you see many users dropping off at a particular step in a checkout process, you can investigate that step for potential usability problems.
14. Explain how you would use Google Analytics to track the performance of internal promotions on a website.
To track internal promotions using Google Analytics, I'd start by implementing custom event tracking. Each promotion would trigger a specific event when it's displayed (e.g., promotion_view) and when it's clicked (e.g., promotion_click). Event parameters like promotion_id, promotion_name, and promotion_location (where on the site the promo appeared) would be included with each event to provide granular data.
Then, within Google Analytics, I'd create custom reports or dashboards to visualize the data. I'd analyze metrics like event count (impressions), unique event count (unique viewers), and event value (if applicable, e.g., conversion value attributed to the promotion). Funnel analysis could be used to track users who viewed a promotion and subsequently completed a desired action. Goal completions could also be tracked to measure the impact of promotions on key business objectives.
15. Describe how you would use the content grouping feature to analyze website content performance.
Content grouping allows me to analyze website content performance by organizing pages into logical categories. I would first define content groups based on topics, product categories, or other relevant criteria. Then, I'd track metrics like page views, bounce rate, time on page, and conversion rates for each content group.
By comparing the performance of different content groups, I can identify which topics resonate most with users, which groups have engagement issues, and which ones drive the most conversions. This insight helps inform content strategy, identify content gaps, and optimize existing content to improve overall website performance.
16. How would you set up event tracking for video views and interactions on a website?
To track video views and interactions, I'd use a combination of JavaScript and a web analytics platform like Google Analytics or Mixpanel. I'd embed JavaScript event listeners to capture events such as video start, pause, play, complete, and any custom interactions like volume changes or seeking. These events would then be sent as data to the analytics platform. window.dataLayer.push({'event': 'videoStarted', 'videoTitle': 'MyVideo'});
Specifically, I'd listen for play, pause, ended events to track the video lifecycle. To understand user engagement, I'd also track time watched using currentTime attribute periodically using setInterval, and send custom events for key milestones (e.g., '25% viewed', '50% viewed'). These event data provide insights into how users are interacting with the videos, which can be used to improve the content and user experience.
17. Explain how you would use the multi-channel funnel reports to understand the customer journey.
Multi-Channel Funnel reports in Google Analytics (or similar platforms) help visualize the various touchpoints a customer interacts with before converting. I would use these reports to identify which channels are most effective at different stages of the customer journey. For example:
- Assisted Conversions: See which channels often assist in conversions, even if they weren't the final click. This highlights the importance of channels like social media or display advertising in driving initial awareness.
- Top Conversion Paths: Analyze the most common sequences of channel interactions that lead to conversions. This allows me to understand the typical customer journey and optimize channels accordingly.
- Time Lag & Path Length: Understand how long it takes for a customer to convert and how many interactions they typically have. This can help refine retargeting strategies and optimize budget allocation across different channels. I can see if customers generally convert quickly after a single interaction or if they require multiple touchpoints over a longer period.
18. Describe how you would use the attribution modeling tool to evaluate the impact of different marketing channels.
To evaluate the impact of different marketing channels using an attribution modeling tool, I would start by defining clear conversion goals (e.g., sales, leads, sign-ups). Then, I would configure the tool to track all relevant touchpoints across various channels like paid search, social media, email marketing, and display ads. The tool would then analyze the customer journey data and apply different attribution models (e.g., first-touch, last-touch, linear, time decay, U-shaped, algorithmic) to assign credit to each channel for driving conversions.
By comparing the performance of channels under different attribution models, I can identify which channels are most effective at different stages of the customer journey. For example, the first-touch model might highlight channels that are good at generating initial awareness, while the last-touch model might reveal which channels are most effective at closing deals. Algorithmic models provide a more data-driven approach by using machine learning to determine the optimal attribution weights for each channel. This data helps in making informed decisions on budget allocation, channel optimization, and overall marketing strategy.
19. How can you use Google Analytics to understand if website changes impacted conversion rate?
To understand the impact of website changes on conversion rate using Google Analytics, you can leverage A/B testing and compare data before and after the changes. Implement A/B testing through tools like Google Optimize (integrated with Google Analytics) or other third-party tools. Define clear goals (e.g., button clicks, form submissions) and track them as conversions. Once the test concludes, analyze the results in Google Analytics focusing on the conversion rate for each variation.
Alternatively, if an A/B test wasn't conducted, segment your data in Google Analytics by date range -- a period before the changes and a period after. Then, compare the conversion rates between the two date ranges. Look at specific user segments and landing pages to understand if the impact varies. Also, consider external factors (like marketing campaigns or seasonality) that might also influence conversion rates and try to filter their impact.
20. Explain how you would use the custom reports feature to create specific reports tailored to business needs.
To create custom reports tailored to business needs, I would first identify the specific key performance indicators (KPIs) or metrics that the business wants to track. Then, I would use the custom report builder (if available in the system) to select the relevant data sources and fields needed to calculate these KPIs. For example, if the business wants to track sales by region, I'd select the sales data source and include fields like 'region,' 'sales amount,' and 'date'.
Next, I would use the reporting tool's filtering and grouping capabilities to organize and refine the data. This might involve filtering by date range, grouping by region, or applying calculations like summing sales amounts. Finally, I would choose a suitable report format (e.g., table, chart) and schedule the report to be generated and delivered automatically to the relevant stakeholders at the desired frequency.
21. Describe your approach to auditing a Google Analytics setup to ensure data accuracy and completeness.
My approach to auditing a Google Analytics setup involves several key steps to guarantee data accuracy and completeness. First, I verify the Google Analytics tracking code implementation across all relevant website pages, ensuring it's correctly placed and firing without errors using tools like the Google Analytics Debugger and browser developer consoles. I also check for common implementation mistakes, such as duplicate tracking codes or missing event tracking. Next, I audit the Google Analytics configuration itself, reviewing filters, goals, custom dimensions/metrics, and e-commerce tracking settings to confirm they align with business objectives and are configured correctly.
I also validate data integrity by comparing Google Analytics data with other data sources (e.g., server logs, CRM data) to identify any discrepancies. I pay close attention to bounce rates, session duration, and conversion rates, investigating any unusual patterns or anomalies. Finally, I examine user permissions and access levels to ensure data security and compliance with privacy regulations like GDPR. A well documented and implemented GA setup is easier to audit for continued accuracy.
22. How would you identify and address bot traffic in Google Analytics?
To identify and address bot traffic in Google Analytics, I would first enable bot filtering in the View Settings. This automatically excludes traffic from bots and spiders identified by Google's list. For more in-depth analysis, I would create a segment to isolate potential bot traffic based on suspicious patterns such as unusually high bounce rates, session durations of zero seconds, or a large number of pageviews per session originating from a single IP address or service provider. I'd also check the 'Hostname' dimension for spam hostnames and exclude them via a filter.
To further mitigate bot traffic, I'd create custom filters to exclude traffic based on specific IP addresses, ranges, or user agents known to be associated with bots. Another approach is to use Google Tag Manager to implement a honeypot field or a CAPTCHA to identify and block bots before they even reach Google Analytics. Finally, consistently review referral traffic for spam referrals and exclude them as well.
Advanced Google Analytics interview questions
1. How would you track user engagement on a single-page application using Google Analytics?
To track user engagement on a single-page application (SPA) using Google Analytics, you'd primarily leverage virtual pageviews and event tracking. Because SPAs don't trigger traditional page loads, you manually send pageview hits to Google Analytics whenever the content or state changes significantly enough to warrant tracking it as a new page. This is done by using gtag('config', 'GA_TRACKING_ID', {'page_path': '/new-virtual-page'});. You replace /new-virtual-page with a meaningful path representing the user's current view or state within the application. For more granular engagement tracking beyond basic pageviews, use event tracking. For instance, track button clicks, form submissions, video plays or other interactions using gtag('event', 'event_name', {'event_category': 'category', 'event_label': 'label', 'value': 10});.
2. Explain how you would implement cross-domain tracking in Google Analytics and why it's important.
Cross-domain tracking in Google Analytics allows you to track user behavior across multiple domains as if they were a single website. This is crucial when a user journey involves multiple domains owned by the same entity, for example, a main website and a separate e-commerce platform on a different domain. Without it, Google Analytics would treat each domain as a separate website, leading to fragmented data, inaccurate user counts, and incorrect attribution of conversions.
To implement cross-domain tracking, you need to modify the Google Analytics tracking code on each domain. This involves configuring the allowLinker parameter to true and using the _ga parameter to pass the client ID between domains. This can be automated with GTM. When a user navigates from one domain to another, you'll need to append the _ga parameter to the outgoing link's URL. ga('create', 'UA-XXXXX-Y', 'auto', {'allowLinker': true}); ga('require', 'linker'); ga('linker:autoLink', ['example.com', 'example2.com']); This parameter contains the user's unique Google Analytics client ID, allowing Google Analytics to recognize the user as the same individual across all domains involved in cross-domain tracking. This ensures a unified view of the customer journey.
3. Describe a scenario where you would use custom dimensions and metrics, and how you would set them up.
Let's say I'm running an e-commerce site selling books, and I want to understand the engagement level of users based on the book genre they are browsing. Standard Google Analytics doesn't track book genre automatically. I can use custom dimensions to track the book genre and custom metrics to track things like 'time spent on genre page'.
To set this up, I'd define a 'bookGenre' custom dimension at the 'session' scope. In Google Analytics admin settings, I'd create the custom dimension. Then, on the website, when a user navigates to a genre page (e.g., 'Science Fiction'), I'd push an event to Google Analytics using gtag.js (or similar):
gtag('event', 'genre_view', {
  'bookGenre': 'Science Fiction'
});
I would also create a custom metric, time_on_genre_page (as an integer), to track the total time a user spends on a specific genre page during their session. I'd update this metric whenever a user navigates away from the page or ends their session. I can then create custom reports in Google Analytics to analyze how engagement (time spent, bounce rate, conversions) varies across different book genres, allowing me to tailor content or marketing efforts effectively.
4. How do you handle personally identifiable information (PII) in Google Analytics to comply with privacy regulations?
To handle PII in Google Analytics and comply with privacy regulations, I would primarily avoid collecting it in the first place. This involves carefully reviewing all data collected to ensure no PII like names, email addresses, or phone numbers are being captured. If accidental collection occurs, Google Analytics provides features to delete the data at the property or account level. Furthermore, IP anonymization should be enabled to mask the last octet of IPv4 addresses or the last 80 bits of IPv6 addresses before they are stored.
Specifically, I would use features like data redaction, User-ID hashing, and exclusion filters to remove or obfuscate any identified PII. Regularly auditing my Google Analytics setup and associated data layers, along with implementing proper consent mechanisms through a consent management platform (CMP), are essential to maintain compliance with regulations like GDPR and CCPA.
5. What are some strategies for dealing with bot traffic in Google Analytics?
Dealing with bot traffic in Google Analytics involves several strategies. First, enable bot filtering in your Google Analytics settings. Navigate to Admin > View Settings and check the box labeled "Bot Filtering: Exclude all hits from known bots and spiders." This will automatically filter out traffic from bots identified by Google's internal list.
Beyond the basic filter, you can create custom filters. Analyze your data for unusual patterns, such as high bounce rates, short session durations, or traffic originating from unexpected locations. Use these patterns to create filters based on hostname, IP address, or referral source. For example, you can exclude traffic from specific IP ranges using a custom filter with the "Exclude" filter type and the "IP Address" filter field. You could also use segments to isolate traffic to better analyze and potentially exclude sources. Regularly review your filters and segments as bot behavior evolves.
6. How would you use Google Tag Manager in conjunction with Google Analytics to track specific user interactions?
I would use Google Tag Manager (GTM) to deploy and manage Google Analytics (GA) tags and triggers, allowing for tracking specific user interactions without directly modifying the website's code. First, I'd set up a GA tag within GTM, configuring it with the appropriate GA tracking ID. Then, I'd define triggers in GTM based on the user interactions I want to track, such as button clicks, form submissions, video plays, or scrolling. These triggers would fire the GA tag, sending event data to Google Analytics.
For example, to track button clicks, I'd create a 'Click' trigger in GTM, specifying the button's CSS selector or ID. When a user clicks the button, the trigger fires, and the GA tag sends an event to GA, which includes event category, action, and label parameters that I configure in the GTM tag. This allows me to analyze the data in Google Analytics to understand user behavior and improve the website's performance.
7. Explain how you would analyze user behavior using cohort analysis in Google Analytics.
Cohort analysis in Google Analytics allows you to group users based on shared characteristics and observe their behavior over time. To analyze user behavior, I would first define my cohorts based on acquisition date (e.g., users who signed up in January, February, etc.) or other relevant dimensions like first product purchased or source/medium. Then, I'd use the cohort analysis report to track metrics like retention rate, conversion rate, or revenue over weeks or months for each cohort. By comparing these metrics across different cohorts, I can identify trends, understand the impact of marketing campaigns or product changes, and pinpoint areas for improvement. For example, if users acquired in February have a significantly lower retention rate than those acquired in January, it signals potential issues with user onboarding or product engagement that need further investigation.
8. Describe your process for auditing a Google Analytics setup to identify potential issues and areas for improvement.
My process for auditing a Google Analytics setup involves several key steps. First, I verify the basic implementation: ensuring the GA tracking code is correctly installed on all relevant pages, that the correct GA property is being used, and that data is flowing properly (real-time reports). I then review goal and event tracking to ensure they are accurately capturing key user interactions and conversions. I'd examine configurations for common errors, such as self-referral exclusions, internal IP filtering, and cross-domain tracking setup. Next, I'd delve into data quality, looking for inconsistencies in metrics, unexpected traffic spikes, or missing data segments.
After the data is reviewed I analyze configurations for opportunities for improvement. This includes reviewing the use of custom dimensions and metrics to ensure they are capturing the right level of detail, evaluating existing reports and dashboards for usefulness and clarity, and suggesting new tracking implementations that would provide deeper insights into user behavior. I also check for compliance with privacy regulations (GDPR, CCPA) and optimal data retention settings. Finally, I document my findings and provide prioritized recommendations for addressing any issues and enhancing the overall effectiveness of the Google Analytics setup.
9. How would you measure the impact of a website redesign on key performance indicators (KPIs) using Google Analytics?
To measure the impact of a website redesign on KPIs using Google Analytics, I would first identify the key KPIs that the redesign aims to improve (e.g., conversion rate, bounce rate, average session duration, page views per session). Then, I'd set up annotations in Google Analytics to mark the launch date of the redesign. After the redesign goes live, I'd use Google Analytics to compare the KPIs before and after the launch date. I would create segments to isolate specific user groups (e.g., new vs. returning visitors, mobile vs. desktop users) and analyze how the redesign impacted their behavior. This helps in understanding the impact more granularly. A/B testing is also crucial, where if possible, a small subset of users are exposed to the redesign first before a full roll out. The performance differences are crucial to understand if a change is a net positive or negative.
10. Explain how you can use the Measurement Protocol to send data to Google Analytics from sources other than a website or app.
The Measurement Protocol allows sending raw user interaction data directly to Google Analytics servers without relying on the standard JavaScript tracking code used on websites or SDKs in mobile apps. This is useful for tracking activity from various sources, such as: server-side processes, point-of-sale systems, kiosks, email campaigns (opens/clicks), or any device capable of making HTTP requests.
To send data, you construct a specific HTTP request (typically a POST request) to the Google Analytics endpoint (https://www.google-analytics.com/mp/collect). This request includes a set of parameters that define the event or user interaction being tracked. Essential parameters are: v (protocol version), tid (tracking ID / property ID), cid (client ID), and en (event name) plus any associated event parameters (e.g. ep.item_name=foo). By crafting these requests accurately, you can populate Google Analytics with custom data from any environment capable of generating HTTP requests.
11. How would you use Google Analytics to track the effectiveness of an email marketing campaign?
To track the effectiveness of an email marketing campaign using Google Analytics, you would use UTM parameters to tag the URLs in your emails. These parameters allow Google Analytics to identify traffic originating from your specific email campaign. The parameters are typically: utm_source (e.g., 'newsletter'), utm_medium (e.g., 'email'), utm_campaign (e.g., 'summer_sale'), and optionally utm_term (for paid keywords) and utm_content (to differentiate ads or links within the same email).
Once your campaign is running, you can then analyze the data in Google Analytics under 'Acquisition' > 'Campaigns' > 'All Campaigns'. Here, you'll see the performance of your email campaign based on metrics like sessions, bounce rate, conversions (if you've set up goals or e-commerce tracking), and revenue. Analyzing these metrics will tell you how effective your campaign is in driving traffic and achieving your desired goals.
12. Describe how you would implement event tracking to measure video views on a website.
To implement video view tracking, I would use JavaScript to listen for video events, specifically the play and ended events. When a video starts playing (the play event fires), I'd trigger a tracking event using a service like Google Analytics, Segment, or a custom tracking solution. The tracking event would include relevant information, such as the video ID, user ID (if available), timestamp, and potentially other metadata like video duration or content category.
For the ended event, I would trigger another tracking event to indicate a completed view. I might also track progress milestones (e.g., 25%, 50%, 75% viewed) by using the timeupdate event and calculating the percentage of the video that has been played. To prevent excessive tracking, I'd implement debouncing or throttling techniques to limit the number of tracking events sent during playback.
13. How would you analyze the customer journey across multiple devices using Google Analytics?
To analyze the customer journey across multiple devices in Google Analytics, I would leverage the User ID feature. First, I'd implement User ID tracking on the website and app, ensuring authenticated users are assigned a consistent, unique ID across all devices. This allows Google Analytics to stitch together sessions from the same user, even if they occur on different devices and browsers.
Next, I would create cross-device reports in Google Analytics. These reports, such as the User ID Coverage report and Device Overlap report, help understand how users interact with the website or app on different devices. Further analysis would involve creating custom segments based on device usage to gain insights into user behavior and optimize the cross-device customer experience. Funnel reports can also be set up to visualize the user journey as they hop across devices to complete a conversion.
14. Explain how you can use the User ID feature in Google Analytics to track users across different sessions and devices.
The User ID feature in Google Analytics allows you to associate engagement data from different sessions and devices to a unique, persistent ID, providing a more unified view of user behavior. To implement it, you need to generate a unique User ID for each logged-in user on your website or app and send it to Google Analytics with each hit. This can be done by setting the userId field in the Google Analytics tracking code.
By consistently sending the same User ID for the same user across sessions and devices, Google Analytics can stitch together their interactions, giving you more accurate reporting on metrics like user engagement, conversion paths, and lifetime value. This helps in understanding how users interact with your platform over time, irrespective of the device they use, and improves the accuracy of user-based metrics.
15. How would you troubleshoot discrepancies between data in Google Analytics and other data sources?
Troubleshooting discrepancies between Google Analytics and other data sources requires a systematic approach. First, verify data collection setup in Google Analytics; ensure tracking code is correctly implemented on all relevant pages and events are firing as expected. Compare date ranges, timezones, and filters applied in both systems, ensuring they are identical. Also, double-check how metrics are defined and calculated; differences in attribution models or calculation methods can lead to discrepancies. Look for data sampling in Google Analytics, especially for high-traffic websites, and attempt to reduce sampling or use unsampled reports.
Next, investigate common causes like data delays or processing differences. Google Analytics data isn't real-time and can have processing delays. Also, ensure data sources align on how they handle users (e.g., unique visitors vs. active users) and sessions. Look for potential data loss due to ad blockers or user privacy settings impacting Google Analytics tracking. Finally, consider exporting raw data from both systems and comparing it at a granular level to identify specific points of divergence, such as individual transactions or pageviews.
16. Describe how you would use Google Analytics to identify and address website performance issues that impact user experience.
I would leverage Google Analytics to identify and address website performance issues impacting user experience by first focusing on key metrics such as bounce rate, exit pages, page load time, and time on page. I'd segment users by browser, device, and geography to pinpoint specific areas where performance is lacking. For instance, a high bounce rate on a particular page suggests potential usability or loading issues, and I would dive deeper into the page load times for that page across different browsers and devices. If a certain browser shows slower loading, I would investigate code compatibility or resource optimization for that specific browser.
Next, I would use Behavior reports, specifically 'Site Speed' reports, to identify slow-loading pages. I'd use 'Page Timings' to see the average load time for each page and 'Speed Suggestions' to get actionable recommendations from Google PageSpeed Insights on how to improve page performance, such as optimizing images or leveraging browser caching. I'd also analyze user flows to pinpoint drop-off points and understand if slow loading times are contributing to users abandoning the site. Finally, I would implement the recommended changes, and continuously monitor Google Analytics to validate the improvements in user experience and overall site performance.
17. How would you segment users based on their engagement with specific website features?
User segmentation based on feature engagement involves grouping users by how often and deeply they interact with particular website features. Common approaches involve analyzing feature usage frequency (daily, weekly, monthly), duration of use, and feature combinations. Based on this we can create segments like:
- Power Users: Heavily utilize core features.
- Occasional Users: Engage with specific features infrequently.
- New Users: Still exploring different features.
- Inactive Users: Rarely use any features.
These segments allow for targeted marketing, personalized onboarding, and feature optimization efforts. For example, power users could be invited to beta test new features, while inactive users could receive re-engagement campaigns highlighting key functionalities.
18. Explain how you can use the Content Grouping feature in Google Analytics to analyze website content performance.
Content Grouping in Google Analytics lets you organize website content into logical groups for easier analysis. You can use it to aggregate metrics for related pages, even if they don't share a common URL structure. This helps you understand how entire sections of your site are performing.
To analyze content performance, you can create Content Groups based on categories like product type, blog topic, or stage in the user journey. Then, you can view reports that show metrics such as pageviews, bounce rate, and average time on page for each group. This allows you to identify underperforming content areas and optimize them for better engagement and conversions. For example, you might find that a specific product category has a high bounce rate, indicating a need for improvements to the landing page or product descriptions.
19. How would you measure the success of a content marketing campaign using Google Analytics?
To measure the success of a content marketing campaign using Google Analytics, I'd focus on key performance indicators (KPIs) that align with the campaign's goals. These might include website traffic (sessions, users, pageviews), engagement metrics (bounce rate, time on page, pages per session), conversions (goal completions, e-commerce transactions), and user behavior (events, site search). I'd also track traffic sources to see which channels are driving the most valuable traffic.
Specifically, I would set up goals to track conversions, create custom reports to analyze the performance of specific content pieces, and use event tracking to measure user interactions with the content (e.g., video plays, form submissions, button clicks). By analyzing these metrics, I can determine which content is resonating with the audience, driving conversions, and ultimately contributing to the campaign's success. It's also important to measure against baseline metrics from before the campaign's start.
20. Describe your approach to creating custom dashboards and reports in Google Analytics to meet specific business needs.
My approach to creating custom dashboards and reports in Google Analytics starts with a clear understanding of the business needs. I collaborate with stakeholders to define key performance indicators (KPIs) and identify the questions they need to answer. Then, I leverage Google Analytics' customization features, such as custom dimensions and metrics, to capture relevant data. Finally, I create dashboards and reports, using GA's interface or connecting to external tools like Google Data Studio, to visualize the data and provide actionable insights, ensuring regular review and iteration to meet evolving requirements.
21. How would you use Google Analytics to optimize a website's conversion funnel?
To optimize a website's conversion funnel using Google Analytics, I would focus on identifying drop-off points and understanding user behavior at each stage. First, I'd set up goals in Google Analytics to represent the key steps in the funnel (e.g., product page view, add to cart, checkout, purchase). Then, I'd analyze the Funnel Visualization report to pinpoint where users are leaving the funnel.
Next, I'd dive deeper using other Google Analytics features:
- Behavior Flow: Understand the paths users take through the site and identify unexpected or problematic navigation patterns.
- Event Tracking: Track specific user interactions (e.g., button clicks, video plays, form submissions) to get more granular data on user behavior.
- A/B Testing (integrated with Google Optimize): Test different versions of pages or elements within the funnel to see which performs better in terms of conversion rates. For example, testing different call-to-action button text or layout variations on a checkout page. By understanding the "why" behind the drop-offs (e.g., confusing navigation, slow loading times, unclear value proposition), I can recommend data-driven improvements to the website to improve conversion rates.
22. Explain how you can use the Enhanced Ecommerce feature in Google Analytics to track online sales performance.
Enhanced Ecommerce in Google Analytics provides in-depth tracking of user interactions and sales performance on e-commerce websites. It goes beyond basic transaction tracking by allowing you to track product impressions, product clicks, add-to-carts, checkout behavior, and internal promotions. By implementing Enhanced Ecommerce, you can get insights into which products are most popular, where users are dropping off in the checkout process, and the effectiveness of your marketing campaigns.
To use it, you need to implement the dataLayer with specific Ecommerce events and related data. For instance, tracking a product view event requires pushing product details such as ID, name, category, and price into the dataLayer when a user views a product page. Similar events can be implemented for add-to-cart, checkout steps, and purchase completions. Google Analytics then processes this data to generate detailed reports on product performance, sales funnel analysis, and revenue attribution, enabling data-driven decisions to optimize your online sales strategy.
23. How would you use Google Analytics to understand the impact of social media marketing efforts on website traffic and conversions?
To understand the impact of social media marketing using Google Analytics, I'd first set up UTM parameters for all social media links to track the source, medium, and campaign. Then, I'd analyze the 'Acquisition' reports, specifically 'All Traffic' > 'Source/Medium', to see which social media platforms drive the most traffic. I'd also examine 'Behavior' reports to see the pages users land on from social media, and assess bounce rates and time on page. Conversions would be tracked using goals or e-commerce tracking, allowing me to determine which social media platforms are driving the most valuable actions on the website.
Furthermore, I would analyze user behavior based on the 'landing page' dimension, looking for patterns or specific content that resonates more with social media users, allowing for better content strategies. I would segment users coming from social media based on demographics and interests to refine targeting. Analyzing the conversion rate for each social media platform helps to identify the most effective channels for driving desired outcomes, informing future investment and optimization efforts.
24. Describe how you would implement and analyze A/B tests using Google Analytics and Google Optimize.
To implement and analyze A/B tests using Google Analytics and Google Optimize, I would first define a clear objective and hypothesis for the test. Then, using Google Optimize, I would create different variations of a webpage or element (e.g., button color, headline). I'd specify the target audience and traffic allocation to each variation. Google Optimize seamlessly integrates with Google Analytics, allowing me to select specific GA goals as the primary metric for evaluating the experiment's success.
During the A/B test, Google Optimize tracks user behavior for each variation and sends data to Google Analytics. Once the test concludes, I would analyze the results in Google Analytics, focusing on the chosen primary metric and secondary metrics. Google Analytics provides statistical significance data (confidence intervals) to determine if the observed differences between variations are statistically meaningful and not due to random chance. Based on the analysis, I would implement the winning variation to improve the website's performance based on the test's objective.
25. How would you approach analyzing a sudden drop in website traffic reported by Google Analytics?
- Verify the drop: Confirm the drop in Google Analytics is accurate and not due to a tracking error. Check real-time data and compare it with other analytics platforms if available.
- Identify the scope: Determine which segments of traffic are affected (e.g., organic, paid, direct). Are specific pages or sections of the website showing the decrease? Use Google Analytics' segments and filters for granular analysis.
- Check for technical issues: Ensure the website is accessible and loading correctly. Investigate potential server errors, DNS issues, or problems with the Google Analytics tracking code.
- Investigate external factors:
- Algorithm updates: Check for recent Google algorithm updates that may have impacted organic search rankings.
- Seasonality: Consider seasonal trends that could explain the traffic decline.
- Marketing campaigns: Check if any marketing campaigns were paused or altered.
- Referral traffic: See if there is any drop in the referral traffic.
- Review website changes: Determine if any recent website changes (e.g., redesign, content updates, or technical changes) could have contributed to the drop. New robots.txt entries? Accidentally noindexed page? Updated sitemap?
- Analyze keywords: Check Google Search Console to see if there's a drop in impressions or clicks for specific keywords.
- Competitor analysis: Analyze competitors to see if they are experiencing a similar trend or if they have launched a successful campaign that's affecting your traffic.
26. Imagine a client wants to track how many users download a PDF from their site. How would you set this up using Google Analytics and Tag Manager?
First, in Google Analytics, ensure you have event tracking enabled. Then, in Google Tag Manager (GTM), create a new tag. Configure the tag type as 'Google Analytics: Universal Analytics' or 'Google Analytics: GA4 Event', depending on the GA version. Set the track type to 'Event'. Define the event category (e.g., 'Downloads'), action (e.g., 'PDF Download'), and label (e.g., the PDF filename).
Next, create a trigger in GTM to fire the tag when a user clicks on the PDF link. You can use a 'Click - Just Links' trigger, configured to filter clicks based on the link's URL containing '.pdf'. Alternatively, if the PDF link has a specific class or ID, you can use that for more precise targeting. Once the tag and trigger are set up and published in GTM, every time a user clicks on a PDF link, an event will be sent to Google Analytics, allowing you to track PDF downloads.
Expert Google Analytics interview questions
1. How would you approach setting up Google Analytics for a brand new website with a complex user journey and multiple conversion points?
First, I'd implement Google Analytics 4 (GA4) using Google Tag Manager (GTM). GTM allows for easier management of tracking codes and avoids direct code changes to the website. Within GTM, I'd set up the GA4 configuration tag, followed by event tracking for key interactions in the user journey. For complex user journeys and multiple conversion points, I'd define a clear measurement plan that maps user actions to specific GA4 events (e.g., view_item, add_to_cart, begin_checkout, purchase).
I'd leverage GA4's enhanced measurement features to automatically track some events, but also configure custom events for specific conversion points and user behaviors unique to the website. I'd use custom dimensions to capture relevant user attributes and page-level data to provide more granular insights. Regular monitoring and testing are essential to ensure data accuracy and make necessary adjustments to the tracking setup. Funnel reports will also be important to visualize the conversion rates and identify areas of improvement.
2. Imagine a scenario where data discrepancies arise between Google Analytics and your internal database. How would you investigate and resolve these discrepancies?
To investigate data discrepancies between Google Analytics and an internal database, I'd first define the scope of the problem: which metrics, time periods, and segments are affected? Then, I'd systematically validate the data collection process for both systems. For Google Analytics, I'd check for proper tag implementation, filters, and goal configurations. On the internal database side, I'd verify the data extraction logic, transformations applied, and data loading procedures, ensuring all relevant data points are being captured and processed correctly.
Next, I would compare the raw data from both sources for a small, representative sample. This involves analyzing the hits being sent to Google Analytics versus the corresponding transactions or events recorded in the database. Look for differences in session definitions, user identification, or event tracking parameters. Use tools like the Google Analytics Debugger or network inspection tools (like Chrome DevTools) to examine the data being transmitted to Google Analytics. If a root cause is identified, implement the necessary corrections in either the data collection or processing pipelines. After corrections, I'd monitor both systems closely to ensure the discrepancies are resolved and that data consistency is maintained moving forward.
3. Can you describe your experience with implementing and utilizing the Google Analytics API for custom reporting or data integration purposes?
I have experience using the Google Analytics API (primarily the Reporting API v4) for custom reporting and data integration. I've utilized Python with the google-api-python-client library to authenticate and query the API. Specifically, I've automated the extraction of website traffic data, user behavior metrics, and conversion information. This extracted data was then integrated into internal dashboards and data warehouses for more comprehensive analysis and reporting that was beyond the standard Google Analytics interface.
My tasks included defining custom dimensions and metrics within Google Analytics, constructing API requests to retrieve data based on these custom configurations, and transforming the API responses into formats suitable for various reporting tools (e.g., CSV, SQL databases). I've also implemented error handling and retry mechanisms to ensure data integrity and reliability in automated data pipelines. Code example: service.reports().batchGet(body=body).execute()
4. How would you design a comprehensive A/B testing strategy using Google Optimize and Google Analytics to improve website conversion rates?
My A/B testing strategy using Google Optimize and Google Analytics focuses on iterative improvements driven by data. I'd start by identifying key conversion points on the website (e.g., landing page, checkout process) and using Google Analytics to pinpoint areas with high drop-off rates or low engagement. Based on these insights, I'd formulate hypotheses about why users aren't converting (e.g., unclear call-to-action, confusing layout). Next, I would use Google Optimize to create variations of the identified pages to test my hypotheses. These variations could involve changes to headlines, button colors, image placement, or form fields. Google Analytics would be linked to Google Optimize to track how each variation performs against the original in terms of conversion rates, bounce rates, and other relevant metrics. The test would be running for a sufficiently long duration to collect statistically significant data and prevent novelty effect. I would also use Optimize's targeting features to personalize tests for different user segments, such as mobile vs. desktop users or new vs. returning visitors. Finally, once a winner is determined with high statistical confidence, I'd implement the winning variation on the live site and continuously monitor its performance while using GA data to inform future A/B tests and optimizations, beginning the cycle anew.
5. Let's say a client wants to track user engagement with embedded videos on their website. How would you configure Google Analytics to capture meaningful video interaction data?
To track user engagement with embedded videos using Google Analytics, you'd primarily use Enhanced Measurement (if using GA4) or event tracking (for Universal Analytics, though it's being phased out). For GA4, ensure Enhanced Measurement is enabled and that video tracking is toggled on. This automatically captures events like video starts, progress (10%, 25%, 50%, 75%), completes, and sometimes mute/unmute actions.
For more granular control or if Enhanced Measurement doesn't capture everything, implement custom event tracking using the Google Tag Manager (GTM). Define triggers based on video events (e.g., using JavaScript listeners to detect video play, pause, seek, etc.) and create corresponding GA4 event tags. The event category would be 'video', the event action could be 'play', 'pause', 'complete', and the event label could be the video title or URL. You can then analyze this data within Google Analytics to understand video engagement metrics.
6. Explain your process for identifying and mitigating bot traffic or spam referrals in Google Analytics to ensure data accuracy.
My process for identifying and mitigating bot traffic and spam referrals in Google Analytics involves several key steps. First, I regularly review the referral traffic reports, looking for suspicious sources with high bounce rates, low session durations, and generic hostnames. Tools like the 'Hostname' report also help identify spam. Once identified, I use Google Analytics' filters to exclude these sources by hostname, referral URL, or IP address. I also leverage the Bot Filtering setting in the View Settings, ensuring that Google's list of known bots is excluded.
Further, I proactively implement a 'valid hostname' filter to only include traffic from my actual domain, preventing ghost referrals. If needed, I'd explore using a segment to view data with the filters applied and make sure that it is capturing real user traffic only. By actively monitoring and filtering, I strive to maintain accurate and reliable data for analysis and decision-making.
7. How would you leverage Google Analytics data to build predictive models for forecasting website traffic or user behavior?
To leverage Google Analytics data for predictive models, I'd start by identifying key metrics like page views, sessions, bounce rate, and conversion rate. These would be my target variables or features. Next, I'd extract historical data from Google Analytics using the API or available integrations, ensuring proper data cleaning and preprocessing. This involves handling missing values and outliers. I would also engineer new features such as session duration, pages per session, and time-based features (day of week, month) that might correlate with traffic or behavior.
For model building, I'd consider time series models like ARIMA or Prophet for traffic forecasting, given the temporal nature of the data. Alternatively, for predicting user behavior (e.g., conversion), I might use classification models like logistic regression or random forests, using the features derived from Google Analytics data. Model evaluation is crucial, using metrics appropriate for the task such as RMSE for time series and AUC for classification problems. The chosen model is then retrained as new data becomes available. For example, a simple python script to fetch Google Analytics data using the Google Analytics Reporting API v4 would look something like this (psuedo code):
from googleapiclient.discovery import build
# Authenticate
service = build('analyticsreporting', 'v4', credentials=credentials)
# Construct request
request = service.reports().batchGet(body={
 'reportRequests': [{
 'viewId': VIEW_ID,
 'dateRanges': [{'startDate': '2023-01-01', 'endDate': '2023-12-31'}],
 'metrics': [{'expression': 'ga:sessions'}],
 'dimensions': [{'name': 'ga:date'}]
 }]
})
# Execute request and process the data.
response = request.execute()
8. Describe a time when you had to troubleshoot a complex Google Analytics implementation issue. What steps did you take to diagnose and resolve the problem?
In a previous role, we noticed significant discrepancies between Google Analytics data and backend sales data for a specific product line. My initial step was to verify the GA implementation itself. I used the Google Analytics Debugger Chrome extension to examine the data being sent to GA in real-time during the purchase flow. This revealed that the transactionId was occasionally being duplicated due to a faulty server-side script. This caused GA to incorrectly attribute revenue.
To resolve this, I worked with the development team to fix the script generating the transactionId to ensure uniqueness. After the fix was deployed, I monitored the GA data closely, comparing it with the backend sales data daily. We also implemented data validation checks in our ETL pipeline to flag any future discrepancies. Within a week, the GA data aligned with the backend data, and we had a system in place to prevent recurrence.
9. How would you approach measuring the impact of offline marketing campaigns (e.g., print ads, events) on website traffic and online conversions using Google Analytics?
To measure the impact of offline marketing campaigns on website traffic and online conversions using Google Analytics, I'd primarily use custom URLs with UTM parameters. These parameters (utm_source, utm_medium, utm_campaign, utm_term, utm_content) allow me to track the specific source, medium, and campaign that brought users to the website. For example, a print ad could have a URL like www.example.com?utm_source=magazine&utm_medium=print&utm_campaign=summer_sale. I'd also use event tracking in Google Analytics to capture specific user interactions that are directly attributable to the offline campaign, like form submissions using a QR code mentioned in a flyer.
By analyzing the data in Google Analytics, filtering by these UTM parameters, I can determine the traffic volume, bounce rate, conversion rates, and revenue generated from each offline campaign. For example, I'd check Acquisition > Campaigns > All Campaigns report and filter by campaign name or use custom reports to see traffic and conversions from these tagged URLs. This helps to assess the effectiveness and ROI of various offline marketing efforts. Additional attribution models within Google Analytics can then be used to give fractional credit to offline touchpoints in the customer journey.
10. Can you explain the differences between session-scoped, user-scoped, and hit-scoped custom dimensions in Google Analytics, and provide examples of when you would use each?
Session-scoped custom dimensions apply to an entire session. For example, you might use it to track if a user saw a specific promotion during their session. User-scoped dimensions apply to all future sessions of a user, useful for things like loyalty tier or customer type (e.g., 'premium_user' or 'new_customer'). Hit-scoped dimensions apply only to a single interaction (pageview, event, etc.). You might use it to track the author of a blog post being viewed or the game difficulty setting selected at the start of a level.
In short, session scopes are for 'this visit', user scope is for 'this user across all visits', and hit scope is for 'this interaction'.
11. How would you use Google Analytics to analyze the effectiveness of different content marketing strategies (e.g., blog posts, ebooks, infographics) in driving website engagement and lead generation?
To analyze content marketing effectiveness using Google Analytics, I'd focus on a few key areas. First, I'd track traffic sources to identify which content types (blog posts, ebooks, etc.) generate the most traffic. This involves segmenting traffic by source (organic, social, referral) and landing page (specific content pieces). I'd then analyze engagement metrics like bounce rate, time on page, and pages per session for each content type. Higher engagement suggests more effective content. Finally, I'd set up goal tracking to measure lead generation. This could involve tracking form submissions, ebook downloads, or newsletter sign-ups originating from different content pieces. By attributing lead generation to specific content, I can determine which strategies are most effective at driving conversions. I would create segments and dashboards for quick analysis.
12. Describe your experience with setting up and using Enhanced Ecommerce tracking in Google Analytics to measure product performance and sales funnel metrics.
I have experience implementing Enhanced Ecommerce tracking in Google Analytics to gain insights into product performance and the sales funnel. I've used the dataLayer object to push ecommerce data related to product impressions, product clicks, product details views, add-to-carts, checkouts, and purchases. I ensured the dataLayer was correctly configured on relevant pages like product listing pages, product detail pages, the shopping cart, and checkout confirmation pages. I then configured Google Analytics to properly interpret this data, enabling the Enhanced Ecommerce reports which allowed me to analyze product performance by revenue, quantity, average order value and track user behavior through the various stages of the purchase process.
Specifically, I've used these reports to identify drop-off points in the funnel (e.g., checkout abandonment), understand which products are most frequently added to carts but not purchased, and measure the effectiveness of product recommendations. I also used the data to perform A/B tests, evaluate the impact of promotional campaigns on sales, and identify opportunities to improve the overall user experience and conversion rates.
13. How would you approach auditing an existing Google Analytics setup to identify areas for improvement and ensure data quality?
To audit an existing Google Analytics setup, I'd start by reviewing the implementation to ensure data collection is accurate and comprehensive. This involves checking the GA code is correctly implemented on all relevant pages, goals are set up to track key conversions, and events are tracking user interactions. Next, I would look for any data discrepancies or anomalies, comparing the data with other sources, such as server logs or other analytics tools. This helps identify potential issues like double-counting of events, missing data or incorrect attribution.
After data validation, I would focus on configuration aspects like filters, segments, and custom dimensions to ensure they're set up correctly and aligned with business objectives. I'd also examine the user management settings, ensuring appropriate access levels are granted. Reporting is the final step where I review the custom reports and dashboards and determine if they adequately provide insights. Finally, create a prioritized list of areas for improvement, including specific recommendations and estimated impact.
14. Let's say a client wants to understand the cross-device behavior of their users. How would you configure Google Analytics to track users across multiple devices and browsers?
To track users across multiple devices and browsers in Google Analytics, you'd implement User-ID. First, you need a system to uniquely identify logged-in users (e.g., a user ID from your authentication system). Then, in your Google Analytics setup:
- Enable User-ID feature in the Google Analytics admin settings.
- Send the User-ID to Google Analytics with each hit. In gtag.js, this would look like:
gtag('set', 'user_id', 'USER_ID');replacingUSER_IDwith the actual user identifier. This needs to be implemented across all platforms (website, apps) where users log in. - Consider enabling cross-domain tracking if your website spans multiple domains. This will require modifying the gtag.js configuration to properly handle link decoration and cookie sharing between domains. Use
gtag('config', 'GA_TRACKING_ID', { 'linker': { 'domains': ['example.com', 'example2.com'] } });
15. Explain your understanding of the Google Analytics data processing pipeline, from data collection to reporting, and how it impacts data accuracy and availability.
The Google Analytics data processing pipeline involves several key stages. First, data is collected through JavaScript tracking code embedded on websites or via SDKs in mobile apps. This raw data includes user interactions, events, and other attributes. Next, this data is processed which includes sessionization, attribution, and filtering of bot traffic, and other data quality checks to ensure data accuracy. Finally, the processed data is aggregated and stored in Google's data warehouses, making it available for reporting and analysis through the Google Analytics interface.
The accuracy and availability of data are impacted by various factors in the pipeline. Sampling, which Google Analytics applies to large datasets, can reduce the precision of reports. Data latency, the time it takes for data to become available in reports, can affect the timeliness of insights. Additionally, data privacy regulations and user consent affect data collection, potentially leading to incomplete datasets. Incorrect implementation of tracking code can cause inaccurate or missing data. Understanding these impacts is crucial for interpreting and using Google Analytics data effectively.
16. How would you leverage Google Analytics data to personalize website content and user experiences based on user behavior and preferences?
I would leverage Google Analytics data to personalize website content and user experiences by first identifying key user segments based on demographics, behavior (pages visited, time spent, bounce rate), and acquisition channels. Then, I'd use this data to tailor content, offers, and website layout to match the preferences of each segment. For example, if Google Analytics shows a high bounce rate on a specific landing page for mobile users, I'd optimize the page's mobile responsiveness and simplify the content. Or if a segment of users frequently visits product comparison pages, I'd highlight product comparisons more prominently for similar users.
Further personalization could involve using Google Analytics to trigger dynamic content changes. This could include personalized recommendations, targeted promotions, or customized search results based on user behavior. A/B testing is crucial to validate the effectiveness of any personalization strategy, ensuring that changes improve key metrics like conversion rates and engagement. GA events and goals would track the effectiveness of different personalization efforts.
17. Describe your experience with using Google Analytics segments to analyze specific user groups or cohorts and identify trends and patterns in their behavior.
I've used Google Analytics segments extensively to analyze user behavior across various dimensions. For example, I created segments based on traffic source (e.g., organic search, paid advertising) to compare conversion rates and identify which channels were most effective at acquiring valuable users. I also used segments to isolate users who visited specific landing pages or completed certain events to understand their journey and identify potential areas for optimization. Analyzing these segmented cohorts helped uncover patterns like users acquired through paid social media exhibiting higher bounce rates on specific landing pages, prompting me to investigate and improve the landing page content and targeting.
Furthermore, I've employed advanced segmentation techniques like creating sequences based on user behavior. For instance, I defined a segment for users who viewed a product page, added the product to their cart, but did not complete the purchase. Analyzing this abandoned cart segment allowed me to identify potential friction points in the checkout process, such as high shipping costs or confusing form fields, leading to improvements in the user experience and increased conversion rates. I’ve also used cohort analysis to observe how users acquired in a specific time period behave over time, identifying trends in retention and engagement.
18. How would you approach measuring the impact of website redesigns or major updates on website traffic, user engagement, and conversion rates using Google Analytics?
To measure the impact of website redesigns/updates, I'd leverage Google Analytics using a pre-and-post analysis. First, define key metrics like website traffic (sessions, users), user engagement (bounce rate, time on page, pages per session), and conversion rates (e.g., form submissions, e-commerce transactions). I'd then establish a baseline by collecting data for a specific period (e.g., a month) before the redesign. After the launch, I would monitor the same metrics for an equivalent period and use the GA comparison tool to identify significant changes.
Beyond simple comparison, I'd implement annotations in Google Analytics to mark the exact launch date of the redesign, facilitating easier analysis. I'd also segment users (e.g., by device, acquisition channel) to understand if the impact varies across different user groups. A/B testing before the full launch can also predict impact and help refine the final design, using metrics like click-through rates or conversion rates as key indicators. Finally, I'd set up custom reports and dashboards for ongoing monitoring to identify any long-term trends or issues related to the redesign.
19. Can you explain the concept of attribution modeling in Google Analytics, and how you would choose the most appropriate attribution model for a specific marketing campaign?
Attribution modeling in Google Analytics is the process of assigning credit for conversions to different touchpoints in a user's journey. Different models assign credit differently. Some common models include: Last-click attribution (100% credit to the last click), First-click attribution (100% credit to the first click), Linear attribution (equal credit to all touchpoints), Time-decay attribution (more credit to touchpoints closer to the conversion), and Position-based attribution (credit assigned to the first, last, and some middle touchpoints).
Choosing the right model depends on the marketing campaign's goals and the customer journey. For example, if the goal is lead generation, first-click might be helpful. If focusing on closing deals, last-click might be better. Data-driven attribution, which uses machine learning to analyze conversion data, can be the most accurate, although it requires sufficient data. Analyze the Model Comparison tool in Google Analytics and consider A/B testing different models to assess their impact on ROI and campaign effectiveness. Ultimately, no single model is perfect; you might use a combination or custom model for a holistic view of marketing performance.
20. How would you use Google Analytics to identify and address website performance issues that are impacting user experience and conversion rates?
I would use Google Analytics to identify performance issues by focusing on metrics like Bounce Rate, Exit Rate, Page Load Time, and Time on Page. A high bounce rate on a landing page could indicate poor page performance or irrelevant content. Similarly, a high exit rate on a specific page in a conversion funnel could point to usability problems or technical glitches. Page Load Time is crucial; I'd monitor it using the 'Site Speed' reports and investigate pages with consistently slow load times. To address these issues, I'd use Google Analytics segments to isolate specific user groups or device types experiencing problems. For example, if mobile users have a significantly higher bounce rate, I'd investigate mobile optimization issues. I'd then A/B test changes, using Google Optimize or similar tools, to validate solutions and improve conversion rates. Key areas to consider would be image optimization, code minification, and leveraging browser caching to improve page load times.
21. Describe your experience with using Google Tag Manager to implement and manage Google Analytics tracking code and other marketing tags on a website.
I have extensive experience using Google Tag Manager (GTM) to implement and manage Google Analytics tracking, as well as various other marketing tags such as those for Google Ads, Facebook Pixel, and LinkedIn Insight Tag. I've used GTM to deploy page view tracking, event tracking (e.g., button clicks, form submissions, video plays), and custom dimensions/metrics in Google Analytics. This includes setting up data layers to capture specific user interactions and attributes, which are then used to trigger relevant tags in GTM. I'm familiar with creating variables, triggers, and tags within GTM, and I can effectively debug and troubleshoot tracking implementations using GTM's preview and debug mode.
Specifically, I've worked with:
- Data Layer Implementation: Pushing relevant data to the data layer for dynamic tracking.
- Custom JavaScript Variables: Creating custom variables to extract data from the page or manipulate existing data.
- Trigger Configuration: Defining precise trigger conditions based on events, page views, or custom events.
- Tag Configuration: Setting up various tag types, including Google Analytics, Google Ads conversion tracking, and remarketing tags. Example code:
dataLayer.push({
 'event': 'formSubmission',
 'formID': 'contactForm'
});
22. How would you approach measuring the effectiveness of internal site search in helping users find the information they need on a website?
To measure the effectiveness of internal site search, I'd focus on both user behavior and search result quality. Key metrics include: 1) Search Usage Rate: Percentage of visitors using the search function. 2) Click-Through Rate (CTR): Percentage of users clicking on search results. Low CTR indicates irrelevant or poorly ranked results. 3) Zero Result Rate: Percentage of searches returning no results, signifying a content gap or search query understanding issue. 4) Conversion Rate: If applicable, track whether users who use search are more likely to complete desired actions (e.g., purchase, form submission). 5) Search Exit Rate: Percentage of users leaving the site immediately after performing a search.
Further analysis involves examining search query logs for common searches, misspellings, and trending topics. User surveys or feedback forms can provide qualitative data on search satisfaction and areas for improvement. A/B testing different search algorithms or interface designs can help optimize search performance over time.
23. Can you explain the GDPR implications for Google Analytics and how to ensure compliance with data privacy regulations?
GDPR significantly impacts the use of Google Analytics. It mandates obtaining explicit consent for data collection, anonymizing IP addresses, providing data portability, and ensuring users can easily access, rectify, or erase their data. To ensure compliance, you must implement a cookie consent banner, anonymize IP addresses within Google Analytics settings, review and update your privacy policy to clearly explain Google Analytics usage, use data retention controls appropriately, and disable data sharing features if needed. Also, consider using privacy-focused analytics alternatives or implementing differential privacy techniques.
24. How would you use Google Analytics data to inform decisions about website navigation and information architecture?
Google Analytics provides key insights for optimizing website navigation and information architecture. By analyzing user behavior, we can identify areas of improvement. For example, the 'Navigation Summary' report shows which navigation options users utilize most and least, informing decisions on prominence and placement. High bounce rates on specific landing pages accessed through navigation suggest that the navigation label or content doesn't align with user expectations, indicating a need for clearer labeling or content adjustments. Analyzing the 'Behavior Flow' report reveals common user paths and drop-off points, highlighting navigation bottlenecks. If a large percentage of users abandon the site after navigating from page A to page B, it suggests issues with the link between those pages, such as irrelevant content or confusing calls to action.
Furthermore, 'Site Search' data reveals what users are looking for but can't easily find through the existing navigation. This informs the creation of new navigation options or the restructuring of existing ones to improve discoverability. Also, segmenting users by device type (mobile vs. desktop) can help tailor navigation and information architecture for optimal user experience on each platform. By combining these insights, we can iteratively refine the navigation and information architecture to improve user engagement and conversion rates.
25. Describe a situation where you had to present complex Google Analytics data to a non-technical audience. How did you communicate the insights effectively?
I once presented Google Analytics data to our marketing team, who primarily focused on content creation and social media. Instead of diving into metrics like bounce rate and session duration, I focused on telling a story. I started with the overall goal: increasing website engagement and lead generation. Then, I showed a simple chart illustrating website traffic trends over the past quarter, highlighting specific periods of growth and decline. I avoided technical jargon, and instead said things like "more people visited our website during this period" rather than referring to sessions.
To explain the data, I focused on the "why" behind the numbers. For example, if traffic spiked after a particular blog post, I'd showcase the post and explain how its content resonated with the target audience based on keyword analysis. I presented key findings in bullet points with visuals like charts and graphs, and always kept the explanations simple and focused on actionable insights the marketing team could use to improve their content strategy. I showed how traffic from social media converted into leads, which helped them understand the impact of their work on the bottom line. This approach of simplifying the presentation and linking the data to tangible outcomes made it easier for the team to understand the complex analytics.
26. How would you use Google Analytics to evaluate the success of a mobile app marketing campaign?
To evaluate the success of a mobile app marketing campaign using Google Analytics, I'd focus on key metrics within the Google Analytics 4 (GA4) interface. First, I'd track user acquisition: analyzing the sources bringing in new users (campaigns, organic search, referrals). Key metrics here would include new users, source/medium, and cost per acquisition (CPA) if tracking paid campaigns. I'd also closely monitor user engagement, measuring metrics like average engagement time, screen views per user, and user retention rates. Analyzing in-app behavior, specifically conversion events tied to campaign goals (e.g., completing a purchase, signing up for a newsletter), would be crucial. I'd also examine churn rate to understand how quickly users are leaving the app and A/B test different marketing messages/strategies to optimize performance. Ultimately, the success is measured by whether the campaign drove relevant users who engage with the app, convert on key objectives, and exhibit long-term retention.
27. How would you define and measure customer lifetime value (CLTV) using Google Analytics data?
Customer Lifetime Value (CLTV) predicts the total revenue a customer is expected to generate throughout their relationship with your business. In Google Analytics, defining CLTV involves segmenting users based on acquisition channels, demographics, or behavior and then tracking their revenue generation over time. To measure CLTV, you can use Enhanced Ecommerce tracking to capture transaction data linked to user IDs. This allows calculating average purchase value, purchase frequency, and customer lifespan for each segment.
Specifically, while Google Analytics doesn't directly calculate CLTV, you can export the necessary data (transaction revenue, user IDs, and timestamps) to a spreadsheet or data analysis tool. Then, apply a formula like CLTV = (Average Purchase Value * Purchase Frequency * Customer Lifespan) to estimate the value for each customer segment. Reporting in Google Analytics can track the metrics contributing to the CLTV calculation by using custom reports or connecting with other tools like Google Data Studio.
Google Analytics MCQ
Question 1.
A marketing manager is analyzing the performance of different marketing channels and wants to understand how each channel contributes to conversions. Which attribution model would be most suitable to give credit to all touchpoints in the customer journey, assigning more credit to touchpoints that occurred closer in time to the conversion?
Options:
- A) First Interaction Attribution
- B) Last Interaction Attribution
- C) Time Decay Attribution
- D) Linear Attribution
Options:
Question 2.
You are tracking user sign-ups for a loyalty program on your website. You want to analyze how loyalty members interact with your site compared to non-members. Which scope would be most appropriate for a custom dimension tracking 'Loyalty Program Member' (Yes/No)?
options:
Options:
Question 3.
You're setting up cross-domain tracking for a website that spans example.com and example.net. Which of the following steps is essential to prevent self-referrals and ensure accurate data?
Options:
Question 4.
Which of the following is a best practice when setting up Goals in Google Analytics?
Options:
Question 5.
You're setting up event tracking in Google Analytics to track downloads of a PDF document. Which of the following represents the BEST practice implementation for the event category?
Options:
Question 6.
Which of the following UTM parameters is required for accurate campaign tracking in Google Analytics?
Options:
Question 7.
You want to create a calculated metric in Google Analytics to track the average session duration in seconds. Which of the following formulas would correctly achieve this, assuming you have 'sessions' and 'total session duration' metrics available?
Options:
Question 8.
Which of the following is NOT a supported type of Custom Report in Google Analytics?
Options:
Question 9.
What is the most reliable method to exclude internal traffic from your Google Analytics data to ensure accurate reporting?
Options:
Question 10.
Which of the following insights can be directly derived from a User Behavior Flow report in Google Analytics?
options:
Options:
Question 11.
You want to understand how much overlap exists between users in your 'Loyal Customers' and 'High-Value Prospects' audiences. Which Google Analytics report would you use to quickly visualize and analyze this?
Options:
Question 12.
You want to track which products are visible to users on a category page using Enhanced Ecommerce. Which implementation step is crucial for accurately capturing product impressions?
Options:
Question 13.
You notice a significant discrepancy between the number of transactions reported in Google Analytics and your internal sales database. Which of the following is the LEAST likely cause of this discrepancy?
options:
Options:
Question 14.
You're analyzing a Cohort Analysis report in Google Analytics. Which of the following statements BEST describes what this report helps you understand?
Options:
Question 15.
Which of the following statements accurately describes the use of Regular Expressions (RegEx) when configuring filters in Google Analytics 4 (GA4)?
options:
Options:
Question 16.
You are using Google Optimize to conduct A/B tests on your website. Which Google Analytics report would be MOST helpful in understanding how the different variations perform in terms of goal completions and conversion rates?
options:
Options:
Question 17.
Which of the following methods allows you to group content based on rules defined by URL structure in Google Analytics?
options:
Options:
Question 18.
Which of the following metrics is NOT available in Google Analytics' Real-Time reports?
Options:
Question 19.
How does Google Analytics, by default, track users and sessions across different subdomains of the same website (e.g., blog.example.com and shop.example.com)?
Options:
Options:
Question 20.
What is the primary purpose of using segments in Google Analytics?
Options:
Options:
Question 21.
Which of the following statements BEST describes the relationship between bounce rate and website engagement?
Options:
Question 22.
Which of the following methods allows you to import cost data from non-Google advertising platforms (e.g., Facebook Ads, Bing Ads) into Google Analytics to analyze campaign performance comprehensively?
options:
Options:
Question 23.
What is the correct sequence of steps to create a new custom segment in Google Analytics?
options:
Options:
Question 24.
Which of the following scenarios is MOST likely to trigger data sampling in Google Analytics?
Options:
Question 25.
What is the primary benefit of using the Google Analytics API?
Options:
Which Google Analytics skills should you evaluate during the interview phase?
You can't assess everything about a candidate in a single interview, but you can focus on core skills. For Google Analytics, these are the skills that matter most. Evaluating these areas will help you determine if the candidate has the knowledge and skills to succeed in the role.
Understanding of Google Analytics Interface and Features
You can use an assessment test to filter candidates with this skill. An Google Analytics test with relevant MCQs will help you identify candidates with the right interface knowledge.
Ask targeted questions to assess their understanding of the interface.
Describe a time when you used a custom dashboard in Google Analytics to track specific metrics. What were the metrics, and why were they important?
Look for a clear explanation of how they used the dashboard. They should articulate the metrics they chose, and why they were relevant to the business goals. It is a sign of a good answer if they can also describe the action that was taken based on the findings.
Data Analysis and Interpretation
You can filter candidates with strong data analysis skills using an assessment test. Consider using a Data Analysis test with relevant questions.
Here’s a question to see how they tackle an ambiguous problem.
How would you investigate a sudden drop in website traffic reported in Google Analytics?
The candidate should mention investigating possible causes. This includes technical issues, changes in marketing campaigns, or external events. They should also propose steps to diagnose and resolve the issue.
Goal Setting and Conversion Tracking
See if they understand A/B testing as well. A/B tests are a good tool to see goal completion improvements. You can consider A/B testing assessment tests to filter the candidates.
Ask them a question that gets them thinking about how they might improve a website.
Describe your experience setting up and tracking goals in Google Analytics. What are some common challenges you've faced, and how did you overcome them?
The candidate should explain their process for setting up goals. Look for examples of how they overcame challenges, such as inaccurate data or technical issues. They should be able to explain the impact of their work on the website's performance.
3 Tips for Maximizing Your Google Analytics Interview Process
Before you start putting your newfound knowledge of Google Analytics interview questions to use, here are a few tips to help you maximize the effectiveness of your interview process. These tips will ensure you find the best candidate for your team.
1. Prioritize Skill Assessments Before Interviews
Integrating skill assessments before the interview stage streamlines your hiring process and ensures candidates possess the baseline knowledge for the role. This approach helps filter candidates based on demonstrated abilities, saving valuable time for both the hiring team and the applicants.
Adaface offers a range of skill assessments that can effectively evaluate candidates' abilities. For Google Analytics roles, consider using the Google Analytics test, the Digital Marketing test, or the Data Analysis test. These tests provide objective data on a candidate's proficiency.
By using these assessments early, you focus your interview efforts on candidates who have already demonstrated a certain level of competence. This allows you to explore their practical experience and problem-solving skills in greater detail.
2. Outline and Compile Relevant Interview Questions
Time is limited during interviews, so selecting the right questions is paramount. Carefully curate a list of questions that target the most important aspects of the Google Analytics role you're hiring for. This ensures you gather the most relevant information to inform your hiring decision.
Focus on questions that assess a candidate's practical knowledge, problem-solving abilities, and experience with real-world scenarios. Complement your Google Analytics questions with assessments of related skills, such as those covered in our SEO interview questions.
By compiling a targeted set of questions, you'll maximize your ability to evaluate candidates on important fronts, such as their analytical skills and ability to translate data into actionable insights.
3. Ask Insightful Follow-Up Questions
Simply using a list of interview questions isn't enough. To truly assess a candidate's depth of knowledge, asking the right follow-up questions is key. These questions help you uncover whether a candidate genuinely understands the concepts or is merely providing textbook answers.
For example, if a candidate explains how to track website conversions in Google Analytics, a follow-up question could be: "What are some common challenges you've faced when setting up conversion tracking, and how did you overcome them?" This reveals their practical experience and problem-solving abilities.
Evaluate Google Analytics Skills with Precision
Hiring someone with the right Google Analytics skills requires a way to accurately measure their abilities. Using skill tests is the most effective approach to assess a candidate's knowledge and practical application. Check out Adaface's Google Analytics Test and Digital Marketing Test to get started.
Once you've identified top candidates through skills assessments, you can proceed with focused interviews. Sign up now at Adaface to streamline your hiring process or explore our pricing plans to find the best fit for your team.
Google Analytics Test
30 mins | 15 MCQs
The Google Analytics pre-employment test assesses a candidate's ability to use Google Analytics platform to make data-driven decisions for your business. It tests their ability to setup website tracking, analyze website traffic, understand audience demographics and drive more targeted traffic to generate more leads.
Try Google Analytics Test
Download Google Analytics interview questions template in multiple formats
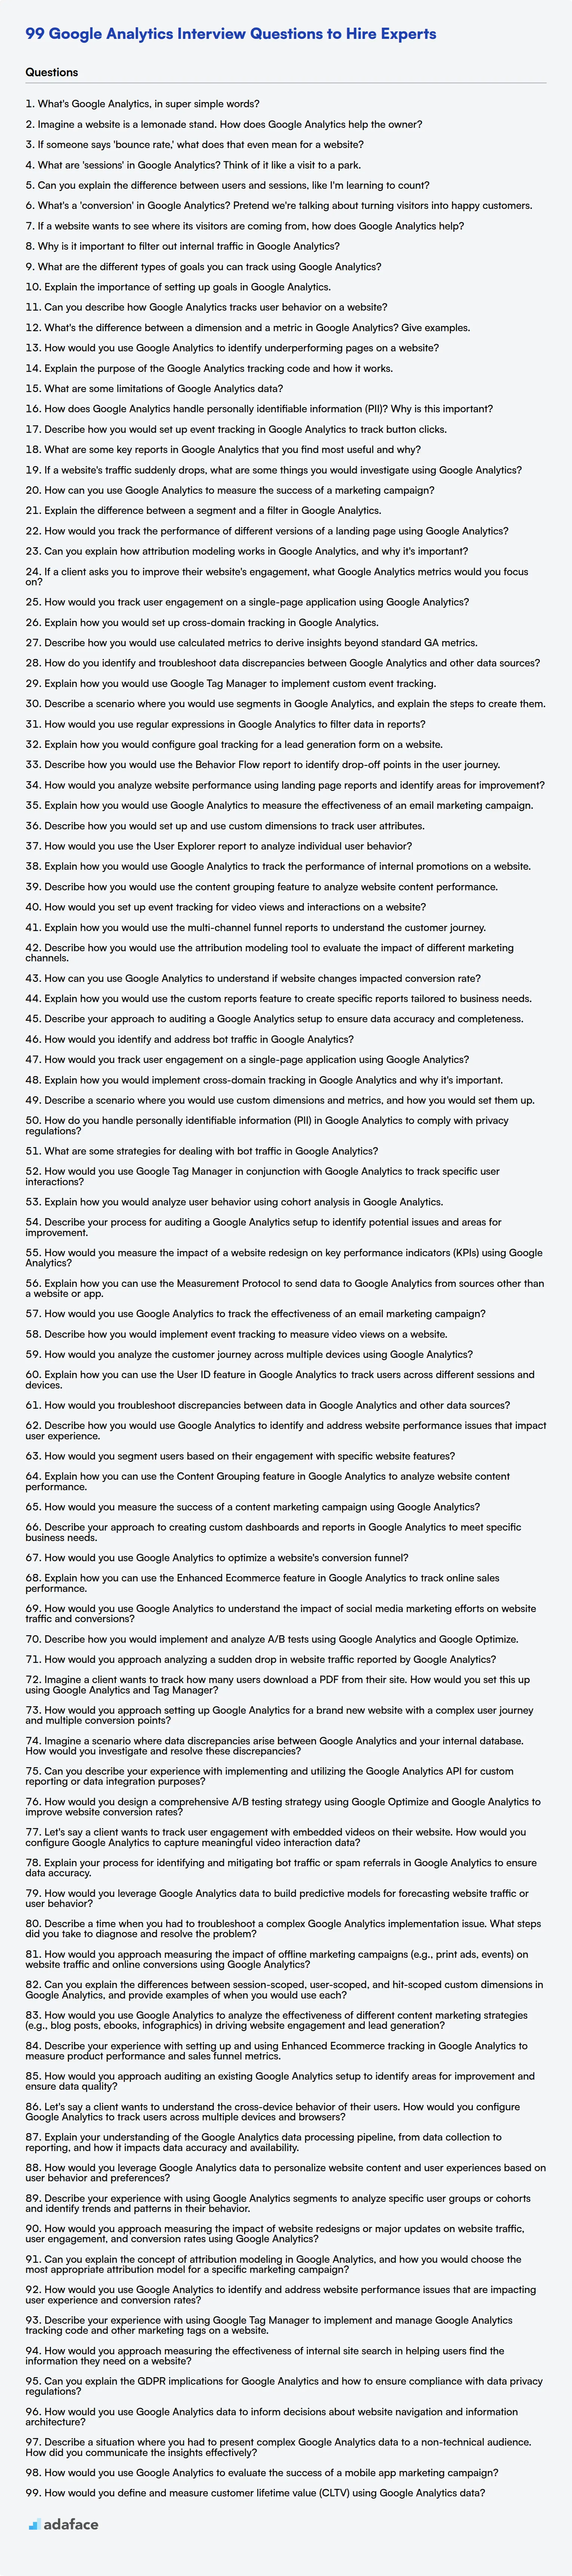
Google Analytics Interview Questions FAQs
What types of Google Analytics interview questions should I ask?
Include a mix of basic, intermediate, advanced, and expert-level questions to assess candidates' understanding and practical skills.
How can I maximize my Google Analytics interview process?
Focus on understanding the candidate's problem-solving approach and how they apply Google Analytics insights to drive business decisions. Evaluate their practical experience through scenario-based questions.
What are some key areas to cover in a Google Analytics interview?
Explore topics like data collection, analysis, reporting, goal setting, and familiarity with GA4. Assess their understanding of key metrics and dimensions.
How do I evaluate a candidate's Google Analytics skills effectively?
Use a combination of theoretical questions and real-world scenarios. Ask them to analyze data, identify trends, and suggest improvements.
What are the benefits of asking scenario-based Google Analytics questions?
Scenario questions help assess how candidates apply their knowledge to solve real-world problems. They reveal their thought process and ability to think critically.
Why is it important to ask questions about GA4 in Google Analytics interviews?
GA4 is the latest version of Google Analytics, so assessing a candidate's familiarity with its features, capabilities, and differences from Universal Analytics is important for future-proofing your team.
40 min skill tests.
No trick questions.
Accurate shortlisting.
We make it easy for you to find the best candidates in your pipeline with a 40 min skills test.
Try for freeRelated posts
Free resources

Join 1200+ companies in 80+ countries.
Try the most candidate friendly skills assessment tool today.

40 min tests.
No trick questions.
Accurate shortlisting.
No trick questions.
Accurate shortlisting.