
8 general Data Storytelling interview questions and answers
10 intermediate Data Storytelling interview questions and answers to ask mid-tier analysts
9 Data Storytelling interview questions and answers related to narrative strategies
7 situational Data Storytelling interview questions with answers for hiring top analysts

Interviewing data analysts can be challenging, especially when evaluating their ability to tell compelling data stories. By asking the right questions, you can uncover the depth of their skills and ensure they align with your expectations, similar to identifying the most effective recruitment strategies.
This blog post provides you with a list of carefully curated data storytelling interview questions for different analyst levels, from junior to senior. It covers various aspects including general questions, visualization techniques, narrative strategies, and situational scenarios.
By utilizing this guide, you can streamline your interview process and identify top data storytelling talent to drive insightful analytics in your organization. Consider supplementing the interview with a data storytelling test to further ensure candidate suitability.
Table of contents
8 general Data Storytelling interview questions and answers
20 Data Storytelling interview questions to ask junior analysts
10 intermediate Data Storytelling interview questions and answers to ask mid-tier analysts
14 Data Storytelling interview questions about visualization techniques
9 Data Storytelling interview questions and answers related to narrative strategies
7 situational Data Storytelling interview questions with answers for hiring top analysts
Which Data Storytelling skills should you evaluate during the interview phase?
Hire Top Data Storytellers with Skills Tests and Targeted Interview Questions
Download Data Storytelling interview questions template in multiple formats
8 general Data Storytelling interview questions and answers
To evaluate if your candidates have the knack for transforming raw data into compelling narratives, dive into these 8 general Data Storytelling interview questions. Use this list when you need to uncover their ability to blend data insights with engaging storytelling.
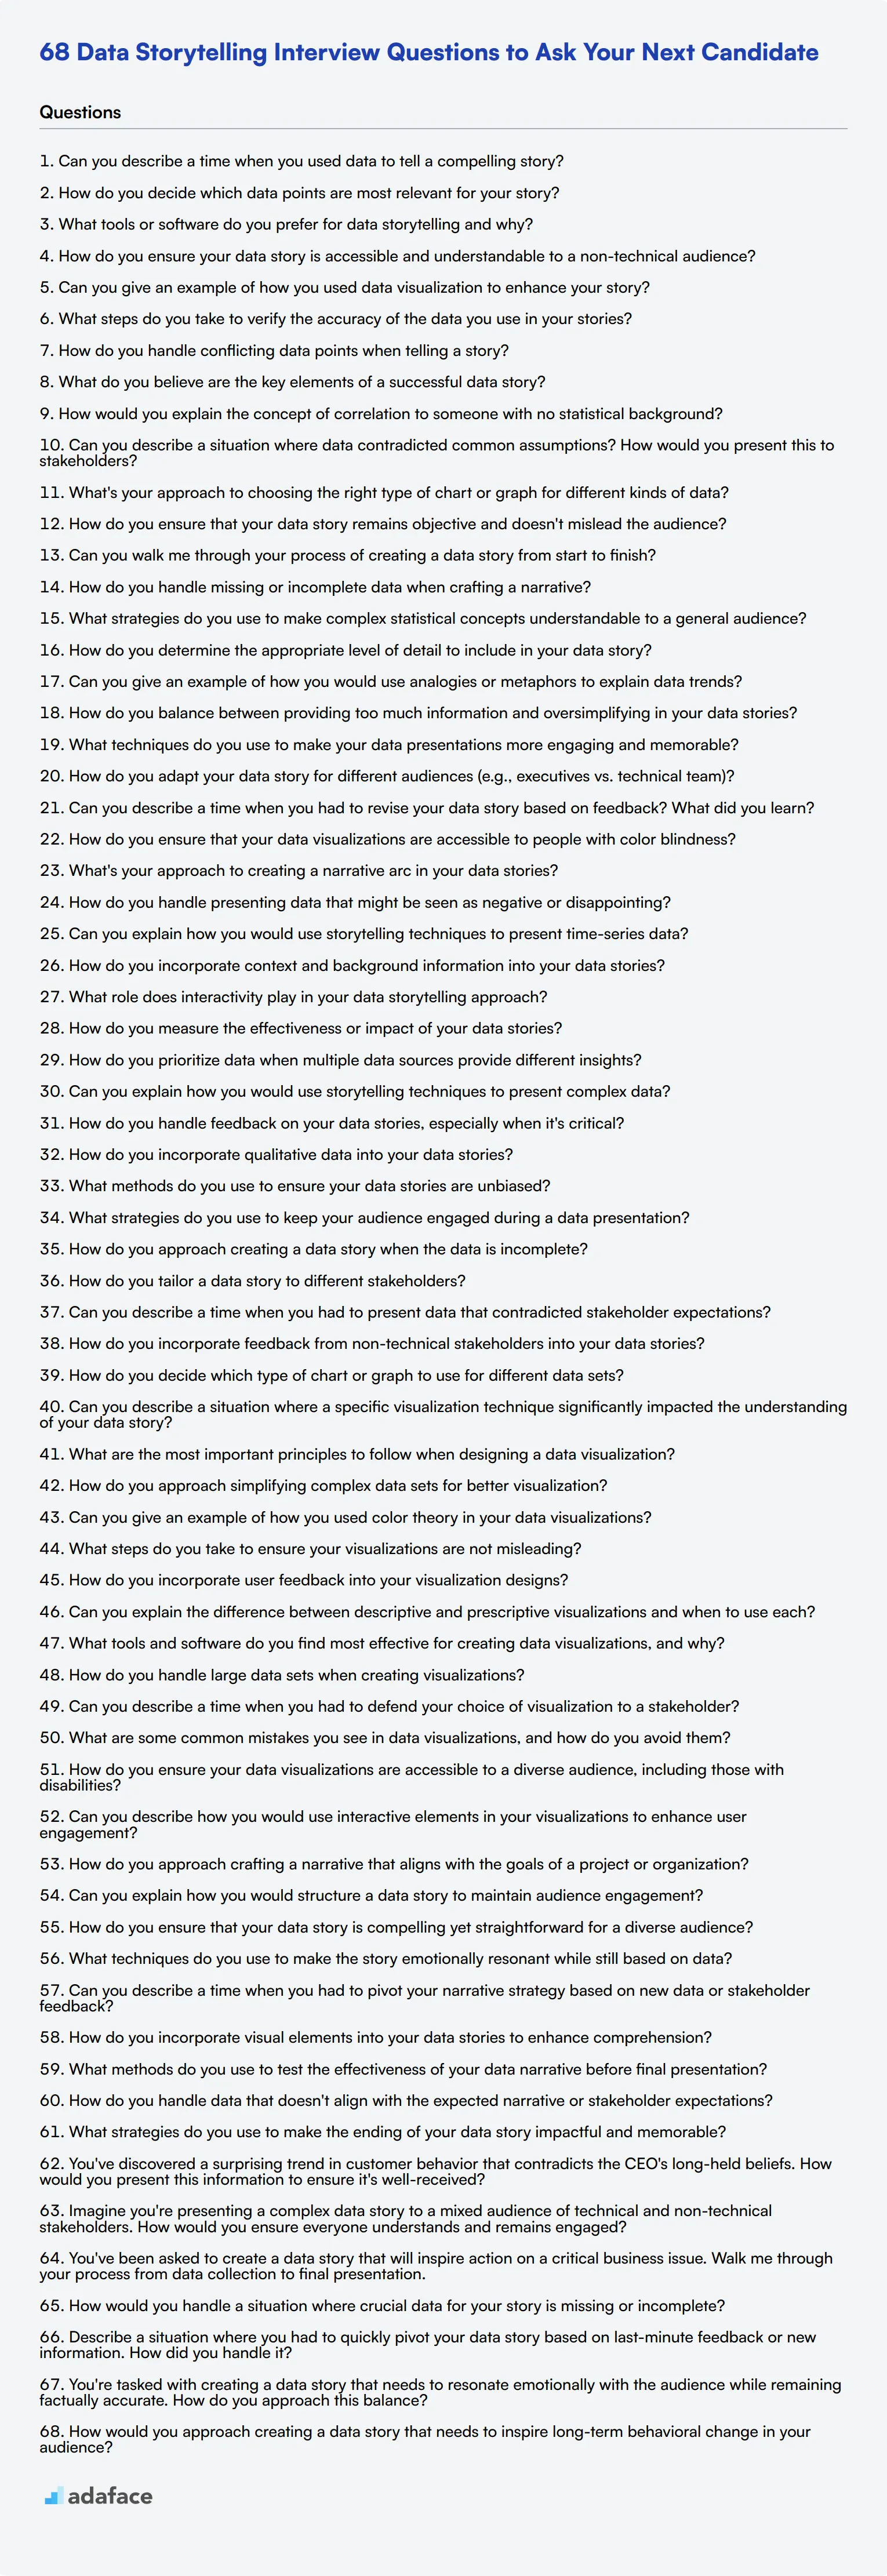
1. Can you describe a time when you used data to tell a compelling story?
A candidate should be able to articulate a specific example from their past experience where they used data to craft a story that achieved a particular business goal. They should detail the context, the data sources they used, the narrative they built, and the impact it had.
Look for candidates who can demonstrate their ability to not just analyze data but also communicate its significance effectively. A strong response will include clear examples of how their storytelling led to actionable insights or decisions.
2. How do you decide which data points are most relevant for your story?
Candidates should explain their process for identifying key data points. This often involves understanding the audience's needs, the goals of the story, and using data analysis techniques to find the most impactful metrics.
An ideal response will show a balance between technical proficiency and an understanding of the narrative's purpose. Look for mentions of audience consideration and prioritizing data that drives the story's message home.
3. What tools or software do you prefer for data storytelling and why?
The candidate might mention tools such as Tableau, Power BI, or even Excel for visualizing data. They should also explain why they prefer these tools, which might be due to ease of use, powerful features, or compatibility with other systems.
A good answer will highlight not just the tools, but also the candidate's thought process in choosing them. Look for a clear rationale behind their choices and how these tools have helped them in past projects.
4. How do you ensure your data story is accessible and understandable to a non-technical audience?
Candidates should discuss techniques such as simplifying complex data, using visual aids, and avoiding jargon. They might also mention tailoring the story to the audience's level of understanding and focusing on key insights rather than overwhelming details.
Strong candidates will emphasize their ability to bridge the gap between data and storytelling, ensuring clarity and engagement. Look for evidence of past success in making complex data accessible to all stakeholders.
5. Can you give an example of how you used data visualization to enhance your story?
They should provide a specific example, detailing the type of visualization used (e.g., bar charts, line graphs, heat maps) and how it helped communicate the data more effectively. They should also explain the impact of the visualization on the audience.
An ideal answer will showcase the candidate's creativity and technical skill in using visualizations to clarify and emphasize key points. Look for a demonstrated understanding of best practices in data visualization.
6. What steps do you take to verify the accuracy of the data you use in your stories?
Candidates should mention methods such as cross-referencing with multiple sources, using data validation techniques, and regularly updating their datasets. They might also discuss the importance of transparency in their data sources.
Look for a meticulous approach to data accuracy and reliability. A strong response will emphasize the candidate's commitment to maintaining the integrity of their data stories.
7. How do you handle conflicting data points when telling a story?
They should explain their process for resolving conflicts, which might include investigating the sources of the discrepancies, consulting with stakeholders, and using statistical methods to determine the most accurate data.
A thorough answer will demonstrate the candidate's problem-solving skills and their ability to maintain credibility. Look for examples of how they've successfully navigated conflicting data in the past.
8. What do you believe are the key elements of a successful data story?
Candidates might mention elements such as a clear narrative structure, relevant and accurate data, compelling visualizations, and a focus on actionable insights. They should also emphasize the importance of understanding the audience's needs.
A strong response will show a holistic understanding of data storytelling. Look for a candidate who can articulate how each element contributes to the overall effectiveness of the story.
20 Data Storytelling interview questions to ask junior analysts
To assess the data storytelling abilities of junior analysts, use these interview questions. They help evaluate candidates' understanding of basic concepts and their ability to communicate insights effectively. Ask these questions to gauge their potential in turning raw data into compelling narratives.
- How would you explain the concept of correlation to someone with no statistical background?
- Can you describe a situation where data contradicted common assumptions? How would you present this to stakeholders?
- What's your approach to choosing the right type of chart or graph for different kinds of data?
- How do you ensure that your data story remains objective and doesn't mislead the audience?
- Can you walk me through your process of creating a data story from start to finish?
- How do you handle missing or incomplete data when crafting a narrative?
- What strategies do you use to make complex statistical concepts understandable to a general audience?
- How do you determine the appropriate level of detail to include in your data story?
- Can you give an example of how you would use analogies or metaphors to explain data trends?
- How do you balance between providing too much information and oversimplifying in your data stories?
- What techniques do you use to make your data presentations more engaging and memorable?
- How do you adapt your data story for different audiences (e.g., executives vs. technical team)?
- Can you describe a time when you had to revise your data story based on feedback? What did you learn?
- How do you ensure that your data visualizations are accessible to people with color blindness?
- What's your approach to creating a narrative arc in your data stories?
- How do you handle presenting data that might be seen as negative or disappointing?
- Can you explain how you would use storytelling techniques to present time-series data?
- How do you incorporate context and background information into your data stories?
- What role does interactivity play in your data storytelling approach?
- How do you measure the effectiveness or impact of your data stories?
10 intermediate Data Storytelling interview questions and answers to ask mid-tier analysts
To determine if your mid-tier analysts have the right mix of analytical prowess and storytelling skills, use these intermediate Data Storytelling interview questions. These questions are designed to dig deeper into their understanding and ability to effectively communicate data insights.
1. How do you prioritize data when multiple data sources provide different insights?
When multiple data sources provide different insights, it’s important to prioritize based on data quality, relevance, and reliability. I start by assessing the source of each dataset, considering factors like the method of data collection, sample size, and potential biases.
Next, I evaluate the relevance of each data source to the specific question or problem at hand. Often, the most directly relevant data will take precedence. Cross-referencing with trusted sources or seeking expert opinions can also help determine the most reliable insights.
Look for candidates who demonstrate a methodical approach to evaluating data sources and can articulate the reasoning behind their prioritization. Follow up by asking for examples of past experiences where conflicting data was a challenge.
2. Can you explain how you would use storytelling techniques to present complex data?
To present complex data using storytelling techniques, I start by identifying the main message or insight that I want to convey. I then build a narrative around this key point, using data to support and illustrate the story.
I employ visual aids like charts and graphs to make the data more relatable and easier to understand. Additionally, I use analogies or real-life examples to draw parallels that the audience can easily grasp. The goal is to make the data not just informative but also engaging.
An ideal candidate should show an ability to distill complex data into clear, compelling narratives. Look for their use of visuals, analogies, and structured storytelling elements. You can explore more on skills required for data analysts to understand what to expect.
3. How do you handle feedback on your data stories, especially when it's critical?
Handling feedback, especially critical feedback, is crucial for improving the quality of data stories. I approach feedback with an open mind, viewing it as an opportunity to refine and enhance my work. I actively listen to the concerns and suggestions raised without getting defensive.
I then assess the feedback to see which points are actionable and how they can improve the clarity, accuracy, or impact of the story. Collaborative iteration with stakeholders ensures the final story meets everyone’s needs and expectations.
Look for a candidate who demonstrates a constructive attitude towards feedback and can provide specific examples of how they’ve used feedback to improve their work. This shows they value continuous improvement and collaboration.
4. How do you incorporate qualitative data into your data stories?
Incorporating qualitative data into data stories involves blending narrative elements with quantitative insights to provide a fuller picture. I start by identifying relevant qualitative insights, such as customer testimonials, interviews, or observational notes, that align with the quantitative data.
These qualitative elements can be used to add context, highlight real-world implications, or humanize the data. By weaving these stories alongside the numbers, I create a more compelling and relatable narrative.
Candidates should show an understanding of the value of qualitative data and provide examples of how they've successfully integrated it into their stories. This indicates their ability to create richer, more nuanced data narratives.
5. What methods do you use to ensure your data stories are unbiased?
To ensure data stories are unbiased, I follow several key practices. First, I carefully select data sources that are reputable and reliable. I also strive for transparency by clearly stating any assumptions or limitations of the data and methodology.
Additionally, I seek to present data in a balanced way, showing multiple perspectives and avoiding cherry-picking data that only supports a single viewpoint. Peer reviews and feedback from colleagues can also help identify any unintended biases.
An ideal response should reflect a commitment to ethical storytelling and an awareness of the potential for bias. Look for candidates who can articulate specific strategies for maintaining objectivity in their work.
6. What strategies do you use to keep your audience engaged during a data presentation?
To keep my audience engaged during a data presentation, I use a mix of visual aids, storytelling techniques, and interactive elements. Visual aids like charts, graphs, and infographics help make data more digestible and visually appealing.
Storytelling techniques, such as building a narrative arc and using real-life examples, help to contextualize the data and make it more relevant. Interactive elements like Q&A sessions or live data demonstrations can also capture attention and encourage participation.
Candidates should show a well-rounded approach to engagement, blending visuals, narrative, and interactivity. Look for examples of past presentations where they successfully kept the audience engaged and interested.
7. How do you approach creating a data story when the data is incomplete?
When dealing with incomplete data, I first assess the gaps and their potential impact on the analysis. I then look for ways to supplement the missing data, either through secondary sources, estimates, or assumptions based on existing information.
I make sure to clearly communicate any limitations due to incomplete data and how they might affect the conclusions. Transparency is key to maintaining trust and credibility. In some cases, it might also be beneficial to include a plan for future data collection to fill in these gaps.
Look for candidates who can demonstrate resourcefulness and transparency when dealing with incomplete data. They should be able to explain their strategies for addressing data gaps and clearly communicate the implications.
8. How do you tailor a data story to different stakeholders?
Tailoring a data story to different stakeholders involves understanding their specific needs, interests, and level of expertise. For example, executives may require high-level insights and strategic implications, while technical teams might need more detailed data and methodologies.
I start by identifying the key message for each stakeholder group and adjust the level of detail and presentation style accordingly. Customizing visuals, using relevant examples, and focusing on the most pertinent data points can help ensure the story resonates with each audience.
Candidates should demonstrate an ability to adapt their communication style and content to various audiences. Look for examples of how they've successfully tailored data stories for different stakeholders in the past.
9. Can you describe a time when you had to present data that contradicted stakeholder expectations?
Presenting data that contradicts stakeholder expectations requires tact and clear communication. I start by presenting the data objectively, focusing on the facts and avoiding any personal biases. It’s important to provide context and explain the methodology behind the data collection and analysis.
I also prepare for potential questions and concerns, offering evidence and reasoning to support the findings. Engaging in an open dialogue and being ready to discuss implications and next steps can help manage stakeholder reactions.
Look for candidates who can demonstrate their ability to handle challenging situations professionally and diplomatically. They should be able to provide specific examples and explain their approach to maintaining credibility and trust.
10. How do you incorporate feedback from non-technical stakeholders into your data stories?
Incorporating feedback from non-technical stakeholders involves actively listening and translating their input into actionable changes. I make sure to clarify any points of confusion and ask follow-up questions to fully understand their perspective.
I then adjust the data story to address their concerns, which might involve simplifying explanations, adding more context, or changing how the data is visualized. Ensuring that the story remains accessible and understandable to non-technical audiences is key.
Candidates should show strong communication skills and an ability to bridge the gap between technical and non-technical stakeholders. Look for examples of how they've successfully integrated feedback to improve their data stories.
14 Data Storytelling interview questions about visualization techniques
To effectively evaluate candidates' skills in data visualization techniques, you can use this curated list of questions. These questions will help you determine if applicants have the right expertise to transform data into visual stories, a crucial skill for roles such as data analyst and data scientist.
- How do you decide which type of chart or graph to use for different data sets?
- Can you describe a situation where a specific visualization technique significantly impacted the understanding of your data story?
- What are the most important principles to follow when designing a data visualization?
- How do you approach simplifying complex data sets for better visualization?
- Can you give an example of how you used color theory in your data visualizations?
- What steps do you take to ensure your visualizations are not misleading?
- How do you incorporate user feedback into your visualization designs?
- Can you explain the difference between descriptive and prescriptive visualizations and when to use each?
- What tools and software do you find most effective for creating data visualizations, and why?
- How do you handle large data sets when creating visualizations?
- Can you describe a time when you had to defend your choice of visualization to a stakeholder?
- What are some common mistakes you see in data visualizations, and how do you avoid them?
- How do you ensure your data visualizations are accessible to a diverse audience, including those with disabilities?
- Can you describe how you would use interactive elements in your visualizations to enhance user engagement?
9 Data Storytelling interview questions and answers related to narrative strategies
To determine whether your applicants can effectively use narrative strategies in data storytelling, ask them some of these interview questions. These questions will help you gauge their understanding of storytelling techniques and how they can transform data into compelling narratives.
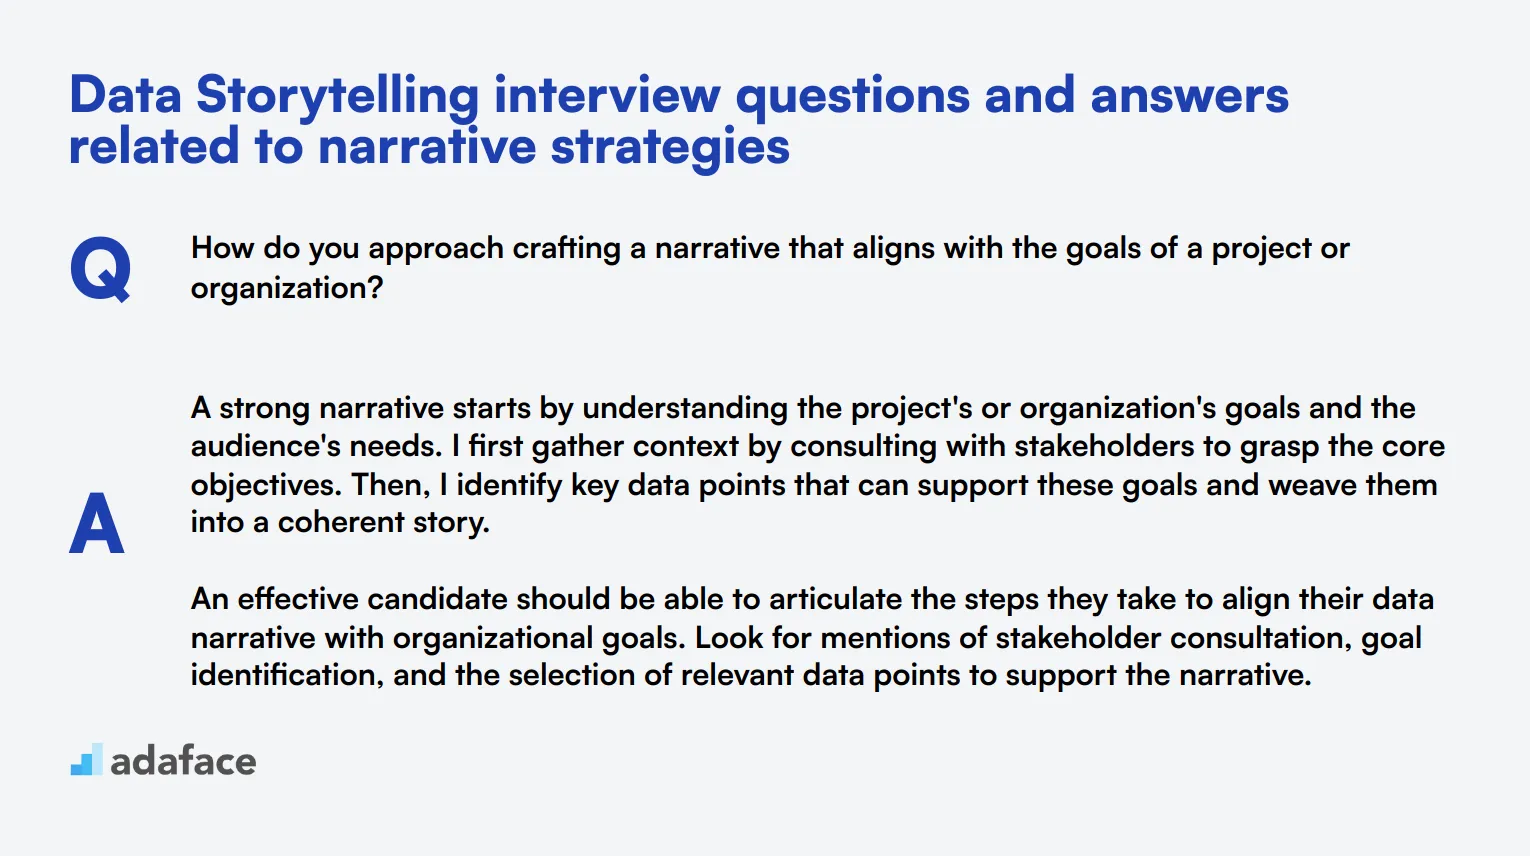
1. How do you approach crafting a narrative that aligns with the goals of a project or organization?
A strong narrative starts by understanding the project's or organization's goals and the audience's needs. I first gather context by consulting with stakeholders to grasp the core objectives. Then, I identify key data points that can support these goals and weave them into a coherent story.
An effective candidate should be able to articulate the steps they take to align their data narrative with organizational goals. Look for mentions of stakeholder consultation, goal identification, and the selection of relevant data points to support the narrative.
2. Can you explain how you would structure a data story to maintain audience engagement?
To maintain audience engagement, I structure the data story with a clear beginning, middle, and end. The beginning introduces the context and main question. The middle presents data insights and analysis, and the end provides conclusions and actionable recommendations. I also use visuals and anecdotes to make complex data more relatable and engaging.
When evaluating responses, look for a clear understanding of narrative structure and techniques to maintain engagement, such as using visuals, anecdotes, and a logical flow of information.
3. How do you ensure that your data story is compelling yet straightforward for a diverse audience?
I ensure the data story is compelling by focusing on key insights and using simple, jargon-free language. I also tailor the narrative to the audience's level of understanding by incorporating relatable examples and clear visuals. It's essential to strike a balance between depth and simplicity to keep the story engaging without overwhelming the audience.
Ideal responses should highlight the candidate's ability to simplify complex data and make it accessible to a diverse audience. Look for mentions of tailoring the narrative and using relatable examples.
4. What techniques do you use to make the story emotionally resonant while still based on data?
To make the story emotionally resonant, I connect the data to real-life implications or human experiences. For instance, if the data shows a trend in healthcare, I might include a patient story that highlights the impact of the trend. This approach helps the audience see the real-world relevance of the data.
Examine whether the candidate can blend emotional elements with factual data effectively. Look for the use of real-life examples and stories that make data more relatable and impactful.
5. Can you describe a time when you had to pivot your narrative strategy based on new data or stakeholder feedback?
In one project, initial data suggested a particular trend, but further analysis revealed a different insight. I had to pivot the narrative and focus on the new findings. I communicated the change to stakeholders, explaining the reasons behind the shift and how the new data provided a more accurate picture.
A good response will demonstrate flexibility and the ability to adapt narrative strategies based on new information. Look for examples of clear communication with stakeholders and a rationale for the pivot.
6. How do you incorporate visual elements into your data stories to enhance comprehension?
Visual elements are crucial in making data stories more comprehensible. I select visuals that best represent the data, such as bar charts for comparisons or line graphs for trends. I also ensure that these visuals are clear and labeled appropriately to avoid any misinterpretation.
Candidates should demonstrate a thoughtful approach to selecting and designing visuals. Look for an understanding of different types of visuals and how they can enhance data comprehension.
7. What methods do you use to test the effectiveness of your data narrative before final presentation?
I often test the effectiveness of my data narrative by conducting dry runs with colleagues or small focus groups. This helps me gather feedback on clarity and engagement. I also use metrics like audience questions and engagement levels during these tests to gauge the narrative's impact.
Look for candidates who emphasize the importance of testing and feedback. They should mention specific methods for gathering feedback and metrics for assessing the narrative's effectiveness.
8. How do you handle data that doesn't align with the expected narrative or stakeholder expectations?
When data doesn't align with the expected narrative, I first analyze it to understand why. I then communicate these findings transparently to stakeholders, providing evidence and explaining any discrepancies. It's crucial to stay objective and let the data guide the story, even if it contradicts initial assumptions.
Ideal responses should reflect a commitment to transparency and objectivity. Look for evidence of analytical thinking and effective communication with stakeholders.
9. What strategies do you use to make the ending of your data story impactful and memorable?
To make the ending impactful, I summarize the key findings and link them back to the initial question or goal. I also provide clear, actionable recommendations based on the data. Including a compelling call-to-action or thought-provoking statement can leave a lasting impression on the audience.
Evaluate whether the candidate can effectively summarize key points and provide actionable insights. Look for strategies that make the conclusion memorable and relevant to the audience.
7 situational Data Storytelling interview questions with answers for hiring top analysts
Ready to uncover the true storytelling prowess of your data analyst candidates? These situational questions will help you dive deep into their ability to weave compelling narratives from raw data. Use these questions to assess how candidates handle real-world scenarios and communicate insights effectively to various stakeholders.
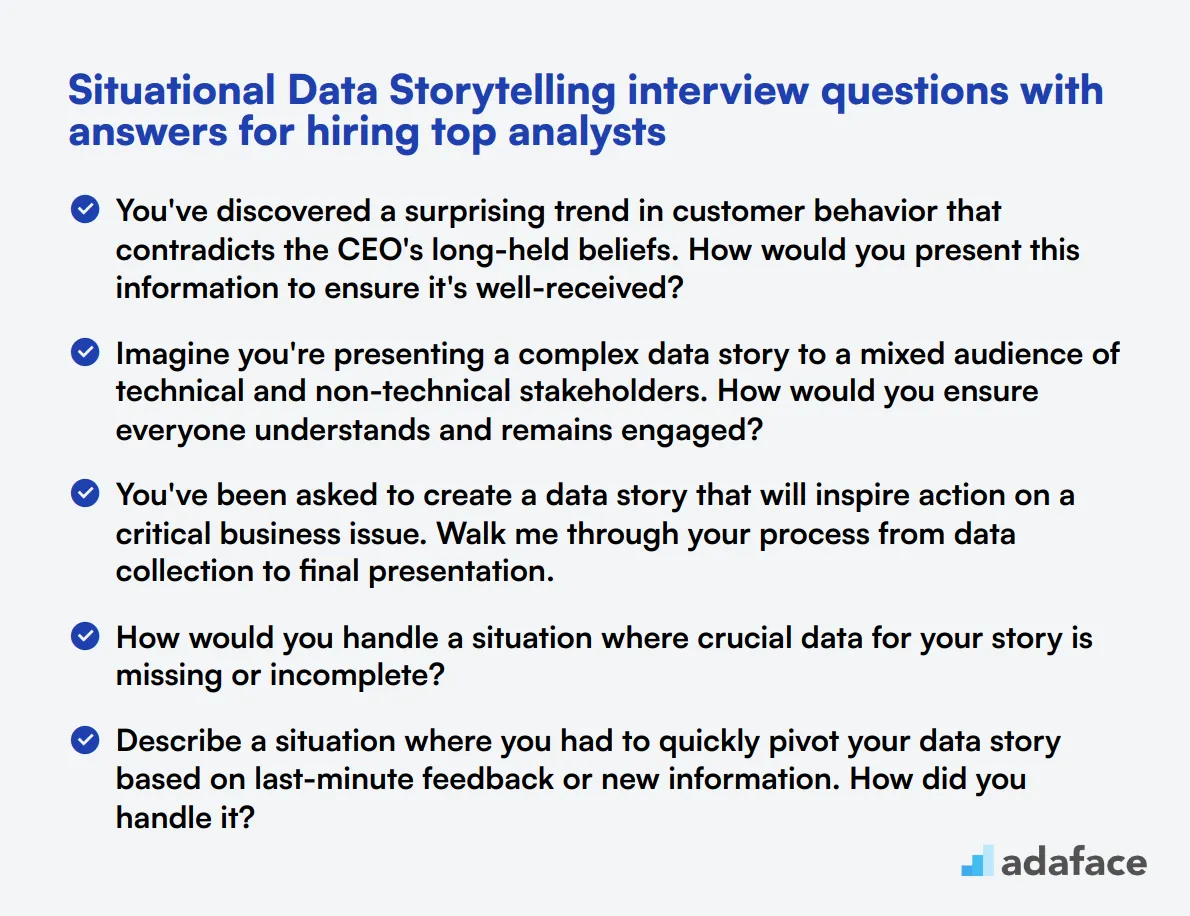
1. You've discovered a surprising trend in customer behavior that contradicts the CEO's long-held beliefs. How would you present this information to ensure it's well-received?
A strong candidate should outline a tactful approach to presenting potentially controversial findings:
- Start by acknowledging the CEO's existing perspective and its historical validity.
- Present the data methodically, explaining the analysis process and highlighting the reliability of the sources.
- Use clear, data visualizations to illustrate the trend effectively.
- Frame the findings as an opportunity for the company to adapt and improve, rather than a criticism of past strategies.
- Come prepared with actionable recommendations based on the new insights.
Look for candidates who emphasize the importance of preparation, empathy, and a solutions-oriented approach. The ideal response should demonstrate an understanding of the delicate balance between presenting accurate data and maintaining positive stakeholder relationships.
2. Imagine you're presenting a complex data story to a mixed audience of technical and non-technical stakeholders. How would you ensure everyone understands and remains engaged?
An effective answer should include strategies for catering to diverse audience needs:
- Begin with a high-level overview that sets the context for all attendees.
- Use a layered approach, starting with the main insights and progressively adding detail.
- Employ analogies or real-world examples to explain complex concepts.
- Utilize interactive elements or live data exploration to keep the audience engaged.
- Prepare supplementary materials with varying levels of technical depth for different stakeholders.
The ideal candidate should demonstrate an ability to read the room and adjust their presentation style on the fly. Look for responses that show flexibility and a keen awareness of audience comprehension levels throughout the presentation.
3. You've been asked to create a data story that will inspire action on a critical business issue. Walk me through your process from data collection to final presentation.
A comprehensive answer should cover the following steps:
- Define the core message and desired outcome clearly.
- Identify and collect relevant data from various sources.
- Clean and preprocess the data to ensure accuracy.
- Conduct exploratory data analysis to uncover key insights.
- Determine the most impactful visualizations to convey the message.
- Craft a narrative arc that leads logically to the call-to-action.
- Design an engaging presentation with a mix of visuals and text.
- Practice the delivery and prepare for potential questions.
Look for candidates who emphasize the importance of understanding the audience and tailoring the story to their needs and interests. The best responses will also mention iterative refinement of the story based on feedback and rehearsals.
4. How would you handle a situation where crucial data for your story is missing or incomplete?
A strong candidate should outline a systematic approach to dealing with data gaps:
- Assess the impact of the missing data on the overall story and conclusions.
- Explore alternative data sources or proxy measures that could fill the gap.
- Consider using statistical methods like imputation, if appropriate.
- Clearly communicate the limitations of the analysis due to missing data.
- Provide caveats and explain potential implications of the data gap.
- If possible, present multiple scenarios based on different assumptions about the missing data.
The ideal response should demonstrate transparency about data limitations and a commitment to maintaining the integrity of the analysis. Look for candidates who show creativity in problem-solving while also being honest about what can and cannot be concluded from incomplete data.
5. Describe a situation where you had to quickly pivot your data story based on last-minute feedback or new information. How did you handle it?
A strong answer should highlight adaptability and quick thinking:
- Briefly explain the original story and the nature of the new information.
- Describe the process of rapidly reassessing the data and its implications.
- Explain how the narrative was adjusted to incorporate the new insights.
- Discuss any challenges in making quick changes while maintaining story coherence.
- Highlight how the final presentation was improved by the last-minute pivot.
Look for candidates who demonstrate grace under pressure and the ability to maintain data integrity while being flexible. The best responses will also mention lessons learned from the experience and how it improved their future storytelling processes.
6. You're tasked with creating a data story that needs to resonate emotionally with the audience while remaining factually accurate. How do you approach this balance?
An effective response should address both the emotional and factual aspects of storytelling:
- Start by identifying the key emotional drivers related to the data topic.
- Use personal anecdotes or case studies to create an emotional connection.
- Employ vivid, relatable metaphors to explain complex data concepts.
- Balance emotional appeals with clear, factual data presentations.
- Use color and design elements strategically to evoke appropriate emotions.
- Ensure all emotional elements directly support and don't distort the data-driven message.
The ideal candidate should demonstrate an understanding of the power of emotion in storytelling while maintaining a strong commitment to data accuracy. Look for responses that show thoughtful consideration of ethical implications when using emotional appeals in data presentations.
7. How would you approach creating a data story that needs to inspire long-term behavioral change in your audience?
A comprehensive answer should include strategies for creating lasting impact:
- Begin by understanding the current behaviors and motivations of the audience.
- Use data to clearly illustrate the need for change and potential benefits.
- Break down the long-term goal into smaller, actionable steps supported by data.
- Incorporate success stories or case studies to show the change is achievable.
- Use predictive analytics to show potential future outcomes of changed behavior.
- Design follow-up materials or dashboards to help track progress over time.
Look for candidates who emphasize the importance of making the data personally relevant to the audience. The best responses will also mention strategies for maintaining engagement beyond the initial presentation, such as regular data updates or interactive tools for self-monitoring progress.
Which Data Storytelling skills should you evaluate during the interview phase?
Evaluating a candidate's Data Storytelling skills in just one interview can be challenging. However, there are core skills that are pivotal to successful data storytelling, which must be assessed to ensure a candidate’s fit for the role.
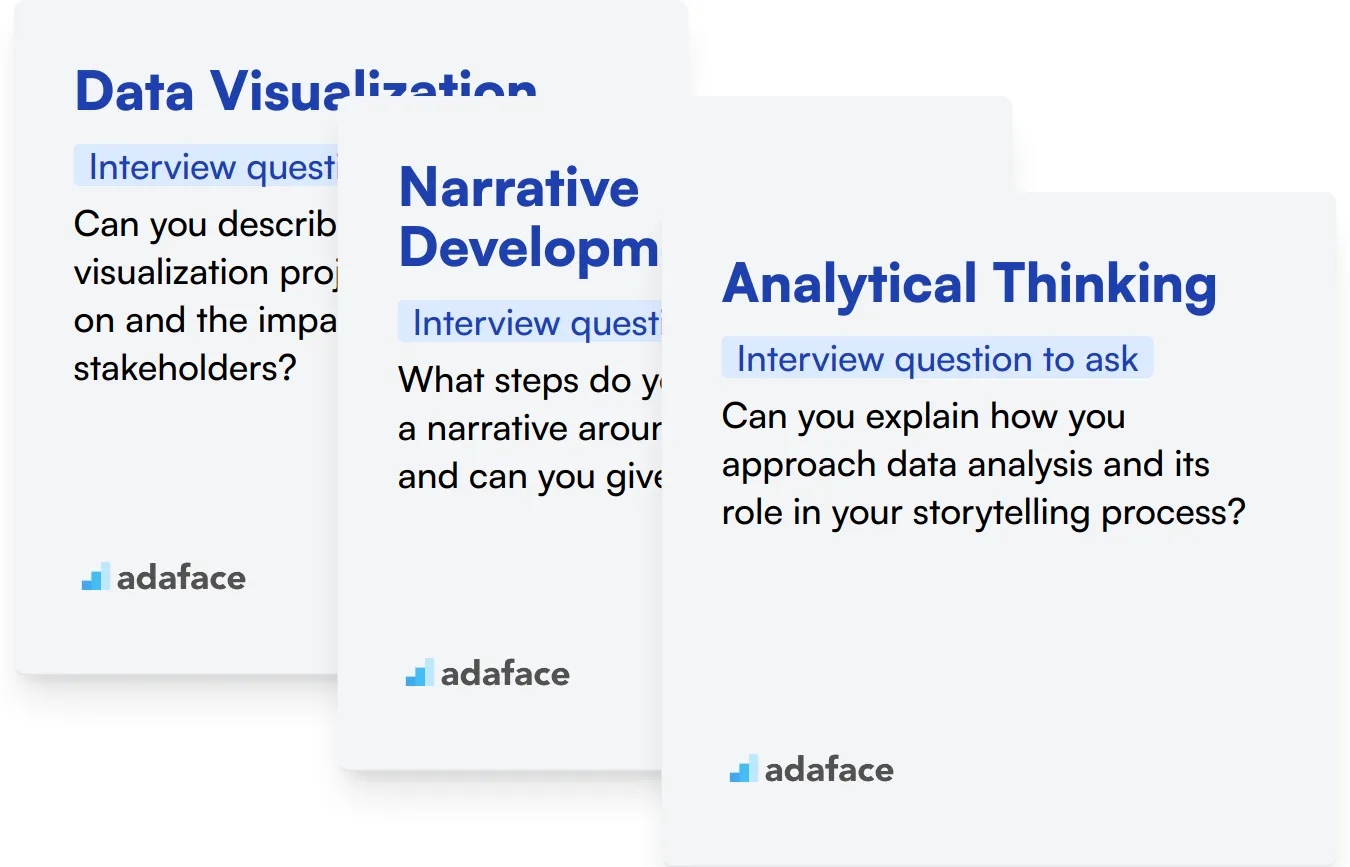
Data Visualization
To evaluate this skill, consider using an assessment test with relevant MCQs that focus on visualization techniques. You can explore our library and use the D3.js test to gauge the candidate's proficiency.
Additionally, you can ask targeted interview questions to further assess this subskill.
Can you describe a data visualization project you worked on and the impact it had on stakeholders?
When asking this question, look for responses that detail the project scope, the visualization tools used, and specific outcomes. Candidates should demonstrate an understanding of how their visualizations enhanced comprehension and led to actionable insights.
Narrative Development
Consider utilizing an assessment test that includes relevant MCQs to evaluate storytelling abilities. While there's no specific test in our library for this skill, exploring general narrative strategy assessments could be useful.
You can also ask candidates to discuss how they approach narrative development in their data storytelling.
What steps do you take to create a narrative around data insights, and can you give an example?
Pay attention to their explanation of the process they follow, including how they identify key messages and tailor narratives to different audiences. Strong candidates will outline a clear method that enhances communication.
Analytical Thinking
To assess analytical thinking, consider using our Data Analysis test, which includes relevant MCQs that challenge candidates to think critically about data.
You may also want to pose questions that require candidates to demonstrate their analytical skills.
Can you explain how you approach data analysis and its role in your storytelling process?
Look for candidates who can articulate a structured approach to analysis and provide examples of how their findings influenced their storytelling. This indicates a solid grasp of analytical thinking.
Hire Top Data Storytellers with Skills Tests and Targeted Interview Questions
Looking to hire someone with data storytelling skills? It's important to accurately assess these abilities. A mix of technical know-how and communication skills is key for effective data storytellers.
The most reliable way to evaluate these skills is through targeted tests. Consider using a Data Storytelling Test or Data Analysis Test to gauge candidates' abilities.
After using these tests to shortlist top applicants, you can invite them for interviews. Use the interview questions provided in this post to dig deeper into their experience and approach to data storytelling.
Ready to streamline your hiring process for data storytellers? Sign up to access our range of assessment tools and find your ideal candidate efficiently.
Data Storytelling Test
40 mins | 16 MCQs
This test evaluates candidates' knowledge and skills in the field of data storytelling, data interpretation, business intelligence development and data analysis.
Try Data Storytelling Test
Download Data Storytelling interview questions template in multiple formats
Data Storytelling Interview Questions FAQs
What is data storytelling?
Data storytelling is the process of translating complex data analyses into understandable, insightful, and engaging narratives.
How important is data visualization in data storytelling?
Data visualization is crucial in data storytelling. It helps present data clearly and effectively, making it easier for the audience to grasp insights.
What skills should a data storyteller have?
A data storyteller should have strong analytical skills, proficiency with data visualization tools, and the ability to craft compelling narratives.
How can I assess a candidate’s data storytelling skills during an interview?
You can assess a candidate’s data storytelling skills by asking them to explain complex data insights, present visualizations, and narrate findings in a clear and engaging manner.
Are situational questions important in a data storytelling interview?
Yes, situational questions help understand how a candidate applies their data storytelling skills in real-world scenarios.
What tools are commonly used in data storytelling?
Common tools include Tableau, Power BI, D3.js, and various statistical software like R and Python.
40 min skill tests.
No trick questions.
Accurate shortlisting.
We make it easy for you to find the best candidates in your pipeline with a 40 min skills test.
Try for freeRelated posts
Free resources

Join 1200+ companies in 80+ countries.
Try the most candidate friendly skills assessment tool today.

40 min tests.
No trick questions.
Accurate shortlisting.
No trick questions.
Accurate shortlisting.