
Basic Data Science interview questions
1. Can you explain what a p-value is in simple terms, and why it's important in data science?
2. What are some common data types you might encounter, and how do you handle them differently?
3. If you have a messy dataset, what are the first few things you'd do to clean it up?
4. Imagine you're trying to predict whether someone will like a movie. What kind of data would be helpful, and how would you use it?
5. Explain the difference between supervised and unsupervised learning. Can you give an example of when you'd use each?
6. What is the meaning of 'overfitting' in a model, and how would you try to fix it?
7. How do you measure the performance of a classification model? What metrics are important and why?
8. What's the difference between correlation and causation, and why is it important to know the difference?
9. Describe a situation where you had to explain a complex data analysis to someone who wasn't technical. How did you do it?
10. What are some common data visualization techniques, and when would you use each one?
11. Explain what a 'random forest' is, like I'm five.
12. How would you handle missing data in a dataset? What are some different strategies?
13. What is A/B testing and when is it appropriate to use?
14. What is the bias-variance tradeoff? Explain like I'm five.
15. What are some common machine learning algorithms, and what are their strengths and weaknesses?
16. How would you go about choosing the right machine learning algorithm for a particular problem?
17. What is the importance of feature engineering in machine learning?
18. What are outliers, and how do you detect and handle them?
19. How do you ensure your data analysis is reproducible?
20. Explain the concept of dimensionality reduction. Why is it useful?
21. What is a confusion matrix, and what does it tell you?
22. How would you explain the concept of 'Big Data' to a non-technical person?
23. Describe a time you had to make a decision based on data that turned out to be wrong. What did you learn?
24. What are some ethical considerations in data science?
25. What is the purpose of cross-validation?
26. How do you handle imbalanced datasets in classification problems?
27. If your model isn't performing well, what are some things you could try to improve it?
28. What are some common data science tools and libraries you're familiar with?
29. What are some of the biggest challenges you see in the field of data science today?
Intermediate Data Science interview questions
1. Explain the bias-variance tradeoff. Can you illustrate with an example when a model has high bias and high variance respectively?
2. How do you handle imbalanced datasets? What are some techniques, and when would you choose one over another?
3. Describe different feature selection methods. How do you decide which features are the most important in a model?
4. What is regularization, and why is it important? Explain L1 and L2 regularization.
5. How do you evaluate a classification model? What are precision, recall, F1-score, and when is each most useful?
6. Explain different types of cross-validation. Why is cross-validation important, and how does it prevent overfitting?
7. What are the assumptions of linear regression? How can you check if these assumptions are met, and what can you do if they are violated?
8. Describe the steps you would take to build a recommendation system. What are different approaches (e.g., collaborative filtering, content-based filtering)?
9. What is the difference between bagging and boosting? Explain how these ensemble methods work.
10. How do you handle missing data? What are different imputation techniques, and when would you use each?
11. Explain the concept of gradient descent. How does it work, and what are some challenges associated with it (e.g., local minima, learning rate selection)?
12. What are some common data visualization techniques? Give examples of when you would use different types of plots (e.g., scatter plot, histogram, box plot).
13. Explain the differences between type I and type II errors. How do they relate to hypothesis testing?
14. Describe the curse of dimensionality. How does it affect machine learning models, and what are some ways to mitigate it?
15. What are some different types of machine learning algorithms (e.g., supervised, unsupervised, reinforcement learning)? Give examples of problems each type is suited for.
16. Explain the concept of principal component analysis (PCA). How does it work, and what are some applications of PCA?
17. How would you design an A/B test to evaluate a new feature on a website? What metrics would you track, and how would you determine statistical significance?
18. Describe how you would detect outliers in a dataset. What are different methods for outlier detection, and when would you use each?
19. What are activation functions? Why are they important in neural networks?
20. Explain the concept of backpropagation in neural networks. How does it work, and why is it important?
21. How do you choose the right machine learning algorithm for a specific problem? What factors do you consider?
22. Explain the concept of a confusion matrix. What information does it provide, and how is it used to evaluate classification models?
23. What are some common evaluation metrics for regression models? Explain Mean Squared Error (MSE) and R-squared.
24. How would you approach a data science project from start to finish? Describe the different stages involved.
Advanced Data Science interview questions
1. How would you approach building a recommendation system for a website with very little user data?
2. Explain the concept of transfer learning and how it can be beneficial in data science projects.
3. Describe a situation where you would prefer a non-parametric model over a parametric one. Why?
4. How would you handle imbalanced classes in a classification problem? What metrics would you focus on?
5. Explain the bias-variance tradeoff in the context of machine learning models.
6. How would you design an A/B test to measure the impact of a new feature on a website?
7. Describe the difference between bagging and boosting. How do they reduce variance and bias respectively?
8. Explain the concept of regularization and its importance in preventing overfitting.
9. How would you approach a data science project where the data is highly unstructured (e.g., text, images, audio)?
10. Describe a time when you had to deal with missing data. What methods did you use to handle it, and why?
11. Explain the concept of ensemble learning and how it can improve model performance.
12. How would you evaluate the performance of a regression model? What metrics would you use, and why?
13. Describe the difference between supervised, unsupervised, and reinforcement learning.
14. How do you make sure the model you built is still performing well after a period of time? How do you handle concept drift?
15. Explain what are the assumptions of linear regression and how to test those assumptions?
16. How would you explain p-value to a non-technical stakeholder?
17. You have built a classification model. However, it is deployed in production and is misclassifying a certain group of customers at a higher rate than others. How would you approach addressing this fairness issue?
18. How do you select the right features for your model and why is it important?
19. What are the common sources of bias in data and how can they impact your analysis?
20. How do you approach a new data science problem with limited domain knowledge?
21. Can you describe a project where you had to communicate complex data insights to a non-technical audience? What strategies did you use to make the information understandable and impactful?
22. How would you handle a situation where you have a model that performs well in training but poorly in production?
23. Explain different methods of dimensionality reduction and when each should be applied.
Expert Data Science interview questions
1. How would you design a real-time fraud detection system for credit card transactions, considering both speed and accuracy?
2. Explain how you would approach building a recommendation system for a new e-commerce platform with limited user data.
3. Describe a situation where you had to deal with a biased dataset and how you mitigated the bias in your analysis.
4. How would you explain the concept of adversarial networks to someone with no prior knowledge of machine learning?
5. Design an experiment to determine the optimal pricing strategy for a new product, considering various market conditions.
6. Discuss a time when you had to convince stakeholders to adopt a new data science approach, overcoming their initial skepticism.
7. How would you handle a situation where your machine learning model is performing well in the lab but poorly in production?
8. Explain how you would use reinforcement learning to optimize the routing of delivery trucks in a large city.
9. Describe a project where you had to integrate data from multiple disparate sources and the challenges you faced.
10. How would you approach building a model to predict customer churn for a subscription-based service?
11. Explain the difference between type I and type II errors in hypothesis testing and their implications in a real-world scenario.
12. Design a system to automatically detect and classify different types of defects in a manufacturing process using computer vision.
13. How would you handle missing data in a time series dataset and the potential impact on your analysis?
14. Explain how you would use natural language processing to analyze customer feedback and identify areas for improvement.
15. Describe a situation where you had to deal with a very large dataset and the techniques you used to efficiently process it.
16. How would you approach building a model to predict the spread of a disease, considering various factors such as population density and travel patterns?
17. Explain the concept of transfer learning and how it can be used to improve the performance of machine learning models.
18. Design an experiment to evaluate the effectiveness of a new marketing campaign, considering various metrics and potential confounding factors.
19. How would you handle a situation where your machine learning model is being used to make decisions that have ethical implications?
20. Explain how you would use deep learning to analyze images and identify objects of interest.
21. Describe a project where you had to work with a team of people with different skill sets and how you coordinated your efforts.
22. How would you approach building a model to predict stock prices, considering the inherent volatility of the market?

Hiring data scientists can be a complex endeavor, given the diverse skill set the role demands. Recruiters and hiring managers need a structured approach to assess candidates effectively.
This blog post provides a curated list of data science interview questions, categorized by experience level, from basic to . It also includes a set of multiple-choice questions (MCQs) to quickly gauge a candidate's knowledge.
By leveraging these questions, you'll be able to your interview process, ensuring you hire the most qualified data scientists; Further, you can also use skills based hiring assessments like our Data Science Test to screen candidates beforehand.
Table of contents
Basic Data Science interview questions
Intermediate Data Science interview questions
Advanced Data Science interview questions
Expert Data Science interview questions
Data Science MCQ
Which Data Science skills should you evaluate during the interview phase?
Streamline Data Science Hiring with Skills Tests and Targeted Interviews
Download Data Science interview questions template in multiple formats
Basic Data Science interview questions
1. Can you explain what a p-value is in simple terms, and why it's important in data science?
A p-value is the probability of observing results as extreme as, or more extreme than, the results you actually got, assuming that the null hypothesis is true. In simpler terms, it tells you how likely your data is if there's really no effect happening. A small p-value (typically ≤ 0.05) suggests strong evidence against the null hypothesis, so you might reject it. A large p-value suggests weak evidence against the null hypothesis, and you'd fail to reject it.
P-values are important in data science because they help determine if the results of an analysis are statistically significant. They provide a way to quantify the strength of the evidence against a null hypothesis, allowing data scientists to make informed decisions about whether to accept or reject a hypothesis. This impacts decisions on building models, testing new features, or understanding differences between populations.
2. What are some common data types you might encounter, and how do you handle them differently?
Common data types include integers (int), floating-point numbers (float), strings (str), booleans (bool), lists, dictionaries (or hash maps), and sometimes more specialized types like dates or timestamps. Each type requires different handling. For example, you can perform arithmetic operations on integers and floats, but not directly on strings. Strings support operations like concatenation and slicing.
Booleans are used for logical operations (and, or, not), while lists and dictionaries are used to store collections of data. Lists are ordered and accessed by index, while dictionaries are accessed by keys. When processing data, you need to be mindful of the data type to ensure the correct operations are performed. Type conversion may be necessary using functions like int(), float(), str(), or specific parsing libraries for dates and timestamps. Additionally, error handling (e.g., using try-except blocks) is important to manage potential type-related exceptions.
3. If you have a messy dataset, what are the first few things you'd do to clean it up?
First, I'd examine the dataset's structure and content. This involves checking the data types of each column, identifying missing values, and looking for obvious inconsistencies or outliers. I'd use tools like head(), describe(), and info() in pandas to get a quick overview.
Next, I'd address the most pressing issues. This might involve handling missing values (imputation or removal), correcting data type errors (e.g., converting strings to numbers), standardizing text formats, and removing duplicate entries. If necessary, I'd also correct or remove obvious outliers based on domain knowledge or statistical methods, keeping in mind the potential impact on analysis. Consistent data quality is the primary goal.
4. Imagine you're trying to predict whether someone will like a movie. What kind of data would be helpful, and how would you use it?
To predict movie liking, I'd gather data on: 1) Movie features: Genre, actors, director, runtime, budget, MPAA rating. 2) User features: Age, gender, location, past movie ratings, preferred genres, favorite actors/directors, and demographics. 3) Social features: Friends' ratings and reviews, overall sentiment on social media.
I'd use this data to build a predictive model. For instance, a collaborative filtering approach could identify users with similar tastes based on their past ratings and recommend movies liked by those similar users. Alternatively, a content-based approach would analyze the movie's features (genre, actors) and match them to the user's preferred genres and actors (extracted from their rating history or profile). Machine learning models like regression or classification algorithms could be trained using the collected features to predict a rating or a binary 'like/dislike' outcome. Finally, incorporating sentiment analysis from social media could improve the prediction accuracy, taking into account the general buzz surrounding the movie.
5. Explain the difference between supervised and unsupervised learning. Can you give an example of when you'd use each?
Supervised learning uses labeled data to train a model to predict outcomes for new, unseen data. The algorithm learns a mapping function from input to output based on the provided labels. Examples include image classification (where images are labeled with their corresponding classes) and spam detection (where emails are labeled as spam or not spam). You'd use supervised learning when you have a dataset with known outputs and want to predict the outputs for new inputs.
Unsupervised learning, on the other hand, uses unlabeled data to discover hidden patterns and structures within the data. The algorithm learns without any guidance or supervision. Examples include clustering customers based on their purchasing behavior (segmenting customers into different groups without knowing the groups beforehand) and anomaly detection (identifying unusual data points in a dataset). Unsupervised learning is useful when you don't have labeled data and want to explore the inherent structure of the data.
6. What is the meaning of 'overfitting' in a model, and how would you try to fix it?
Overfitting occurs when a model learns the training data too well, including its noise and outliers. This leads to excellent performance on the training set but poor generalization to new, unseen data. Essentially, the model memorizes the training data instead of learning the underlying patterns.
To fix overfitting, you can try several approaches:
- Increase the training data: More data helps the model learn better and generalize well.
- Simplify the model: Reduce the number of parameters (e.g., using a simpler architecture in neural networks or fewer features in linear models).
- Regularization: Add penalties to the model's parameters to prevent them from becoming too large (e.g., L1 or L2 regularization).
- Cross-validation: Use techniques like k-fold cross-validation to evaluate the model's performance on unseen data and tune hyperparameters accordingly.
- Early stopping: Monitor the model's performance on a validation set during training and stop training when the performance starts to degrade.
- Feature selection/engineering: Choose the most relevant features and create new features that capture the underlying patterns in the data while avoiding irrelevant information.
7. How do you measure the performance of a classification model? What metrics are important and why?
To measure the performance of a classification model, several metrics are crucial. Accuracy is a common metric, representing the ratio of correctly classified instances to the total instances. However, accuracy can be misleading when dealing with imbalanced datasets. In such cases, Precision, Recall, and F1-score are more informative. Precision measures the proportion of correctly predicted positive instances out of all instances predicted as positive. Recall (also known as sensitivity or true positive rate) measures the proportion of correctly predicted positive instances out of all actual positive instances. The F1-score is the harmonic mean of precision and recall, providing a balanced measure. Other important metrics include the Area Under the Receiver Operating Characteristic Curve (AUC-ROC), which evaluates the model's ability to distinguish between classes across different threshold settings.
Selecting the most relevant metrics depends on the specific problem and the relative importance of different types of errors. For example, in medical diagnosis, high recall is often prioritized to minimize the risk of missing positive cases (even if it means accepting more false positives).
8. What's the difference between correlation and causation, and why is it important to know the difference?
Correlation indicates a statistical relationship between two variables, meaning they tend to move together. Causation, on the other hand, means that one variable directly influences the other; a change in one variable causes a change in the other. Just because two things are correlated doesn't automatically mean one causes the other.
It's important to distinguish between them to avoid making incorrect conclusions and decisions. For example, if we see a correlation between ice cream sales and crime rates, we shouldn't conclude that ice cream causes crime. A lurking variable, such as warmer weather, likely influences both. Mistaking correlation for causation can lead to ineffective or even harmful interventions, especially in areas like public policy, medicine, and business.
9. Describe a situation where you had to explain a complex data analysis to someone who wasn't technical. How did you do it?
I once had to present findings from a churn analysis to the marketing team, who primarily focused on creative campaigns. The analysis involved survival curves and regression models, which they wouldn't understand. I started by framing the problem in their terms: "We want to understand why customers leave, so we can improve retention and marketing spend efficiency." Instead of technical jargon, I used analogies. For example, I explained the survival curve as a representation of "how long customers typically stay with us, visualized as a line going down over time, showing the percentage of customers remaining." I then focused on the actionable insights: "Customers who don't engage with our emails are X% more likely to churn within Y months." I visually highlighted these key findings with simple charts showing the churn rate for different customer segments, emphasizing the business impact of each insight, which resonated well with them.
I avoided diving into the specifics of the statistical methods, and concentrated on the 'so what?' Instead of showing regression coefficients, I showed a few key customer characteristics that correlated with a higher churn rate, using language like, "Customers who only use feature A, churn at twice the rate of customers who also use feature B and C". This allowed the team to translate the data into actionable marketing strategies, such as targeted email campaigns to encourage users to adopt feature B and C to reduce churn.
10. What are some common data visualization techniques, and when would you use each one?
Some common data visualization techniques include:
- Bar charts: Used for comparing categorical data. For example, comparing sales figures for different products.
- Line charts: Effective for showing trends over time. For example, visualizing stock prices over a year.
- Scatter plots: Useful for examining the relationship between two numerical variables. For example, plotting height vs. weight to see if there's a correlation.
- Histograms: Displaying the distribution of a single numerical variable. For example, visualizing the distribution of exam scores.
- Pie charts: Showing proportions of a whole, but generally avoid when possible as they can be difficult to interpret accurately.
- Box plots: Summarizing the distribution of a numerical variable, showing median, quartiles, and outliers. Good for comparing distributions across different groups.
- Heatmaps: Visualizing the magnitude of a phenomenon as color. Excellent for showing correlation between many variables or showing density of points on a map.
Choosing the right technique depends on the type of data you have and the message you want to convey. Consider your audience and what insights are most important when making your choice. For time series data, line charts are best. For categorical comparisons, bar charts excel. To understand relationships between variables, scatter plots are effective. Box plots give you a good overall statistical view, while histograms show specific number distribution.
11. Explain what a 'random forest' is, like I'm five.
Imagine you want to decide what to eat for dinner. You ask lots of your friends, and each friend gives you a different suggestion. A random forest is like asking many friends (each a 'decision tree') what to eat. Each friend looks at different things like if you had pizza recently, or if you ate veggies today, to make their suggestion. Then, you pick the suggestion that most of your friends agree on!
So, each "friend" (tree) looks at the problem a little differently and makes a choice. The "forest" (all the friends together) then votes on the best choice for you. This helps because if one "friend" is wrong, the others can correct them. That's how a random forest helps make good decisions!
12. How would you handle missing data in a dataset? What are some different strategies?
Handling missing data is crucial for accurate analysis. Several strategies exist, each with its pros and cons. One simple approach is deletion, where rows or columns with missing values are removed. This is suitable if the missing data is minimal and random but can lead to significant data loss otherwise.
Another strategy is imputation, where missing values are replaced with estimated values. Common imputation methods include:
- Mean/Median/Mode imputation: Replacing missing values with the mean, median, or mode of the non-missing values in the column. Simple, but can distort the distribution.
- Constant Value imputation: Replacing missing values with a constant (e.g. 'Unknown', -999). Depends highly on the context.
- Regression imputation: Using a regression model to predict the missing values based on other features. More sophisticated, but can be computationally expensive and assumes a relationship between variables.
- K-Nearest Neighbors (KNN) imputation: Using the values from the K most similar data points to impute the missing value.
The choice of strategy depends on the amount of missing data, the nature of the missingness (e.g., missing completely at random, missing at random, missing not at random), and the goals of the analysis.
13. What is A/B testing and when is it appropriate to use?
A/B testing (also known as split testing) is a method of comparing two versions of something (e.g., a webpage, an app feature, a marketing email) to see which one performs better. You randomly split your audience into two groups: Group A sees the control version, and Group B sees the variation. You then measure which version achieves your desired goal (e.g., higher click-through rate, more conversions).
A/B testing is appropriate when you want to optimize specific elements or features, validate design changes, or make data-driven decisions about which version of something to use. It's particularly useful for incremental improvements, not for radical redesigns or testing entirely new concepts where user feedback and qualitative data might be more important.
14. What is the bias-variance tradeoff? Explain like I'm five.
Imagine you're trying to throw a ball into a bucket. Bias is like always missing the bucket in the same direction - maybe you always throw too far to the left. Variance is like your throws being all over the place - sometimes too far, sometimes too short, sometimes left, sometimes right.
The bias-variance tradeoff is that if you make a model that's really simple, it's likely to be biased (always wrong in a similar way). If you make a model that's really complex, it might fit your training data really well (low bias), but it will be very sensitive to tiny changes in the data, meaning it will have high variance and perform badly on new, unseen data. Finding the sweet spot, where your model is complex enough to capture the important patterns but not so complex that it's just memorizing noise, is the goal.
15. What are some common machine learning algorithms, and what are their strengths and weaknesses?
Some common machine learning algorithms include:
- Linear Regression: Simple to implement and interpret, but assumes a linear relationship between variables. Can be sensitive to outliers.
- Logistic Regression: Used for binary classification. Easy to implement and interpret, but can struggle with complex relationships.
- Decision Trees: Easy to visualize and understand, handles both categorical and numerical data. Prone to overfitting.
- Support Vector Machines (SVM): Effective in high dimensional spaces, but can be computationally expensive and difficult to interpret.
- K-Nearest Neighbors (KNN): Simple to understand and implement, but can be slow for large datasets and sensitive to feature scaling.
- Random Forest: Robust to overfitting, handles high dimensionality, provides feature importance. Can be harder to interpret than single decision trees.
- Naive Bayes: Simple and fast, works well with high-dimensional data. Assumes feature independence which is often not true in reality.
- K-Means Clustering: Simple and efficient for clustering, but requires specifying the number of clusters (k) in advance and sensitive to initial centroid placement.
- Neural Networks: Can learn complex patterns, high accuracy potential. Requires large amounts of data and significant computational resources. Prone to overfitting if not regularized correctly.
The choice of algorithm depends heavily on the specific problem, data characteristics, and desired outcome. Consider factors like interpretability, accuracy, training time, and data size when selecting the right algorithm.
16. How would you go about choosing the right machine learning algorithm for a particular problem?
Choosing the right machine learning algorithm depends on several factors. First, understand the type of problem: is it classification, regression, clustering, or something else? Then, consider the nature of the data: is it labeled or unlabeled? How many features are there? What are the data types (numerical, categorical)? These questions help narrow down the choices. For example, if you have labeled data and a classification problem, you might consider algorithms like logistic regression, support vector machines (SVMs), or decision trees. If you need to use python and are unsure how to implement the algorithms you can try:
from sklearn.linear_model import LogisticRegression
from sklearn.svm import SVC
from sklearn.tree import DecisionTreeClassifier
Next, think about the trade-offs between model complexity, interpretability, and performance. Simpler models like linear regression are easier to understand but might not capture complex relationships. More complex models like neural networks can be very powerful, but they require more data and computational resources. Finally, it's often a good idea to try multiple algorithms and compare their performance using appropriate evaluation metrics on a validation dataset.
17. What is the importance of feature engineering in machine learning?
Feature engineering is crucial because machine learning algorithms learn from the data you provide. If the features are poorly chosen or uninformative, even the best algorithms will struggle to produce accurate predictions. Good features directly represent the underlying structure of the data and make the patterns more accessible to the model, leading to improved performance, better accuracy, and faster training times.
Effective feature engineering involves selecting, transforming, and creating new features that are relevant to the prediction task. It often requires domain expertise to understand which aspects of the data are most important. For example, instead of providing a raw date, you might engineer features like 'day of the week' or 'month of the year,' which could be more informative for certain models.
18. What are outliers, and how do you detect and handle them?
Outliers are data points that significantly deviate from the overall pattern or distribution of a dataset. They can arise due to measurement errors, data entry mistakes, or genuinely anomalous events. Detecting outliers can be done using various methods, including:
- Visual Inspection: Box plots and scatter plots can help identify points that lie far from the main cluster.
- Statistical Methods: Z-score, IQR (Interquartile Range), and Grubbs' test are commonly used. For example, a Z-score greater than 3 or less than -3 often indicates an outlier.
- Machine Learning Techniques: Clustering algorithms (like DBSCAN) and anomaly detection models can identify outliers.
Handling outliers depends on the context. Common approaches include:
- Removal: If outliers are due to errors, removing them might be appropriate, but be careful not to remove genuine extreme values.
- Transformation: Applying transformations like logarithmic or winsorizing can reduce the impact of outliers.
- Imputation: Replacing outliers with more reasonable values (e.g., mean, median) can be a strategy.
- Separate Analysis: Sometimes, outliers are the most interesting data points and should be analyzed separately.
19. How do you ensure your data analysis is reproducible?
To ensure reproducibility in data analysis, I prioritize meticulous documentation and version control. This includes documenting all steps of the process, from data acquisition and cleaning to analysis and visualization. I use tools like Git to track changes to my code, data, and documentation, allowing me to revert to previous versions if needed.
Furthermore, I strive to write modular and well-commented code, use a consistent coding style, and manage dependencies using package managers (e.g., pip for Python, npm for JavaScript). I also use tools like Jupyter Notebooks to create a record of my analysis. Containerization with Docker can also package all code and dependencies into a single container, enhancing portability and reproducibility across different environments.
20. Explain the concept of dimensionality reduction. Why is it useful?
Dimensionality reduction refers to techniques that reduce the number of features (variables, columns) in a dataset while preserving its essential characteristics. This is achieved by transforming the data into a lower-dimensional space, either by selecting a subset of the original features (feature selection) or by creating new, uncorrelated features from the existing ones (feature extraction).
It is useful for several reasons. Firstly, it can simplify models and reduce computational cost by decreasing the amount of data processed. Secondly, it can improve model performance by removing irrelevant or redundant features that might lead to overfitting. Thirdly, it can help with visualization by making it easier to plot and understand high-dimensional data in 2D or 3D. For example, PCA (Principal Component Analysis) is a common dimensionality reduction technique.
21. What is a confusion matrix, and what does it tell you?
A confusion matrix is a table that summarizes the performance of a classification model. It shows the counts of true positive (TP), true negative (TN), false positive (FP), and false negative (FN) predictions.
It tells you where the model is making mistakes, such as which classes are being confused with each other. From the confusion matrix, you can derive metrics like precision, recall, accuracy, and F1-score to evaluate the model's performance.
22. How would you explain the concept of 'Big Data' to a non-technical person?
Imagine you have a massive library, much bigger than any library you've ever seen. It's not just books, but also every newspaper article, every website, every social media post, and every transaction record ever made. That's essentially what 'Big Data' is – extremely large and complex sets of information.
Because of its size, analyzing this data is hard with regular tools, but using special techniques (often involving computers), we can find patterns, trends, and insights that would be impossible to see otherwise. These insights can help businesses make better decisions, scientists discover new things, and governments improve services.
23. Describe a time you had to make a decision based on data that turned out to be wrong. What did you learn?
Early in my career, I was working on a marketing campaign where we A/B tested two different ad creatives. The initial data, based on the first day of the campaign, showed a clear winner. We quickly scaled up the winning creative, only to find that over the next few days, its performance plummeted, and the original 'losing' creative actually performed much better in the long run.
I learned a valuable lesson about the importance of statistical significance and the dangers of making decisions based on small sample sizes or short timeframes. Now, I always ensure I have enough data and analyze trends over a sufficient period before making any major decisions. I also incorporate monitoring and re-evaluation mechanisms to catch potential data inaccuracies or changes in trends.
24. What are some ethical considerations in data science?
Ethical considerations in data science are crucial. Key areas include privacy, ensuring data is anonymized and used responsibly to prevent identification of individuals. Bias in algorithms and datasets can lead to unfair or discriminatory outcomes, especially affecting marginalized groups. Transparency is important; models should be explainable so their decisions can be understood and challenged.
Other considerations involve data security, intellectual property, and informed consent. It's vital to adhere to legal frameworks such as GDPR and CCPA, and to communicate the potential impact of data-driven solutions effectively and honestly.
25. What is the purpose of cross-validation?
The primary purpose of cross-validation is to evaluate the performance of a machine learning model on unseen data. It helps to assess how well the model generalizes to new, independent datasets, preventing overfitting. Instead of relying on a single train/test split, cross-validation partitions the data into multiple subsets, training the model on some subsets and testing on the remaining one. This process is repeated several times, using different subsets for training and testing each time, giving a more robust estimate of the model's performance.
Specifically, cross-validation helps to:
- Estimate the model's accuracy and reliability.
- Detect overfitting: If the model performs well on the training data but poorly on the validation data, it may be overfitting.
- Compare different models or hyperparameter settings: By evaluating the performance of different models or hyperparameter settings using cross-validation, you can select the best performing one.
- Maximize the use of available data: By using all data for both training and testing, cross-validation makes the most of the available data, particularly useful when dealing with small datasets.
26. How do you handle imbalanced datasets in classification problems?
To handle imbalanced datasets, I typically use a combination of techniques. First, I address the data itself by employing methods like: resampling techniques such as oversampling the minority class (e.g., using SMOTE) or undersampling the majority class. Another approach is to generate synthetic samples. Second, I focus on adjusting the algorithm. Some algorithms work better with imbalanced data, while for the others, techniques such as cost-sensitive learning (assigning higher penalties to misclassification of the minority class) or threshold moving (adjusting the classification threshold to optimize for recall or precision) are applicable.
Evaluation metrics are also very important. Instead of relying solely on accuracy, I use metrics like precision, recall, F1-score, and AUC-ROC to get a more complete picture of the model's performance. Cross-validation is used diligently, ensuring folds represent class distributions of the whole dataset. Finally, I ensure that the model generalizes well on unseen data.
27. If your model isn't performing well, what are some things you could try to improve it?
If my model isn't performing well, I'd first focus on debugging the code and verifying data integrity. It's crucial to ensure the data being fed into the model is clean and correctly preprocessed, as errors in the data can significantly affect model performance. I would also check for any bugs in the model implementation itself. Once the data pipeline and model code are verified, I would explore different optimization strategies, such as:
- Hyperparameter tuning: Experiment with different learning rates, batch sizes, and regularization parameters. Tools like grid search or random search can be helpful.
- Feature engineering: Create new features or transform existing ones to better represent the underlying patterns in the data.
- Model selection: Try different model architectures or algorithms that might be better suited for the specific task and data.
- Regularization: Implement techniques like L1 or L2 regularization to prevent overfitting, especially if the model is complex.
- Ensemble methods: Combine multiple models to improve generalization and robustness. Example, using
scikit-learn:
from sklearn.ensemble import RandomForestClassifier
model = RandomForestClassifier(n_estimators=100)
- Data augmentation: Increase the size of the training dataset by creating slightly modified versions of existing data. This is particularly useful when dealing with limited data.
28. What are some common data science tools and libraries you're familiar with?
I'm familiar with a wide range of data science tools and libraries. For programming, I primarily use Python with libraries like:
- NumPy and Pandas for data manipulation and analysis.
- Scikit-learn for machine learning algorithms (classification, regression, clustering, dimensionality reduction).
- Matplotlib and Seaborn for data visualization.
- TensorFlow and PyTorch for deep learning.
statsmodelsfor statistical modeling.
Beyond Python, I have some experience with R (mainly for statistical analysis) and SQL for database querying. I am also familiar with cloud platforms like AWS, Azure, and GCP for deploying and scaling data science projects. Tools like Jupyter notebooks and VS Code are essential for development and collaboration.
29. What are some of the biggest challenges you see in the field of data science today?
Some of the biggest challenges in data science include the increasing complexity of data, the need for specialized skills, and ethical considerations. Data is becoming more voluminous, varied, and generated at a higher velocity (the three Vs), requiring advanced techniques for processing and analysis. This also means that data scientists need expertise in areas like cloud computing, distributed systems, and specialized machine learning algorithms to effectively handle these data challenges. Furthermore, issues such as bias in data, privacy concerns, and the responsible use of AI are becoming increasingly important, demanding careful attention and ethical frameworks. Ensuring data quality and reproducibility is also a persistent hurdle.
Another significant challenge is the "last mile" problem: translating model insights into tangible business value. Many models are built but never deployed effectively, due to a lack of collaboration between data scientists and business stakeholders or challenges in integrating models into existing systems. Overcoming this requires stronger communication skills, a focus on business outcomes, and robust model deployment strategies.
Intermediate Data Science interview questions
1. Explain the bias-variance tradeoff. Can you illustrate with an example when a model has high bias and high variance respectively?
The bias-variance tradeoff is a fundamental concept in machine learning. Bias refers to the error introduced by approximating a real-world problem, which is often complex, by a simplified model. High bias models make strong assumptions about the data. Variance, on the other hand, refers to the sensitivity of the model to changes in the training data. High variance models are very sensitive to the training data and can fit the noise in the data.
For example, a linear regression model trying to fit a highly non-linear dataset would have high bias. It's too simple to capture the complexity. Conversely, a very deep decision tree trained on a small dataset might have high variance. It would memorize the training data, including its noise, and perform poorly on unseen data. A simple model that always predicts the average value is an example of high bias whereas a complicated model that overfits the data is an example of high variance.
2. How do you handle imbalanced datasets? What are some techniques, and when would you choose one over another?
To handle imbalanced datasets, several techniques can be employed. Resampling methods like oversampling (increasing the minority class) and undersampling (decreasing the majority class) are common. Oversampling, such as using techniques like SMOTE (Synthetic Minority Oversampling Technique), generates synthetic samples for the minority class. Undersampling involves randomly removing samples from the majority class.
Cost-sensitive learning assigns different misclassification costs to different classes, penalizing misclassifying the minority class more heavily. Algorithms like sklearn.linear_model.LogisticRegression in scikit-learn allow specifying class weights (class_weight='balanced') to adjust for class imbalance. Ensemble methods like Balanced Random Forest or EasyEnsemble are designed to handle imbalanced data by creating multiple subsets or models and combining their predictions. The choice of technique depends on the dataset size and the severity of the imbalance. If computational cost is a major factor and the dataset is huge, undersampling may be preferable. SMOTE is a decent general approach as it adds samples and reduces the risk of data loss. If the misclassification costs are well known, cost-sensitive learning could be used. For relatively complex classification tasks, ensemble methods could also be applied.
3. Describe different feature selection methods. How do you decide which features are the most important in a model?
Feature selection methods aim to identify the most relevant features for a predictive model. Common techniques include:
- Filter methods: These methods use statistical measures like correlation or chi-squared to rank features independently of any specific model. Examples include: Information Gain, Chi-square Test, and correlation coefficient scores.
- Wrapper methods: These methods evaluate subsets of features by training and testing a model on each subset. Examples are forward selection, backward elimination, and recursive feature elimination.
- Embedded methods: These methods perform feature selection as part of the model training process. Examples include LASSO (L1 regularization), Ridge Regression (L2 regularization), and decision tree-based methods.
To determine feature importance, techniques include analyzing model coefficients (e.g., in linear models), feature importance scores from tree-based models, or permutation importance where feature values are randomly shuffled to observe the impact on model performance. Cross-validation helps ensure the selected features generalize well to unseen data. The best features are those that consistently improve model performance across different evaluation metrics on the validation set.
4. What is regularization, and why is it important? Explain L1 and L2 regularization.
Regularization is a technique used to prevent overfitting in machine learning models. Overfitting occurs when a model learns the training data too well, including its noise and outliers, leading to poor performance on unseen data. Regularization adds a penalty term to the model's loss function, discouraging it from learning overly complex patterns. This penalty term effectively constrains the model's parameters.
L1 and L2 regularization are two common types:
- L1 Regularization (Lasso): Adds the sum of the absolute values of the coefficients as a penalty. It can lead to feature selection by driving some coefficients to zero. This is useful for creating sparse models. Mathematically, it adds
λ * ||w||_1to the loss function, whereλis the regularization parameter andwis the vector of weights. - L2 Regularization (Ridge): Adds the sum of the squares of the coefficients as a penalty. It shrinks the coefficients towards zero but rarely forces them to be exactly zero. It tends to distribute the penalty more evenly across all features. Mathematically, it adds
λ * ||w||_2^2to the loss function.
5. How do you evaluate a classification model? What are precision, recall, F1-score, and when is each most useful?
To evaluate a classification model, several metrics are used, including precision, recall, and F1-score. Precision measures the accuracy of positive predictions: Precision = True Positives / (True Positives + False Positives). Recall measures the ability to find all actual positive cases: Recall = True Positives / (True Positives + False Negatives). F1-score is the harmonic mean of precision and recall, providing a balanced measure: F1-score = 2 * (Precision * Recall) / (Precision + Recall). Accuracy is also used, but can be misleading with imbalanced classes.
Precision is most useful when minimizing false positives is critical, like in spam detection (avoiding legitimate emails being marked as spam). Recall is most useful when minimizing false negatives is crucial, such as in medical diagnosis (detecting all actual cases of a disease). F1-score is helpful when you need to balance precision and recall, especially when the costs of false positives and false negatives are similar. In scenarios with imbalanced datasets, metrics like precision, recall, and F1-score provide a more nuanced understanding of model performance compared to accuracy alone.
6. Explain different types of cross-validation. Why is cross-validation important, and how does it prevent overfitting?
Cross-validation is a technique used to evaluate the performance of a machine learning model on unseen data. Different types include:
- k-fold cross-validation: The data is divided into k folds. The model is trained on k-1 folds and tested on the remaining fold. This is repeated k times, with each fold used once as the test set. The performance metrics are averaged over all k trials.
- Stratified k-fold cross-validation: Similar to k-fold, but ensures that each fold has the same proportion of classes as the original dataset. This is important for imbalanced datasets.
- Leave-one-out cross-validation (LOOCV): Each data point is used as the test set once, and the model is trained on the remaining data points. This is a special case of k-fold where k equals the number of data points.
Cross-validation is important because it provides a more reliable estimate of a model's performance on unseen data than a single train-test split. It helps prevent overfitting by training and evaluating the model on multiple different subsets of the data. By averaging the performance across these subsets, cross-validation gives a better indication of how well the model will generalize to new data. If a model performs well during cross-validation, it's less likely to be overfitting to the specific training set.
7. What are the assumptions of linear regression? How can you check if these assumptions are met, and what can you do if they are violated?
Linear regression makes several key assumptions: 1. Linearity: The relationship between the independent and dependent variables is linear. 2. Independence: The errors are independent of each other. 3. Homoscedasticity: The variance of the errors is constant across all levels of the independent variables. 4. Normality: The errors are normally distributed.
To check these assumptions: Linearity can be visually inspected with scatter plots of the data and residual plots. Independence can be assessed using the Durbin-Watson test (values near 2 indicate independence). Homoscedasticity can be checked by plotting residuals against predicted values; a funnel shape indicates heteroscedasticity. Normality can be checked with a histogram or Q-Q plot of the residuals. If assumptions are violated, transformations of the data (e.g., log transformation), weighted least squares regression (for heteroscedasticity), or using a different model altogether (e.g., non-linear regression) are possible solutions.
8. Describe the steps you would take to build a recommendation system. What are different approaches (e.g., collaborative filtering, content-based filtering)?
Building a recommendation system involves several steps. First, you need to collect data on user interactions (e.g., purchases, ratings, views) and item attributes (e.g., category, description). Second, preprocess the data by cleaning, transforming, and handling missing values. Then, choose a recommendation approach based on the data and business goals. Some common approaches include:
- Collaborative filtering: Recommends items based on the preferences of similar users. This can be memory-based (using user-item matrices) or model-based (using machine learning algorithms like matrix factorization).
- Content-based filtering: Recommends items similar to those a user has liked in the past, based on item attributes. This often involves techniques like TF-IDF to analyze textual descriptions.
- Hybrid approaches: Combine collaborative and content-based filtering to leverage the strengths of both.
Finally, evaluate the system using metrics like precision, recall, and NDCG, and iteratively improve it based on feedback. Tools like scikit-learn and TensorFlow can be helpful in building and evaluating these systems.
9. What is the difference between bagging and boosting? Explain how these ensemble methods work.
Bagging and boosting are both ensemble methods used to improve the accuracy of machine learning models, but they differ in how they create and combine individual models.
Bagging (Bootstrap Aggregating) involves creating multiple models from different subsets of the training data, sampled with replacement (bootstrapping). Each model is trained independently, and their predictions are combined, typically through averaging (for regression) or voting (for classification). The goal is to reduce variance and overfitting. Examples include Random Forests.
Boosting, on the other hand, builds models sequentially, where each new model focuses on correcting the errors made by previous models. Instances that were misclassified by earlier models are given more weight, forcing subsequent models to pay more attention to them. Boosting aims to reduce bias and improve overall accuracy. Examples include AdaBoost and Gradient Boosting Machines.
10. How do you handle missing data? What are different imputation techniques, and when would you use each?
Handling missing data is a crucial step in data preprocessing. Common approaches include deletion (removing rows or columns with missing values), which is suitable when the missing data is minimal and randomly distributed. However, it can lead to information loss. Another technique is imputation, where we fill in the missing values with estimated ones. Simple imputation methods involve replacing missing values with the mean, median, or mode of the column. These are easy to implement but can distort the data distribution.
More advanced imputation techniques include:
- K-Nearest Neighbors (KNN) imputation: Imputes based on the average of 'k' nearest neighbors. Best when the missing data depends on other features.
- Multiple Imputation: Creates multiple plausible datasets by imputing different values and combining the results. Useful when uncertainty about the missing values needs to be accounted for.
- Model-based imputation: Uses regression models to predict missing values based on other features. Suitable when there is a clear relationship between variables. The choice of imputation technique depends on the nature of the missing data, the amount of missingness, and the potential impact on the analysis.
11. Explain the concept of gradient descent. How does it work, and what are some challenges associated with it (e.g., local minima, learning rate selection)?
Gradient descent is an iterative optimization algorithm used to find the minimum of a function. In machine learning, this function is typically a cost or loss function that measures the difference between predicted and actual values. The algorithm works by repeatedly taking steps proportional to the negative of the gradient (or approximate gradient) of the function at the current point. The gradient indicates the direction of the steepest ascent, so moving in the opposite direction leads to the minimum. Think of it like rolling a ball down a hill; the ball will naturally settle at the lowest point.
Challenges associated with gradient descent include:
- Local Minima: The algorithm might get stuck in a local minimum, which is a point that is lower than its surroundings but not the global minimum.
- Learning Rate Selection: Choosing an appropriate learning rate (the size of the steps) is crucial. If the learning rate is too small, convergence will be slow. If it's too large, the algorithm might overshoot the minimum and diverge. Techniques like learning rate decay or adaptive learning rates (e.g., Adam, RMSprop) are often used to address this.
- Vanishing/Exploding Gradients: Especially in deep neural networks, gradients can become very small (vanishing) or very large (exploding) during backpropagation, hindering learning.
- Saddle Points: High-dimensional spaces often have saddle points, where the gradient is close to zero, but it's not a local minimum.
12. What are some common data visualization techniques? Give examples of when you would use different types of plots (e.g., scatter plot, histogram, box plot).
Common data visualization techniques include: Scatter plots (useful for showing relationships between two continuous variables, e.g., height vs. weight), Histograms (displaying the distribution of a single variable, e.g., the frequency of different exam scores), Box plots (summarizing the distribution of a dataset, showing quartiles and outliers, e.g., comparing the salaries of different departments), Bar charts (comparing categorical data, e.g., the number of products sold in different categories), Line charts (showing trends over time, e.g., stock prices), and Heatmaps (visualizing the correlation between multiple variables or the magnitude of a phenomenon as color, e.g., website traffic by time of day and day of week). Other techniques include pie charts (for proportions), geographic maps, and network graphs.
For example, use a scatter plot to explore the correlation between study hours and exam scores. A histogram would be appropriate to view the distribution of age in a population. A box plot helps compare the distribution of test scores between different classes. A bar chart effectively visualizes sales figures for various product categories. A line chart is ideal for showcasing the trend of website traffic over time.
13. Explain the differences between type I and type II errors. How do they relate to hypothesis testing?
Type I and Type II errors are two possible errors in hypothesis testing. A Type I error (false positive) occurs when you reject the null hypothesis when it is actually true. The probability of committing a Type I error is denoted by α (alpha), which is also the significance level of the test.
A Type II error (false negative) occurs when you fail to reject the null hypothesis when it is actually false. The probability of committing a Type II error is denoted by β (beta). The power of a test (1 - β) is the probability of correctly rejecting the null hypothesis when it is false. In hypothesis testing, you aim to minimize both Type I and Type II errors, but there's often a trade-off between them. Decreasing α increases β, and vice-versa, unless you increase the sample size.
14. Describe the curse of dimensionality. How does it affect machine learning models, and what are some ways to mitigate it?
The curse of dimensionality refers to various challenges that arise when dealing with data in high-dimensional spaces. As the number of features (dimensions) increases, the volume of the space grows exponentially. This leads to data becoming sparse, meaning that data points are further apart from each other. This sparsity negatively impacts machine learning models because the models need sufficient data points to accurately learn patterns and generalize well. With sparse data, models are more susceptible to overfitting, where they memorize the training data but perform poorly on unseen data.
Several techniques can mitigate the curse of dimensionality. Feature selection aims to identify and retain only the most relevant features, discarding irrelevant or redundant ones. Dimensionality reduction techniques, such as Principal Component Analysis (PCA) or t-distributed Stochastic Neighbor Embedding (t-SNE), transform the data into a lower-dimensional space while preserving important information. Regularization methods (e.g., L1 or L2 regularization) can penalize complex models with many features, preventing overfitting. Increasing the size of the training dataset can also help to overcome sparsity, although this isn't always feasible. Finally, using simpler models that require fewer parameters can also be beneficial.
15. What are some different types of machine learning algorithms (e.g., supervised, unsupervised, reinforcement learning)? Give examples of problems each type is suited for.
Machine learning algorithms can be broadly categorized into three main types: supervised learning, unsupervised learning, and reinforcement learning.
- Supervised learning involves training a model on a labeled dataset, where the input features and the corresponding output (target) are known. Examples include: classification (predicting a category, like spam detection) and regression (predicting a continuous value, like predicting house prices). Common algorithms include: linear regression, support vector machines (SVMs), decision trees, and neural networks.
- Unsupervised learning deals with unlabeled data, where the algorithm tries to find patterns and relationships without explicit guidance. Examples include: clustering (grouping similar data points, like customer segmentation) and dimensionality reduction (reducing the number of features, like principal component analysis). Algorithms include: k-means clustering, hierarchical clustering, and autoencoders.
- Reinforcement learning trains an agent to make decisions in an environment to maximize a reward. The agent learns through trial and error. Examples include: game playing (like AlphaGo) and robotics (like robot navigation). Algorithms include: Q-learning and deep Q-networks (DQN).
16. Explain the concept of principal component analysis (PCA). How does it work, and what are some applications of PCA?
Principal Component Analysis (PCA) is a dimensionality reduction technique used to transform a dataset with many variables into a new set of variables called principal components. These components are ordered by the amount of variance they explain in the original data. The first principal component captures the most variance, the second captures the second most, and so on. By keeping only the first few principal components, we can reduce the dimensionality of the data while retaining most of the important information. It works by performing an eigendecomposition or singular value decomposition (SVD) on the covariance matrix or the data matrix directly. The eigenvectors become the principal components, and the eigenvalues represent the variance explained by each component.
Some applications of PCA include: image compression (reducing the number of pixels needed to represent an image), feature extraction (creating a smaller set of features for machine learning models), noise reduction (filtering out unimportant variations in the data), and exploratory data analysis (visualizing high-dimensional data in a lower-dimensional space to identify patterns). For example, in image processing, PCA can reduce the number of features from a large image dataset to a smaller, more manageable set for classification tasks, thus improving performance and reducing computational costs.
17. How would you design an A/B test to evaluate a new feature on a website? What metrics would you track, and how would you determine statistical significance?
To design an A/B test, I would randomly split website traffic into two groups: a control group (A) that sees the existing website and a treatment group (B) that sees the website with the new feature. The split should be consistent for each user using cookies or similar mechanisms to ensure they always see the same version. The test should run for a sufficient duration (e.g., 1-2 weeks) to capture varying user behavior patterns, including weekends and weekdays. Key metrics to track include conversion rate (e.g., purchases, sign-ups), click-through rate (CTR) on relevant buttons or links, bounce rate, time spent on page, and revenue per user.
Statistical significance would be determined using hypothesis testing. I would set a null hypothesis (no difference between A and B) and an alternative hypothesis (there is a difference). Using a significance level (alpha) of 0.05, I'd use a t-test or chi-squared test (depending on the metric type) to calculate a p-value. If the p-value is less than alpha (0.05), the result is statistically significant, suggesting the new feature has a real impact. We would also monitor the power of the test to ensure we have sufficient statistical power to detect a meaningful effect, and use a sample size calculator to estimate the required traffic.
18. Describe how you would detect outliers in a dataset. What are different methods for outlier detection, and when would you use each?
Outlier detection aims to identify data points that deviate significantly from the norm. Several methods exist, each suitable for different data characteristics and objectives.
Common methods include:
- Statistical Methods: Like Z-score (measures how many standard deviations away a data point is from the mean - good for normal distributions) and IQR (Interquartile Range - robust to skewed data).
- Machine Learning Methods: Such as Isolation Forest (efficient for high-dimensional data), One-Class SVM (useful when you only have normal data), and Clustering based techniques(finds regions of high data density, outliers fall outside these clusters). For normally distributed data, I'd use Z-score. For skewed data, I'd favor IQR or Isolation Forest. For novelty detection (only normal data available), One-Class SVM is appropriate. Clustering can work well, but is subject to parameter tuning.
19. What are activation functions? Why are they important in neural networks?
Activation functions introduce non-linearity to the output of a neuron. Without them, a neural network would simply be a linear regression model, regardless of its depth. This is because multiple layers of linear transformations can be collapsed into a single linear transformation.
Activation functions allow neural networks to learn complex, non-linear patterns in data. Common examples include ReLU (Rectified Linear Unit), sigmoid, and tanh. They determine whether a neuron should be 'activated' or not, based on the weighted sum of its inputs. Different activation functions are suitable for different types of problems and network architectures.
20. Explain the concept of backpropagation in neural networks. How does it work, and why is it important?
Backpropagation is the core algorithm for training neural networks. It works by calculating the gradient of the loss function with respect to the network's weights. This gradient indicates how much each weight contributed to the error. The process starts with a forward pass where input data is fed through the network to produce an output. Then, the loss (error) is calculated by comparing the network's output to the true target values.
The backpropagation algorithm then propagates this error backwards through the network, layer by layer. For each layer, it calculates the gradient of the loss with respect to the weights and biases of that layer using the chain rule of calculus. These gradients are then used to update the weights and biases, typically using an optimization algorithm like gradient descent, in order to minimize the loss. Its importance lies in its efficiency in adjusting the weights of the neural network to learn complex patterns from data, enabling accurate predictions or classifications. Without it, training complex neural networks would be practically impossible.
21. How do you choose the right machine learning algorithm for a specific problem? What factors do you consider?
Choosing the right machine learning algorithm involves considering several factors. First, understand the type of problem: Is it a classification, regression, clustering, or dimensionality reduction task? The nature of the data also matters: How many features are there? Is the data labeled? What are the data types (numerical, categorical)? The amount of available data is crucial. Some algorithms, like deep learning models, require large datasets, while others perform well with smaller datasets. Additionally, think about the desired outcome. Do you need high accuracy, interpretability, speed of training/prediction, or all of the above?
For example: If the problem is classifying emails as spam or not spam and you have a large dataset, algorithms like Support Vector Machines or ensemble methods like Random Forests and Gradient Boosting could be suitable. If interpretability is important, logistic regression might be a better choice despite potentially slightly lower accuracy. If data is very high-dimensional, consider dimensionality reduction techniques (e.g., PCA) prior to modelling.
22. Explain the concept of a confusion matrix. What information does it provide, and how is it used to evaluate classification models?
A confusion matrix is a table that summarizes the performance of a classification model. It visualizes the counts of true positive (TP), true negative (TN), false positive (FP), and false negative (FN) predictions. Specifically:
- True Positive (TP): Correctly predicted positive cases.
- True Negative (TN): Correctly predicted negative cases.
- False Positive (FP): Incorrectly predicted positive cases (Type I error).
- False Negative (FN): Incorrectly predicted negative cases (Type II error).
By analyzing the confusion matrix, we can derive various evaluation metrics like accuracy, precision, recall, and F1-score to assess the model's strengths and weaknesses in classifying different classes. It helps in understanding the types of errors the model is making and informs strategies for model improvement, such as adjusting classification thresholds or collecting more training data. For example, a medical test with high false negatives could have serious implications.
23. What are some common evaluation metrics for regression models? Explain Mean Squared Error (MSE) and R-squared.
Common evaluation metrics for regression models include Mean Squared Error (MSE), Root Mean Squared Error (RMSE), Mean Absolute Error (MAE), and R-squared.
Mean Squared Error (MSE): MSE calculates the average of the squared differences between the predicted and actual values. It penalizes larger errors more heavily than smaller ones. A lower MSE indicates a better fit.
R-squared: R-squared represents the proportion of variance in the dependent variable that is predictable from the independent variable(s). It ranges from 0 to 1. An R-squared of 1 indicates that the model perfectly explains the variance in the dependent variable, while an R-squared of 0 indicates that the model does not explain any of the variance. It's sometimes called the 'coefficient of determination'.
24. How would you approach a data science project from start to finish? Describe the different stages involved.
My approach to a data science project follows a well-defined process. It begins with understanding the business problem and defining clear objectives. This ensures the project's goals are aligned with the overall business strategy. Next, is data collection, where relevant data sources are identified and gathered. This includes extracting data from databases, APIs, or other external sources. Then comes data cleaning and preprocessing. This crucial stage involves handling missing values, removing inconsistencies, and transforming data into a suitable format for analysis. Feature engineering might also be performed to create new relevant features from existing ones.
After preparing the data, I move to exploratory data analysis (EDA) to gain insights and understand patterns and relationships within the data. This often involves using visualization techniques and statistical methods. Subsequently, comes model selection and training. I'd try several models relevant to the problem at hand such as classification, regression and clustering. After selecting appropriate algorithms, I train models using the prepared data. Model evaluation is critical to assess the performance of the trained models, and I would use relevant metrics to check how well the model performs. Finally, deployment and monitoring take place when the model is put into production, and I will ensure continuous monitoring to detect any performance degradation or data drift, and make necessary adjustments to improve its long-term effectiveness.
Advanced Data Science interview questions
1. How would you approach building a recommendation system for a website with very little user data?
With very little user data (a cold start problem), I'd start with non-personalized recommendations based on popularity or trending items. This could involve:
- Global popularity: Recommending the most frequently viewed, purchased, or rated items.
- Category popularity: Recommending popular items within specific categories.
- Trending items: Identifying items that have recently gained popularity.
- Rule-based recommendations: Implement simple rules based on item metadata (e.g., "customers who viewed X also viewed Y" if enough data exists for some core items). Content-based filtering techniques could also be explored, using item descriptions and features to identify similar products.
As I gather more user data (views, purchases, ratings), I would gradually transition to more personalized methods like collaborative filtering. A simple approach to collaborative filtering could be memory-based, computing similarity between users or items. If collaborative filtering isn't viable due to sparsity, then I'd use content-based filtering with TF-IDF or embeddings to extract features from item descriptions and recommend similar items.
2. Explain the concept of transfer learning and how it can be beneficial in data science projects.
Transfer learning is a machine learning technique where a model trained on one task is re-used as the starting point for a model on a second task. Instead of training a model from scratch, you leverage the learned features from a pre-trained model. This is particularly useful when you have a limited amount of labeled data for your target task. The pre-trained model has already learned general features from a large dataset, which can be fine-tuned or used as a feature extractor for your specific problem.
Transfer learning is beneficial in data science projects because it can significantly reduce training time, improve model performance (especially with limited data), and allow you to work with complex models even without vast computational resources. For example, using a pre-trained image recognition model like ResNet on ImageNet to classify medical images, even with a small dataset of medical images, will likely yield better results compared to training a model from scratch.
3. Describe a situation where you would prefer a non-parametric model over a parametric one. Why?
I would prefer a non-parametric model when the underlying data distribution is unknown or suspected to be complex and deviate significantly from common parametric assumptions like normality. For example, if I'm analyzing user behavior on a website and suspect the data might be multimodal or heavily skewed, a non-parametric model like a decision tree or k-nearest neighbors would be more suitable.
Parametric models, with their rigid assumptions, could lead to inaccurate predictions in such cases. Non-parametric models offer more flexibility to fit the data, potentially capturing intricate relationships that a parametric model might miss. While parametric models can be computationally efficient and require less data, the trade-off in accuracy with poorly fitting assumptions justifies the use of non-parametric methods when dealing with complex, unknown distributions.
4. How would you handle imbalanced classes in a classification problem? What metrics would you focus on?
To handle imbalanced classes, I'd employ several strategies. First, I would consider resampling techniques like oversampling the minority class (e.g., using SMOTE) or undersampling the majority class. Another approach is to use cost-sensitive learning, where misclassification costs are higher for the minority class. I would also explore using different algorithms that are inherently more robust to class imbalance, like tree-based methods (e.g., Random Forests, Gradient Boosting).
When evaluating model performance with imbalanced classes, I'd focus on metrics beyond simple accuracy, which can be misleading. Key metrics include: Precision, Recall, F1-score, Area Under the Precision-Recall Curve (AUC-PR), and Area Under the Receiver Operating Characteristic Curve (AUC-ROC). Specifically, I would pay attention to the F1-score, which balances precision and recall, and AUC-PR, which is more sensitive to changes in the positive class when the class distribution is highly skewed.
5. Explain the bias-variance tradeoff in the context of machine learning models.
The bias-variance tradeoff is a central concept in machine learning. It describes the relationship between a model's tendency to consistently make the same errors (high bias) and its sensitivity to small fluctuations in the training data (high variance). A model with high bias is oversimplified and underfits the data, leading to large errors on both the training and test sets. Conversely, a model with high variance is overly complex and overfits the training data, performing well on the training set but poorly on unseen data due to its sensitivity to noise.
The goal is to find a sweet spot that minimizes both bias and variance. Decreasing bias often increases variance, and vice versa. Techniques like regularization, cross-validation, and feature selection are used to manage this tradeoff and build models that generalize well to new data. An optimal model should be complex enough to capture the underlying patterns in the data but not so complex that it fits the noise.
6. How would you design an A/B test to measure the impact of a new feature on a website?
To design an A/B test for a new website feature, I'd first define a clear hypothesis (e.g., "The new feature will increase conversion rate"). Next, I'd randomly divide website traffic into two groups: a control group (A) seeing the original website and a treatment group (B) seeing the website with the new feature. I would use a tool like Google Optimize or Optimizely to manage the test and track key metrics such as conversion rate, bounce rate, and time on page.
I'd run the test for a predetermined duration (e.g., two weeks) or until a statistically significant difference is observed between the two groups. Sample size should be large enough to provide statistical power. After the test, I'd analyze the data using statistical methods (e.g., t-tests) to determine if the new feature had a significant impact on the chosen metrics. If the results are positive and statistically significant, the feature can be rolled out to all users. If not, further iteration or abandonment of the feature may be necessary. We also need to confirm that the result is practical significant, not just statistical.
7. Describe the difference between bagging and boosting. How do they reduce variance and bias respectively?
Bagging and boosting are both ensemble learning techniques used to improve the accuracy and robustness of machine learning models, but they differ significantly in how they combine individual models.
Bagging (Bootstrap Aggregating) reduces variance by creating multiple independent models from different subsets of the training data (sampled with replacement). Each model is trained independently, and their predictions are averaged (for regression) or voted (for classification) to produce a final prediction. This averaging reduces the impact of outliers and noisy data, leading to a more stable and less overfit model, thus reducing variance. Boosting, on the other hand, reduces bias by sequentially building models, where each subsequent model focuses on correcting the mistakes of the previous ones. It assigns weights to data points, increasing the weights of misclassified instances. This forces subsequent models to pay more attention to these difficult instances, which reduces bias. Examples of boosting algorithms include AdaBoost and Gradient Boosting.
8. Explain the concept of regularization and its importance in preventing overfitting.
Regularization is a technique used to prevent overfitting in machine learning models. Overfitting occurs when a model learns the training data too well, including its noise and outliers, leading to poor performance on unseen data. Regularization adds a penalty term to the model's loss function, discouraging it from learning overly complex patterns. This penalty term is based on the magnitude of the model's coefficients; larger coefficients are penalized more heavily. Common regularization techniques include L1 (Lasso) and L2 (Ridge) regularization.
The importance of regularization lies in its ability to improve the generalization performance of a model. By preventing the model from becoming too specialized to the training data, regularization ensures that it can accurately predict outcomes on new, unseen data. This leads to more robust and reliable models in real-world applications. Without regularization, complex models may perform exceptionally well on the training set but fail miserably when applied to real-world data. L1 regularization can also be used for feature selection.
9. How would you approach a data science project where the data is highly unstructured (e.g., text, images, audio)?
When approaching a data science project with highly unstructured data, I typically follow a structured approach. First, I define the problem clearly. What business question are we trying to answer? Then, I focus on data collection and exploration. This involves understanding the sources, volume, and potential biases in the data. A crucial step is data preprocessing and feature engineering. For text data, this might include tokenization, stemming, and creating TF-IDF vectors or word embeddings. For images, it could involve resizing, color normalization, and using pre-trained convolutional neural networks (CNNs) for feature extraction. Audio data might require feature extraction techniques like MFCCs. Next, I build and evaluate models, selecting algorithms appropriate for the task (e.g., NLP models for text, CNNs for images). Finally, I focus on interpretation and communication of results, highlighting the limitations and potential biases in the data and models.
Specifically, for unstructured data:
- Text: I'd use techniques like NLP, sentiment analysis, topic modeling, and text classification. Libraries like
NLTK,spaCy, andtransformersin Python are incredibly useful. - Images: I'd explore computer vision techniques using CNNs and transfer learning. Libraries like
TensorFlowandPyTorchare key. - Audio: I'd use techniques like signal processing, feature extraction (MFCCs), and audio classification models. Libraries like
LibrosaandPyAudioAnalysisare helpful.
10. Describe a time when you had to deal with missing data. What methods did you use to handle it, and why?
In a recent project analyzing customer churn, a significant portion of customer profiles were missing demographic information (age, income). To address this, I first assessed the extent and pattern of missingness. I found that the data was missing completely at random (MCAR) for some variables, but for others, it seemed correlated with churn status (e.g., customers about to churn might be less likely to update their profile).
For MCAR data, I used listwise deletion when running models where that variable was not considered essential. This ensured I only worked with complete, unbiased data for critical parts. For variables linked to churn, I used imputation methods like mean imputation and K-Nearest Neighbors (KNN) imputation. KNN proved superior because it could capture relationships with other variables more accurately, thereby reducing bias compared to a simple mean imputation, especially considering potential biases related to the reasons behind the data being missing.
11. Explain the concept of ensemble learning and how it can improve model performance.
Ensemble learning is a machine learning technique that combines multiple individual models to create a stronger, more robust model. The idea is that by aggregating the predictions of several models, the ensemble can often achieve better performance than any single model alone. This is because different models may capture different aspects of the underlying data and make different errors. By combining them, we can reduce the variance and bias of the overall model.
There are several common ensemble methods, including:
- Bagging: Training multiple models on different subsets of the training data (e.g., Random Forest).
- Boosting: Sequentially training models, where each model tries to correct the errors of its predecessors (e.g., AdaBoost, Gradient Boosting).
- Stacking: Training multiple models and then training a meta-model to combine their predictions.
Ensemble methods improve performance by reducing overfitting, handling noisy data better, and often achieving higher accuracy and robustness compared to individual models. They also provide a more reliable and stable prediction than any single model
12. How would you evaluate the performance of a regression model? What metrics would you use, and why?
To evaluate a regression model, I would use several metrics to understand different aspects of its performance. Mean Squared Error (MSE) calculates the average squared difference between predicted and actual values, penalizing larger errors more heavily. Root Mean Squared Error (RMSE) is the square root of MSE and is easier to interpret as it's in the same units as the target variable. Mean Absolute Error (MAE) calculates the average absolute difference between predicted and actual values, providing a more robust measure to outliers compared to MSE.
R-squared (Coefficient of Determination) measures the proportion of variance in the dependent variable that can be predicted from the independent variables. It ranges from 0 to 1, where a higher value indicates a better fit. Adjusted R-squared is a modified version of R-squared that adjusts for the number of predictors in the model. Choosing the right metric depends on the specific problem and the importance of different types of errors. For instance, if outliers are a significant concern, MAE might be preferred over MSE. If interpretability in original units is needed, RMSE is preferable.
13. Describe the difference between supervised, unsupervised, and reinforcement learning.
Supervised learning involves training a model on a labeled dataset, where the input data and the desired output are provided. The goal is for the model to learn a mapping function that can predict the output for new, unseen input data. Examples include image classification and regression.
Unsupervised learning, on the other hand, deals with unlabeled data. The aim is to discover hidden patterns, structures, or relationships within the data. Clustering and dimensionality reduction are common unsupervised learning techniques. Reinforcement learning is a type of learning where an agent learns to make decisions in an environment to maximize a reward. The agent interacts with the environment, receives feedback in the form of rewards or penalties, and adjusts its actions accordingly. It is commonly used in robotics and game playing.
14. How do you make sure the model you built is still performing well after a period of time? How do you handle concept drift?
To ensure a model continues to perform well, I implement continuous monitoring and evaluation using appropriate metrics. Performance is tracked over time and compared against a baseline. If the performance degrades significantly, it indicates a potential issue, possibly concept drift. To handle concept drift, several strategies can be used, including:
- Retraining the model: Periodically retrain the model on new data to incorporate the latest patterns and trends.
- Online learning: Use algorithms that can adapt to changes in real-time, such as stochastic gradient descent with a small learning rate.
- Ensemble methods: Combine multiple models trained on different time periods or data subsets. As performance degrades, models can be weighted or replaced.
- Feature engineering: Adapt or create new features to capture changes in the underlying data distribution.
- Drift detection methods: Implement algorithms that detect concept drift, such as the Drift Detection Method (DDM) or Page Hinkley test. Upon detection, trigger retraining or other mitigation strategies.
15. Explain what are the assumptions of linear regression and how to test those assumptions?
Linear regression relies on several key assumptions. These include: Linearity (the relationship between the independent and dependent variables is linear), Independence of errors (the errors are independent of each other), Homoscedasticity (the errors have constant variance), Normality of errors (the errors are normally distributed), and no multicollinearity (independent variables are not highly correlated).
These assumptions can be tested using various methods. Linearity can be checked using scatter plots of the independent variables against the dependent variable, or by plotting residuals against predicted values. Independence of errors can be assessed using the Durbin-Watson test. Homoscedasticity can be examined using scatter plots of residuals against predicted values (look for a constant variance). Normality of errors can be tested using histograms, Q-Q plots, or statistical tests like the Shapiro-Wilk test on the residuals. Multicollinearity can be checked using Variance Inflation Factor (VIF); a high VIF (generally > 5 or 10) indicates multicollinearity. statsmodels library in python can be used to test these assumptions.
16. How would you explain p-value to a non-technical stakeholder?
Imagine we're testing a hunch. The p-value tells us how likely it is that we'd see the results we did (or even more extreme results) if that hunch was actually wrong. Think of it like this: if the p-value is small (usually less than 0.05), it suggests the results are unlikely to be a fluke, and our initial hunch might be correct. A larger p-value means the results are more likely due to random chance, so our hunch is probably incorrect.
In simpler terms, a small p-value is evidence against the idea that there's no real effect, suggesting there is a real effect. It's not proof, but it's strong evidence. The p-value doesn't tell you how big or important the effect is, just how surprising the data are if there's no actual effect at all.
17. You have built a classification model. However, it is deployed in production and is misclassifying a certain group of customers at a higher rate than others. How would you approach addressing this fairness issue?
First, I'd thoroughly investigate the data to understand why this group is being misclassified. This involves examining the features, distributions, and potential biases within this specific group compared to others. I would also want to confirm that the model's performance is indeed disproportionately worse for this group using appropriate fairness metrics (e.g., disparate impact, equal opportunity).
Next, I'd explore mitigation strategies. This might include re-weighting the samples during training to give more importance to the misclassified group, collecting more data specific to that group to improve model representation, or applying fairness-aware algorithms that explicitly aim to reduce bias during the model building process. If feature bias is detected, I would consider feature engineering or transformations to mitigate the discriminatory impact. Finally, I would carefully monitor the model's performance on all groups after implementing any changes to ensure that fairness is improved without significantly sacrificing overall accuracy.
18. How do you select the right features for your model and why is it important?
Selecting the right features is crucial for building effective machine learning models. It involves identifying the most relevant variables from your dataset that contribute significantly to the prediction task. Feature selection helps in simplifying the model, reducing overfitting, improving accuracy, and speeding up training time. Irrelevant or redundant features can introduce noise and complexity, hindering the model's ability to generalize to new data.
Methods for feature selection include:
- Filter methods: Using statistical measures like correlation or chi-squared tests to rank features.
- Wrapper methods: Evaluating different subsets of features by training and testing the model (e.g., forward selection, backward elimination).
- Embedded methods: Feature selection is a part of the model training process (e.g., LASSO regularization).
19. What are the common sources of bias in data and how can they impact your analysis?
Common sources of bias in data include: Sampling bias (non-random selection of data points), selection bias (systematic differences between groups being compared), confirmation bias (seeking data that confirms existing beliefs), recall bias (systematic differences in how participants remember past events), and measurement bias (errors in data collection). These biases can severely impact analysis by leading to inaccurate conclusions, skewed models, and poor decision-making. For example, a model trained on biased data may perform poorly on unseen, representative data.
20. How do you approach a new data science problem with limited domain knowledge?
When faced with a new data science problem where my domain knowledge is limited, I start by focusing on understanding the problem statement and available data. I would begin by:
- Clearly defining the problem: Understanding the objective, target variable, and success metrics. I'd ask clarifying questions to stakeholders or domain experts to ensure I'm aligned on the goals. I would seek help from external resources (Google, StackOverflow).
- Exploratory Data Analysis (EDA): Thoroughly examine the data to understand its structure, identify missing values, outliers, and potential features. I would apply statistical techniques and visualizations to get a feel for the data and its relationships.
- Domain Knowledge Acquisition: Simultaneously, I would dedicate time to acquire relevant domain knowledge through online resources, research papers, and consultations with domain experts. This helps in feature engineering, model selection, and interpreting results. I will prioritize understanding the context of the problem.
- Iterative Approach: I would build a simple baseline model early on and iteratively improve it based on insights gained from EDA, domain knowledge, and model performance. I would continuously validate my assumptions and interpretations with domain experts.
21. Can you describe a project where you had to communicate complex data insights to a non-technical audience? What strategies did you use to make the information understandable and impactful?
In a previous role, I worked on a project analyzing customer churn for a subscription-based service. The data was complex, involving behavioral patterns, demographic information, and engagement metrics. I had to present my findings to the marketing team, who weren't familiar with statistical analysis or data modeling.
To make the information understandable, I avoided technical jargon and focused on telling a story with the data. I used visuals like charts and graphs to illustrate key trends, keeping them clean and easy to interpret. I also translated the statistical insights into actionable recommendations, such as targeting specific customer segments with personalized offers to reduce churn. Instead of saying 'customers with a low engagement score are highly likely to churn', I would say 'Customers who haven't logged in for two weeks are 3 times more likely to cancel their subscription. We can prevent this by proactively emailing them discount offers'. Emphasizing the 'so what?' helped the team quickly grasp the implications and act on the findings. I also made sure to provide a summary slide with the top 3 key takeaways.
22. How would you handle a situation where you have a model that performs well in training but poorly in production?
When a model performs well in training but poorly in production, it indicates overfitting or a mismatch between the training and production environments. I would first investigate data discrepancies between training and production datasets. This involves checking for data drift (changes in the input data distribution), missing features, or incorrect feature scaling.
Next, I would evaluate the model's complexity and regularization. A highly complex model might overfit the training data. I would consider techniques like L1/L2 regularization, dropout, or simplifying the model architecture. I would also examine the evaluation metrics used in training and ensure they are relevant and representative of the production environment. Finally, I'd implement robust monitoring in production to detect performance degradation early and trigger retraining or model updates as needed. Techniques like shadow deployment can also be used to test models in production before fully releasing them. If retraining is needed, consider using a training dataset that is more representative of the production environment.
23. Explain different methods of dimensionality reduction and when each should be applied.
Dimensionality reduction techniques aim to reduce the number of features in a dataset while preserving important information. Principal Component Analysis (PCA) is a linear technique that projects data onto orthogonal components that capture maximum variance; it's suitable for continuous data and when features are highly correlated. Linear Discriminant Analysis (LDA) is supervised and aims to find the best linear discriminants to separate different classes; use it for classification problems when class separation is crucial. T-distributed Stochastic Neighbor Embedding (t-SNE) is non-linear and focuses on preserving the local structure of the data, making it ideal for visualization of high-dimensional data in lower dimensions, but is computationally expensive. Autoencoders are neural networks trained to reconstruct the input, forcing them to learn a compressed representation in the bottleneck layer; suitable for both linear and non-linear dimensionality reduction, particularly with image or sequential data. Feature selection methods, such as selecting features based on variance threshold or using regularization (L1 regularization), directly select a subset of the original features; this can be useful when feature interpretability is important. The choice depends on data type (continuous, categorical), linearity assumptions, whether supervision is available (supervised vs. unsupervised), and the specific goal (visualization, feature interpretability, or performance improvement).
Expert Data Science interview questions
1. How would you design a real-time fraud detection system for credit card transactions, considering both speed and accuracy?
A real-time fraud detection system requires a multi-layered approach focusing on speed and accuracy. Initially, a rule-based engine can quickly flag suspicious transactions based on predefined rules (e.g., unusually large amount, transactions from unusual locations, multiple transactions in a short time). Simultaneously, machine learning models, pre-trained on historical transaction data, can score each transaction for its likelihood of being fraudulent. These models would consider features like transaction amount, merchant category, time of day, customer purchase history, and location.
To balance speed and accuracy, prioritize model simplicity and feature selection for the ML models. Consider using ensemble methods (e.g., random forests, gradient boosting) or neural networks for improved accuracy. The rule-based engine acts as a first line of defense for known fraud patterns, while the ML models handle more complex and evolving patterns. The output of both systems is combined (e.g., weighted average, logical AND/OR) to generate a final fraud score. Transactions exceeding a certain threshold are flagged for manual review. Techniques like online learning could be incorporated to adapt to new fraud patterns continuously. Consider Kafka or RabbitMQ for handling high transaction throughput. Redis or Memcached could cache frequently accessed user profiles or transaction history for faster feature retrieval.
2. Explain how you would approach building a recommendation system for a new e-commerce platform with limited user data.
With limited user data (a cold start problem), I'd begin with a non-personalized approach. This involves leveraging content-based filtering and popularity-based recommendations. For content-based filtering, I'd focus on rich product metadata such as descriptions, categories, and attributes. Then use techniques like TF-IDF or embeddings to quantify similarity between products. I would also track overall product popularity (e.g., views, purchases) and recommend the most popular items initially.
As we gather more user data, I'd transition to collaborative filtering methods. Initially, this could be memory-based collaborative filtering (user-based or item-based), and as data increases, shift towards model-based methods like matrix factorization. Furthermore, I'd implement explicit feedback mechanisms (ratings, reviews) and implicit feedback (clicks, add-to-carts) to improve recommendations over time and continuously evaluate system performance with metrics such as precision, recall, and NDCG.
3. Describe a situation where you had to deal with a biased dataset and how you mitigated the bias in your analysis.
In a project predicting customer churn for a telecommunications company, I noticed the dataset heavily over-represented customers from a specific geographic region. This region also had a lower average income and potentially different usage patterns. If left unaddressed, the model would likely predict churn more accurately for this region and less accurately for others, leading to unfair or ineffective retention strategies.
To mitigate this bias, I employed a combination of techniques. First, I used stratified sampling during the train/test split to ensure each region was proportionally represented in both datasets. Second, I explored feature engineering to create interaction terms between geographic region and other relevant features like usage frequency or plan type. This allowed the model to learn region-specific relationships. Finally, I monitored model performance across different regions using metrics like precision and recall to identify and address any remaining disparities. The adjusted model provided more balanced and reliable churn predictions across all customer segments.
4. How would you explain the concept of adversarial networks to someone with no prior knowledge of machine learning?
Imagine two networks playing a game. One network, the 'Generator', tries to create fake data (like images or text) that looks real. The other network, the 'Discriminator', acts like a detective, trying to distinguish between the real data and the fake data created by the Generator.
They compete: the Generator gets better at creating realistic fake data to fool the Discriminator, and the Discriminator gets better at spotting the fakes. This back-and-forth continues until the Generator can produce fake data that's nearly indistinguishable from real data. In the end, you have a system capable of creating realistic content.
5. Design an experiment to determine the optimal pricing strategy for a new product, considering various market conditions.
To determine the optimal pricing strategy, I'd conduct an A/B test across different market segments. First, identify key market segments (e.g., demographics, geography, price sensitivity). Then, randomly assign each segment to one of several pricing tiers for the new product. Track key metrics like conversion rates, sales volume, revenue, and customer acquisition cost for each segment and pricing tier over a defined period. Analyze the data to identify the price point that maximizes profitability within each segment.
Further refine the experiment by incorporating factors like competitor pricing, promotional offers, and perceived value. For example, test different promotional bundles at various price points. Also, run surveys to gather customer feedback on price perception and willingness to pay. By combining quantitative data from A/B testing with qualitative insights from surveys, we can optimize the pricing strategy and achieve the best possible market penetration and profitability.
6. Discuss a time when you had to convince stakeholders to adopt a new data science approach, overcoming their initial skepticism.
During a project aimed at improving customer churn prediction, I proposed using a gradient boosting model instead of the traditional logistic regression model that the marketing team was comfortable with. Initially, they were skeptical because they understood the coefficients from logistic regression and how they directly related to marketing actions. To address their concerns, I first explained the limitations of logistic regression for complex non-linear relationships present in our customer data. Then, I demonstrated the superior performance of the gradient boosting model through rigorous backtesting and validation on historical data, showing a significant improvement in prediction accuracy. Furthermore, I used SHAP values to explain the feature importance and the model's decision-making process in a way that was intuitive and relatable to their marketing expertise. This transparency, coupled with the demonstrable performance gains, convinced them to adopt the new approach, leading to a more effective churn prevention strategy.
I also prepared an A/B test proposal where both model predictions would be used on separate customer segments, and the team could compare results. This further increased their confidence in the new approach since they had the ability to monitor and compare results while still maintaining the current method. I continuously updated them on the progress and business impact in a language that they could understand.
7. How would you handle a situation where your machine learning model is performing well in the lab but poorly in production?
When a machine learning model performs well in the lab but poorly in production, several factors could be at play. First, I'd investigate data discrepancies between the lab and production environments. This includes checking for data drift (changes in input data distribution), feature mismatch, and differences in data quality (missing values, noise). I'd implement monitoring systems to detect these issues automatically. I would also check the model deployment process, paying close attention to the way features are created for the production model, verifying that there are no differences between the way the features are built in production versus in the lab environment. Finally, I would verify that the infrastructure in production is the same or equivalent to the lab environment.
8. Explain how you would use reinforcement learning to optimize the routing of delivery trucks in a large city.
I would use reinforcement learning (RL) to train an agent to optimize delivery truck routes. The environment would be the city's road network, with states representing the trucks' locations, remaining deliveries, and current traffic conditions. The agent's actions would be route choices, such as selecting the next street or intersection to travel to. The reward function would be designed to encourage efficient deliveries, for example, by penalizing late deliveries, long routes, and fuel consumption, while rewarding on-time deliveries and shorter routes. I'd likely use a Deep Q-Network (DQN) or a policy gradient method like Proximal Policy Optimization (PPO) to train the agent, feeding it real-time traffic data and delivery schedules. I'd also simulate various scenarios for faster learning and evaluate the agent's performance on a held-out set of real-world data before deployment.
Specifically, consider a simplified scenario where the agent needs to decide between turning left, right or going straight at an intersection. The state includes the current location, the destination location, and the current time. The action space is {left, right, straight}. The reward function could be reward = -distance_to_destination - delay_penalty. The RL algorithm would then learn a policy that minimizes the total distance traveled and the total delay, resulting in optimized routing.
9. Describe a project where you had to integrate data from multiple disparate sources and the challenges you faced.
In my previous role, I worked on a project to build a unified customer view by integrating data from our CRM, marketing automation platform, and e-commerce system. The primary challenge was data inconsistency across the different sources. For example, customer names and addresses were formatted differently, and customer IDs were not consistently used across all systems. We also faced challenges with data quality, such as missing or inaccurate information.
To address these challenges, we implemented a data cleansing and transformation pipeline using Python and Pandas. This involved standardizing data formats, deduplicating records, and creating a master customer ID. We also established data quality rules and monitoring to ensure data accuracy and completeness. Specifically, we used fuzzy matching algorithms to link records with slight variations, and implemented data validation checks using regular expressions like re.match(r'^[a-zA-Z0-9._%+-]+@[a-zA-Z0-9.-]+\.[a-zA-Z]{2,}$', email) for email format validation. The end result was a consolidated and reliable customer dataset that significantly improved our marketing and sales efforts.
10. How would you approach building a model to predict customer churn for a subscription-based service?
I'd approach predicting customer churn by first defining churn precisely (e.g., cancellation of subscription within a defined period). Then, I'd gather relevant data, including demographics, usage patterns (frequency of service use, features used), billing information, support interactions, and customer satisfaction scores. This data is cleaned and preprocessed, handling missing values and outliers. Feature engineering is also important. I would then train a classification model. Algorithms like Logistic Regression, Random Forest, or Gradient Boosting Machines (like XGBoost or LightGBM) are good starting points.
Model evaluation is key. I'd use metrics like precision, recall, F1-score, and AUC-ROC to assess model performance on a held-out test set, focusing on identifying customers likely to churn (high recall). It's also crucial to interpret model results to understand which factors are most predictive of churn and A/B test retention strategies based on model predictions. Regular monitoring and retraining of the model with updated data is also key for maintaining performance.
11. Explain the difference between type I and type II errors in hypothesis testing and their implications in a real-world scenario.
Type I error (false positive) occurs when you reject a true null hypothesis. Imagine a medical test for a disease; a Type I error would mean telling a healthy person they have the disease. The implication is unnecessary anxiety, further testing, and potentially harmful treatment. Type II error (false negative) occurs when you fail to reject a false null hypothesis. In the same medical context, this means telling a sick person they are healthy. The implication is delayed treatment, potentially worsening the disease and even death.
The choice of acceptable error types often depends on the context. If the cost of a false positive is low, but the cost of a false negative is high (e.g., security screening), you might be more tolerant of Type I errors. Conversely, if a false positive has severe consequences but missing a true effect isn't critical, you would prioritize minimizing Type I errors.
12. Design a system to automatically detect and classify different types of defects in a manufacturing process using computer vision.
The system would use a combination of image acquisition, preprocessing, feature extraction, and classification techniques. Initially, high-resolution images or videos of manufactured products are captured. Preprocessing steps like noise reduction, contrast enhancement, and image registration are applied. Feature extraction involves using techniques like edge detection, texture analysis (e.g., LBP, Haralick features), and deep learning-based feature embeddings (from CNNs like ResNet or EfficientNet) to identify potential defects. Finally, a classifier such as a Support Vector Machine (SVM), Random Forest, or a Convolutional Neural Network (CNN) is trained to classify the defects into predefined categories (e.g., scratches, dents, cracks).
The system can be implemented using Python with libraries like OpenCV for image processing, scikit-learn for traditional machine learning algorithms, and TensorFlow or PyTorch for deep learning. A crucial component involves creating a labeled dataset of defect images for training the classification model. Model performance should be evaluated using metrics like precision, recall, and F1-score, and continuously improved through retraining and data augmentation. Real-time defect detection can be achieved by integrating the system with the manufacturing line and optimizing inference speed.
13. How would you handle missing data in a time series dataset and the potential impact on your analysis?
Handling missing data in time series requires careful consideration. Several strategies exist, each with its own pros and cons. Common methods include: Imputation: Replacing missing values with estimates like the mean, median, or mode (simple but can distort distributions). More sophisticated techniques such as linear interpolation, seasonal decomposition, or using machine learning models to predict missing values offer potentially better results but need to be chosen carefully to avoid introducing bias or unrealistic patterns. Deletion: Removing rows with missing values. This is easiest, but can lead to significant data loss and introduce bias, especially if missingness is not completely random. Forward/Backward Fill: Propagating the last known value forward or the next known value backward. Suitable when data changes slowly, but can be inaccurate for volatile data. When choosing imputation, be aware of how it may affect properties such as stationarity of the series, and correct using approaches such as differencing. Also, make sure any imputation is performed on train/test split data sets separately.
The impact of missing data can be significant. Gaps in the data can distort trends, seasonality, and correlations, leading to inaccurate forecasts and misleading insights. Statistical tests and machine learning algorithms may produce biased or unreliable results. For example, using python:
import pandas as pd
# Simple forward fill imputation
df['column_with_missing'].fillna(method='ffill', inplace=True)
Before any analysis, it's vital to document the presence of missing data, explore potential causes, and carefully consider the impact of different imputation methods on the downstream analysis and model performance. Evaluating models by using walk-forward validation on time series is a robust methodology.
14. Explain how you would use natural language processing to analyze customer feedback and identify areas for improvement.
I would use NLP to analyze customer feedback by first collecting data from various sources like surveys, reviews, and social media. Then, I would preprocess the text data by cleaning it (removing irrelevant characters), tokenizing it (splitting into words), and stemming/lemmatizing the words to reduce them to their root form.
Next, I would use techniques like sentiment analysis to understand the overall tone of the feedback (positive, negative, neutral). Topic modeling (e.g., LDA) can help identify common themes or topics discussed in the feedback. Furthermore, I would implement keyword extraction to pinpoint frequently mentioned keywords. Combining these NLP techniques enables me to identify specific areas where customers are facing issues and highlight potential areas for improvement in products, services, or customer experience. The results will be visualized using charts and graphs to summarise and present to stakeholders.
15. Describe a situation where you had to deal with a very large dataset and the techniques you used to efficiently process it.
In a previous role, I worked on a project involving clickstream data for an e-commerce website. This dataset was massive, consisting of billions of events per day. To efficiently process it, we used a combination of techniques. First, we employed distributed computing using Apache Spark on a Hadoop cluster to parallelize the processing across multiple nodes. We used Spark's ability to handle large datasets in memory, and optimized our Spark jobs by carefully considering data partitioning, avoiding shuffles where possible, and using appropriate data formats like Parquet for efficient storage and retrieval.
Secondly, we utilized data sampling techniques to initially explore and understand the data characteristics before running full-scale processing. This allowed us to quickly identify patterns and validate our processing logic. We also implemented incremental processing, where we only processed the new data added since the last run, instead of reprocessing the entire dataset each time. For aggregation queries, we pre-computed aggregates on a daily basis to speed up query performance. Finally, we employed bloom filters to efficiently filter out irrelevant data during processing, further reducing the computational overhead. Code example using Spark:
val df = spark.read.parquet("hdfs://path/to/data")
val filteredDf = df.filter(col("timestamp") > lit(startTime))
val aggregatedDf = filteredDf.groupBy("userId").count()
16. How would you approach building a model to predict the spread of a disease, considering various factors such as population density and travel patterns?
To predict disease spread, I'd build a compartmental model (like SEIR) and enhance it with machine learning. First, I'd gather data on: Population density (from census data) Travel patterns (from mobile phone data or surveys) Disease characteristics (transmission rate, incubation period) Environmental factors (temperature, humidity) Public health interventions (vaccination rates, mask usage). The model would involve differential equations to simulate transitions between susceptible (S), exposed (E), infected (I), and recovered (R) states. I would use machine learning algorithms like regression or neural networks to predict key parameters in the SEIR model, such as the transmission rate, based on the gathered factors. I would then validate the model against historical data and adjust parameters to improve accuracy. Model evaluation would involve metrics like R-squared, RMSE, and comparing predicted vs actual infection rates. The final model will be used to forecast future spread and inform public health strategies.
17. Explain the concept of transfer learning and how it can be used to improve the performance of machine learning models.
Transfer learning is a machine learning technique where a model developed for one task is reused as the starting point for a model on a second task. It's especially useful when you have limited data for the second task. Instead of training a model from scratch, you leverage the knowledge gained from a pre-trained model on a related task with a large dataset.
Transfer learning improves performance by allowing the model to generalize better and converge faster on the new task. The pre-trained model has already learned general features from the original task, so the new model needs to learn task-specific features which requires less data and time. Techniques include feature extraction (using the pre-trained model as a feature extractor and training a new classifier) and fine-tuning (unfreezing some layers of the pre-trained model and training them with the new data).
18. Design an experiment to evaluate the effectiveness of a new marketing campaign, considering various metrics and potential confounding factors.
To evaluate the marketing campaign, I'd design an A/B test. A control group will receive existing marketing, while the test group receives the new campaign. Key metrics include website traffic, conversion rates (e.g., sign-ups, purchases), customer acquisition cost (CAC), and customer lifetime value (CLTV). I'll also track social media engagement (likes, shares, comments) and brand mentions.
Potential confounding factors include seasonality, competitor activities, and changes in the overall market. I'd mitigate these by ensuring both groups are exposed to the same external conditions, monitoring competitor campaigns, and using statistical methods (e.g., regression analysis) to adjust for external variables. Segmentation of users based on demographics or past behavior will help control for inherent group differences.
19. How would you handle a situation where your machine learning model is being used to make decisions that have ethical implications?
When a machine learning model makes decisions with ethical implications, a multi-faceted approach is crucial. First, I'd prioritize transparency by documenting the model's inputs, logic, and potential biases. Regular audits and monitoring are essential to identify and address any unintended discriminatory outcomes or ethical concerns. Open communication with stakeholders, including ethicists and domain experts, helps refine the model's design and usage guidelines.
Secondly, I would incorporate fairness-aware algorithms and techniques, such as adversarial debiasing, to mitigate bias in the model's predictions. User feedback mechanisms are vital for continuous improvement. If biases cannot be effectively mitigated or ethical considerations outweigh the model's benefits, I would advocate for its modification or discontinuation, prioritizing ethical responsibility over performance metrics. The design should have an option for a human in the loop and provide explanations for its decisions.
20. Explain how you would use deep learning to analyze images and identify objects of interest.
I would use a Convolutional Neural Network (CNN) for image analysis and object identification. First, I would collect and label a large dataset of images with the objects of interest clearly marked (bounding boxes or segmentation masks). Then, I'd train a CNN architecture like ResNet, YOLO, or Mask R-CNN on this dataset using transfer learning from pre-trained weights (e.g., ImageNet) to accelerate training and improve accuracy.
During training, the CNN learns hierarchical features from the image data. After training, I would use the trained model to predict the objects of interest in new, unseen images. For example, if using YOLO, the model will output bounding boxes and class probabilities for each detected object. These predictions can then be filtered based on confidence scores to only keep the most reliable detections. Post-processing techniques, such as Non-Maximum Suppression (NMS), can further refine the results.
21. Describe a project where you had to work with a team of people with different skill sets and how you coordinated your efforts.
In a recent project to develop a new e-commerce platform, I collaborated with a team consisting of front-end developers, back-end engineers, UX designers, and QA testers. Each member possessed distinct expertise, requiring careful coordination to ensure a smooth workflow. My role was primarily focused on the back-end development, specifically building the API endpoints and database interactions.
To facilitate collaboration, we implemented Agile methodologies, including daily stand-up meetings to track progress and address roadblocks. We used Jira to manage tasks and assignments, ensuring transparency and accountability. Furthermore, we utilized Git for version control, enabling seamless code integration and conflict resolution. For instance, when the front-end team needed specific data formats from the API, we used tools like Postman to share API specifications and test endpoints collaboratively. This allowed them to build their components effectively while I simultaneously addressed any back-end issues. We also had shared Slack channels for immediate communication.
22. How would you approach building a model to predict stock prices, considering the inherent volatility of the market?
Building a stock price prediction model requires acknowledging the market's volatility and inherent noise. My approach would involve a combination of time series analysis, machine learning, and sentiment analysis. I'd start by gathering historical stock data (open, high, low, close, volume) and exploring time series models like ARIMA or Exponential Smoothing to capture trends and seasonality. Then, I'd incorporate machine learning models such as Random Forests or Gradient Boosting, using technical indicators (RSI, MACD, moving averages) as features to capture more complex patterns.
Furthermore, sentiment analysis on news articles and social media can provide valuable insights into market sentiment and potential price movements. I would use Natural Language Processing (NLP) techniques to extract sentiment scores and incorporate them as features in the model. Feature selection and hyperparameter tuning would be crucial to optimize model performance and prevent overfitting. Backtesting on historical data and continuous monitoring in a live environment are necessary to evaluate the model's effectiveness and adapt to changing market conditions. I would also consider risk management strategies, such as setting stop-loss orders, as predictions are inherently uncertain.
Data Science MCQ
Question 1.
Which of the following methods is most effective in reducing overfitting when training a decision tree?
Options:
Options:
Question 2.
Which of the following data structures is most appropriate for implementing a priority queue, where elements are retrieved based on their priority?
Options:
Options:
Question 3.
Which of the following methods is commonly used to address the issue of imbalanced classes in a classification problem?
Options:
Options:
Question 4.
Which of the following evaluation metrics is most appropriate for assessing the performance of a classification model trained on an imbalanced dataset?
Options:
Question 5.
Which of the following dimensionality reduction techniques is most suitable for handling non-linear data?
Options:
Question 6.
Which clustering algorithm is most suitable for datasets where clusters have varying sizes, shapes, and densities?
Options:
- K-Means
- Hierarchical Clustering with Ward linkage
- DBSCAN
- Gaussian Mixture Models (GMM)
Options:
Question 7.
Which evaluation metric is most robust to outliers when evaluating the performance of a regression model?
Options:
Options:
Question 8.
Which resampling technique is most suitable when dealing with a highly imbalanced dataset and aiming to balance the class distribution?
Options:
Question 9.
Which activation function is most appropriate for the output layer of a neural network designed for a multi-class classification problem?
Options:
Question 10.
Which of the following algorithms is most suitable for anomaly detection in high-dimensional datasets, particularly when anomalies are sparse and scattered? Options:
Options:
Question 11.
Which of the following algorithms is most suitable for imputing missing values in a dataset containing both numerical and categorical features?
Options:
Question 12.
Which of the following feature selection techniques is most appropriate for a high-dimensional dataset with a large number of irrelevant features?
Options:
Question 13.
Which regularization technique is most effective in preventing overfitting by shrinking the coefficients towards zero, while also performing feature selection by setting some coefficients to exactly zero in linear regression?
Options:
Options:
Question 14.
Which algorithm is generally most suitable for predicting customer churn, a binary classification problem?
Options:
Question 15.
Which regression algorithm is most robust to outliers in the dataset?
Options:
Question 16.
Which of the following methods is most suitable for forecasting a time series with a clear trend and seasonality?
Options:
Options:
Question 17.
Which evaluation metric is most appropriate for assessing the performance of a model that predicts probabilities of events, where the probabilities themselves are important and not just the final classification?
Options:
Question 18.
Which evaluation metric is most suitable for assessing the performance of a classification model when the cost of a false positive is significantly higher than the cost of a false negative?
Options:
- A) Accuracy
- B) Precision
- C) Recall
- D) F1-score
Options:
Question 19.
Which data normalization technique is most appropriate when your dataset contains outliers?
Options:
Question 20.
Which algorithm is most suitable for building a recommendation system that predicts user preferences based on past interactions (e.g., purchases, ratings) between users and items?
Options:
Options:
Question 21.
Which evaluation metric is most suitable for assessing the performance of a sentiment analysis model where the goal is to accurately classify sentiment as positive, negative, or neutral?
Options:
Question 22.
Which deep learning architecture is most appropriate for image classification tasks?
Options:
Options:
Question 23.
Which of the following techniques is most commonly used to determine feature importance in a Random Forest model?
options:
Options:
Question 24.
You are comparing the means of two independent groups (Group A and Group B) to determine if there is a statistically significant difference between them. However, your data is not normally distributed. Which statistical test is most appropriate to use?
Options:
Options:
Question 25.
Which of the following techniques is most effective in reducing variance when used in ensemble methods?
Options:
- A) Boosting
- B) Bagging
- C) Stacking
- D) Regularization
Options:
Which Data Science skills should you evaluate during the interview phase?
Assessing a candidate's data science skills in a single interview is challenging, but focusing on core competencies is key. By targeting specific skills, you can gain valuable insights into their abilities and potential fit within your team. Here are some skills that should be evaluated during the interview phase.
Python Programming
You can quickly gauge a candidate's Python proficiency using an online assessment. Adaface's Python test offers a range of questions to filter candidates effectively.
To further assess their Python skills, try asking a targeted interview question.
Write a Python function to calculate the average of a list of numbers, handling potential errors gracefully.
Look for their ability to write clean, readable code. They should also demonstrate an understanding of error handling using try-except blocks.
Statistics
Assess their statistical acumen with an assessment test. Adaface's Data Science test includes questions on statistical concepts to help you identify strong candidates.
Here's a question to delve deeper into their statistical understanding:
Explain the difference between Type I and Type II errors in hypothesis testing. Give an example of when each type of error might be more problematic.
The candidate should clearly articulate the difference between false positives and false negatives. Also, they should be able to provide realistic examples demonstrating their practical understanding.
Machine Learning Algorithms
Use an assessment test that covers machine learning algorithms. Adaface's Machine Learning test can help you screen candidates with relevant MCQs.
Ask a question that tests their understanding of machine learning concepts.
Describe the bias-variance tradeoff in machine learning. How does it affect model performance, and what strategies can be used to address it?
The candidate should explain the inverse relationship between bias and variance. Also, they should be able to discuss techniques like regularization and cross-validation.
Streamline Data Science Hiring with Skills Tests and Targeted Interviews
Hiring data scientists requires accurately assessing their technical skills. Ensure candidates possess the necessary abilities to excel in the role.
Skills tests are the most straightforward method to evaluate these abilities. Explore Adaface's library of assessments, including our Data Science Test and Machine Learning Online Test.
Use these tests to identify top candidates and focus your interview efforts. Shortlisting based on verified skills saves time and improves hiring outcomes.
Ready to find your next data science expert? Sign up for a free trial of the Adaface platform here.
Data Science Assessment Test
35 mins | 18 MCQs
The data science assessment test evaluates a candidate's proficiency in statistics, probability, linear & non-linear regression models and their ability to analyze data and leverage Python/ R to extract insights from the data.
Try Data Science Assessment Test
Download Data Science interview questions template in multiple formats
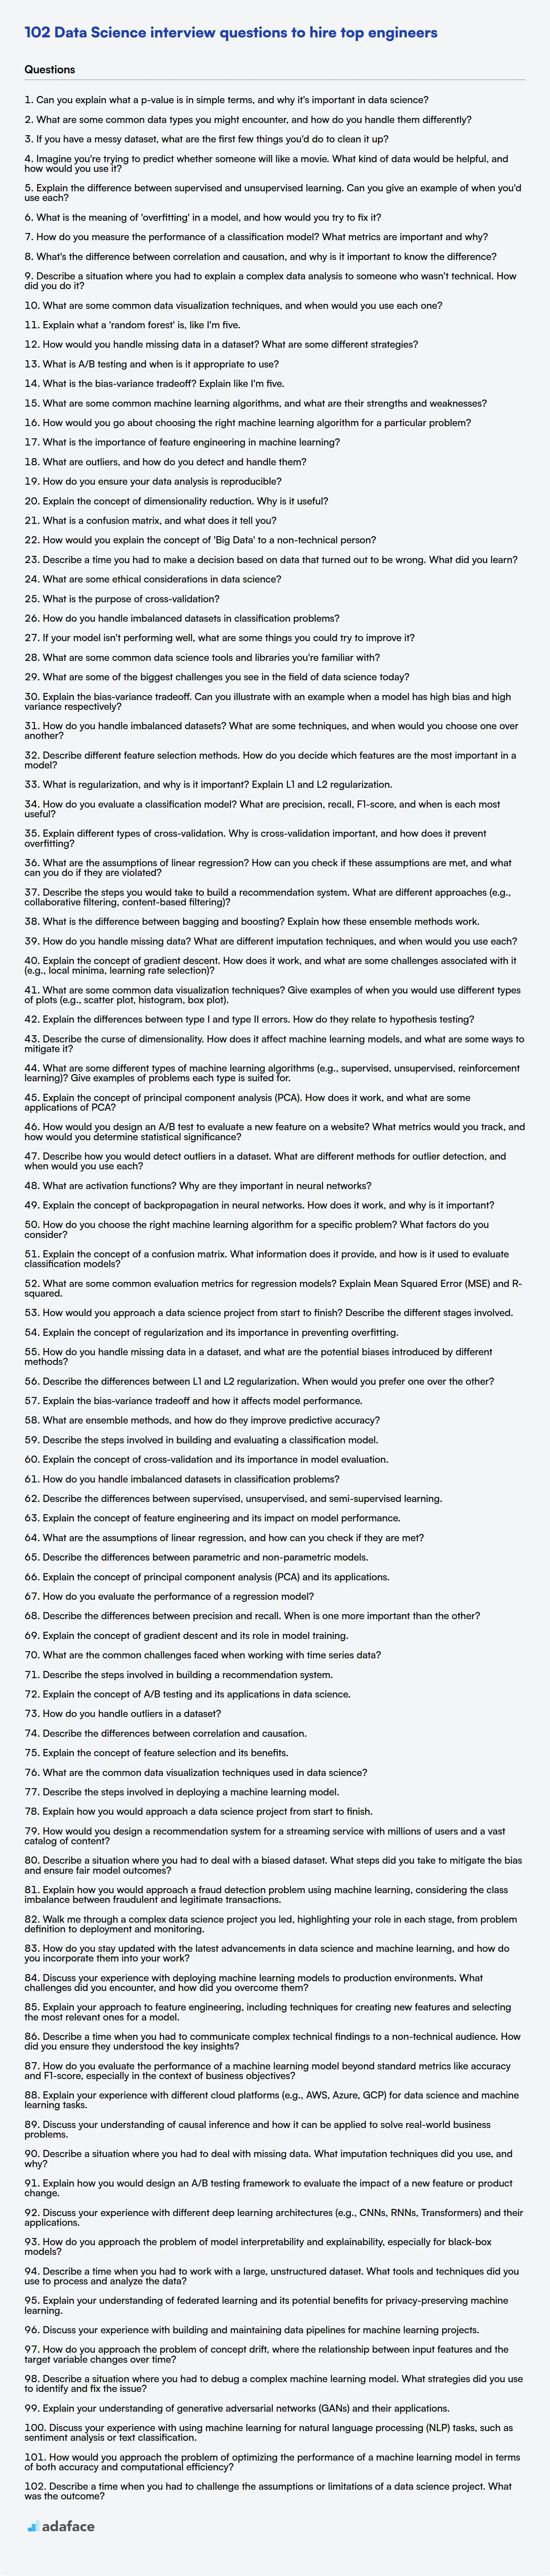
Data Science Interview Questions FAQs
What are some basic Data Science interview questions?
Basic Data Science interview questions often cover foundational concepts like statistics, probability, and basic machine learning algorithms. These questions assess a candidate's understanding of core principles.
What are some intermediate Data Science interview questions?
Intermediate Data Science interview questions typically explore more complex topics such as feature engineering, model selection, and evaluation metrics. They gauge a candidate's ability to apply their knowledge to real-world problems.
What are some Data Science interview questions for experienced candidates?
Interview questions for experienced Data Science candidates focus on their project experience, their ability to handle complex datasets, and their understanding of advanced machine learning techniques. They assess a candidate's ability to lead and innovate.
How can skills tests streamline Data Science hiring?
Skills tests can streamline Data Science hiring by objectively assessing candidates' abilities in specific areas. They provide a data-driven way to identify top talent and reduce the time spent on interviewing unqualified candidates.
How to prepare for Data Science Interview?
For preparation, build a strong base, practice on datasets, do mock interviews. Try to highlight projects that show your analytical and problem-solving skills to the interviewer.
40 min skill tests.
No trick questions.
Accurate shortlisting.
We make it easy for you to find the best candidates in your pipeline with a 40 min skills test.
Try for freeRelated posts
Free resources

Join 1200+ companies in 80+ countries.
Try the most candidate friendly skills assessment tool today.

40 min tests.
No trick questions.
Accurate shortlisting.
No trick questions.
Accurate shortlisting.