Search test library by skills or roles
⌘ K

BI Developer Test

The Business Intelligence Developer test uses scenario-based multiple-choice questions to evaluate a candidate's knowledge and skills related to data modeling and ETL processes, data warehousing and data mining, BI reporting and visualization, data analysis and predictive modeling, and BI project management. Candidates are also be evaluated on their ability to use BI tools and technologies such as SQL Server, Power BI, Tableau, and other related tools, and their proficiency in applying data analysis and business intelligence techniques to solve complex business problems.

Get started for free
Preview questions

Screen candidates with a 60 mins test

Test duration:  60 mins
Difficulty level:  Moderate
Availability:  Ready to use
Questions:
  • 5 Power BI MCQs
  • 5 Tableau MCQs
  • 4 R MCQs
  • 5 Python MCQs
  • 5 SQL MCQs
  • 1 Python Coding Question
Covered skills:
Connecting to data sources in Power BI
Data wrangling and transformations in Power BI
DAX formulas
Connecting with data from multiple sources
Creating dashboards and actions in Tableau
Managing Tableau worksheets and workbooks
Filtering and analyzing Tableau data
Vectors and Dataframes in R
String Manipulation in R
Analytics with R
Python Syntax
Python OOPs
SQL CRUD Operations
SQL Joins and Indexes
Python Programming
Get started for free
Preview questions

Use Adaface tests trusted by recruitment teams globally

Adaface is used by 1200+ businesses in 80 countries.

Adaface skill assessments measure on-the-job skills of candidates, providing employers with an accurate tool for screening potential hires.

Amazon Morgan Stanley Vodafone United Nations HCL PayPal Bosch WeWork Optimum Solutions Deloitte NCS Sokrati J&T Express Capegemini

Use the BI Developer Assessment Test to shortlist qualified candidates

The BI Developer Test helps recruiters and hiring managers identify qualified candidates from a pool of resumes, and helps in taking objective hiring decisions. It reduces the administrative overhead of interviewing too many candidates and saves time by filtering out unqualified candidates at the first step of the hiring process.

The test screens for the following skills that hiring managers look for in candidates:

  • Connecting to data sources in Power BI
  • Performing data wrangling and transformations in Power BI
  • Utilizing DAX formulas in Power BI
  • Connecting with data from multiple sources
  • Creating interactive dashboards and actions in Tableau
  • Managing Tableau worksheets and workbooks
  • Filtering and analyzing data in Tableau
  • Working with vectors and dataframes in R
  • Manipulating strings in R
  • Performing analytics with R
  • Understanding Python syntax
  • Implementing Python OOPs concepts
  • Executing SQL CRUD operations
  • Mastering SQL joins and indexes
  • Demonstrating proficiency in Python programming
Get started for free
Preview questions

Screen candidates with the highest quality questions

We have a very high focus on the quality of questions that test for on-the-job skills. Every question is non-googleable and we have a very high bar for the level of subject matter experts we onboard to create these questions. We have crawlers to check if any of the questions are leaked online. If/ when a question gets leaked, we get an alert. We change the question for you & let you know.

How we design questions

These are just a small sample from our library of 15,000+ questions. The actual questions on this BI Developer Test will be non-googleable.

🧐 Question

Medium

Data Filtering
Report Development
M Language
Data Visualization
Solve
You are creating a Power BI report where users need to dynamically filter data based on a range of dates. The report has a Sales table with columns Date, ProductID, and Amount. You decide to use a Power Query parameter to allow users to select a start and end date, which will then filter the Sales table accordingly. The parameter is named DateRange and has a type of List. You need to write a Power Query M formula to filter the Sales table based on the selected date range. The DateRange parameter contains two dates: the first item is the start date, and the second item is the end date. How should the M formula be structured to achieve this functionality?
A: Table.SelectRows(Sales, each [Date] >= DateRange{0} and [Date] <= DateRange{1})

B: Sales{[Date] >= DateRange{0}, [Date] <= DateRange{1}}

C: Table.FilterRows(Sales, each [Date] >= List.First(DateRange) and [Date] <= List.Last(DateRange))

D: Table.SelectRows(Sales, each [Date] >= List.First(DateRange) and [Date] <= List.Last(DateRange))

E: Filter.Table(Sales, [Date] >= DateRange{0}, [Date] <= DateRange{1})

Medium

Many-to-one error
Data Modeling
Solve
Consider the following two tables in Power BI:
 image
We received the following error when we tried to set many-to-one cardinality between devices to users tables: “The cardinality you selected isn’t valid for this relationship”. What should we do before creating the many-to-one relationship?

Medium

Power Query Functions
Power Query
Solve
Review the following Microsoft SQL Server table:
 image
Complete the following Power Query formula used to create a custom column to replace the numbers present in last 11 characters of ISBN with 11 ‘*’. Example ‘978-0-365-51051-4’ is converted to ‘978-0-***-*****-*’
 image
A: Text.Insert
B: Text.Replace
C: Text.Start
D: Text.End

Medium

Calculated Properties
Data Analysis
Solve
Here’s sample data imported into Tableau:
 image
Assume only three rows of data is present in the source. Once the data is imported, we added to new calculated fields:

Measure 1 with the formula: SUM([Profit])/SUM([Sales])
Measure 2 with the formula: SUM([Profit]/[Sales])

If we dragged Profit, Sales, Measure 1 and Measure 2 in the viewer as shown here:
 image
Pick the correct statements regarding columns Measure 1, Measure 2 and the row Grand total:
A: Values of Measure 1 would be 0.08, 0.075 and 0.1
B: Values of Measure 2 would be 0.08, 0.075 and 0.1
C: Values of Measure 1 would be 0.08, 0.769 and 0.08
D: Values of Measure 2 would be 0.08, 0.769 and 0.08
E: Values of Measure 1 would be 0.08, 0.155 and 0.255
F: Values of Measure 2 would be 0.08, 0.155 and 0.255
G: Grand total of Measure 1 would be 0.08
H: Grand total of Measure 2 would be 0.08
I: Grand total of Measure 1 would be 0.255
J: Grand total of Measure 2 would be 0.255

Medium

Change display icon
Solve
What steps would you take to change the following view so that Office Supplies is represented by a different symbol?
 image
A: Click on shapes in the marks area. Then select Office Supplies and the icon of choice and click okay.
B: Right-click on product category, select default properties, and select shape. Then select Office Supplies and the icon of choice and click okay.
C: Right click on the square and select "change shape" from the popup menu. Select the icon of choice and click okay.
D: A, B or C
E: None of these would work

Easy

Pie Chart
Data Analysis
Charts
Solve
We have the following dataset in Tableau:
 image
Which of the following Marks settings will result in following Pie chart?
 image
A: Drag Name to Color
B: Drag Share to Color
C: Drag Name to Label
D: Drag Share to Label
E: Drag Name to Angle
F: Drag Share to Angle
G: Drag Name to Detail

Medium

Applying Functions
Data frames
Functions
Math
Solve
Consider the following R code:
 image
This script defines a function apply_fun that calculates the mean of a vector and adds it to the standard deviation of the vector. The apply function is then used to apply this function to each column of the data frame df. What will be the value of result after the script is run?

Medium

Dataframe Transform
Solve
Review the following Dataframe 'bazinga':
 image
Which of the following commands would turn it into the Dataframe shown below:
 image
 image

Medium

Matrix Manipulation
Matrices
Lists
Solve
Consider the following pseudo code:
 image
What will be the state of list_of_matrices after running the script?
 image

Medium

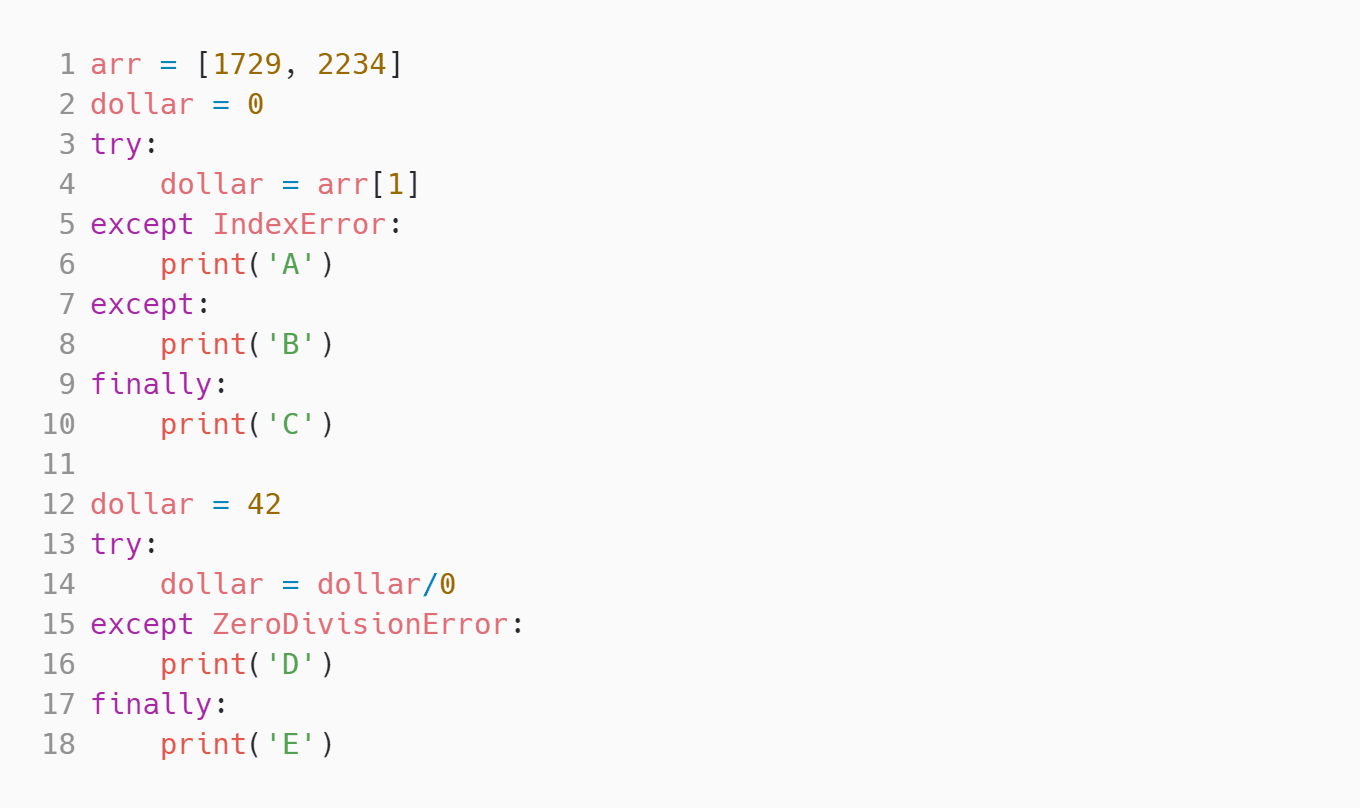
ZeroDivisionError and IndexError
Exceptions
Solve
What will the following Python code output?
 image

Medium

Session
File Handling
Dictionary
Solve
 image
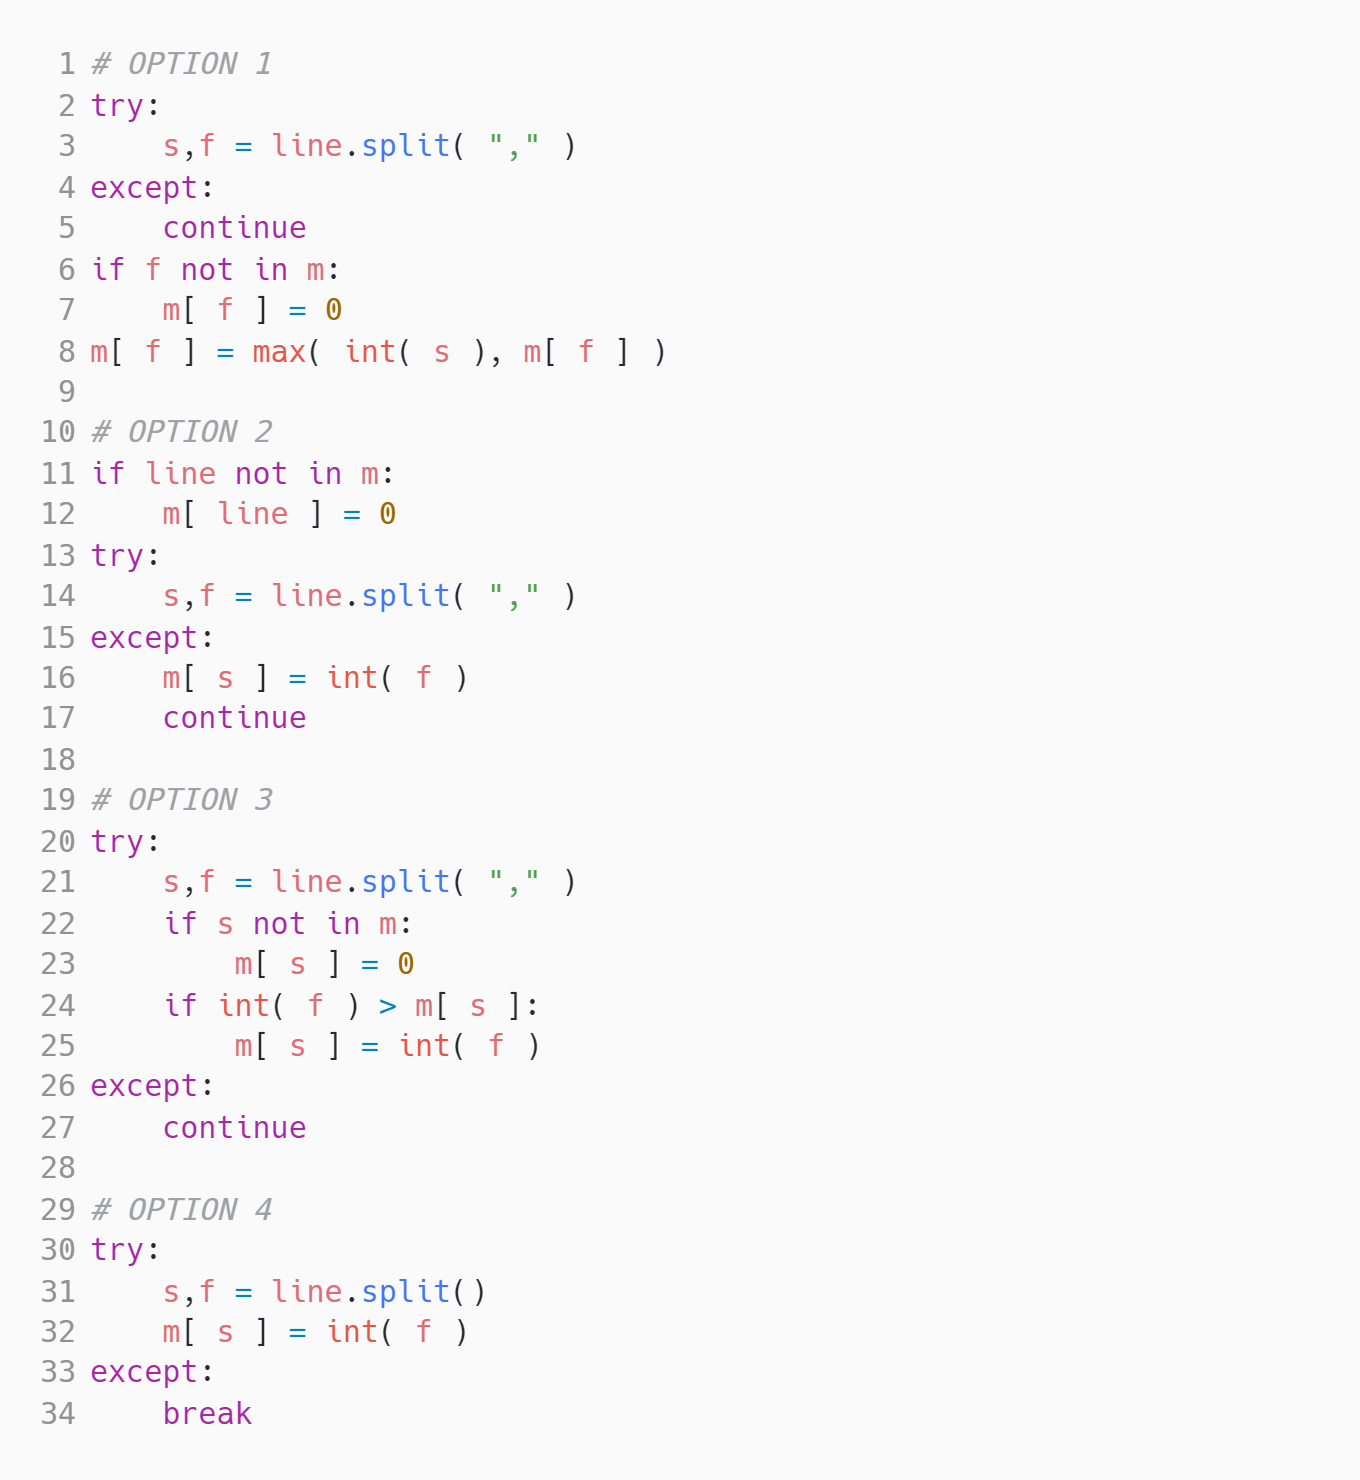
The function high_sess should compute the highest number of events per session of each user in the database by reading a comma-separated value input file of session data. The result should be returned from the function as a dictionary. The first column of each line in the input file is expected to contain the user’s name represented as a string. The second column is expected to contain an integer representing the events in a session. Here is an example input file:
Tony,10
Stark,12
Black,25
Your program should ignore a non-conforming line like this one.
Stark,3
Widow,6
Widow,14
The resulting return value for this file should be the following dictionary: { 'Stark':12, 'Black':25, 'Tony':10, 'Widow':14 }
What should replace the CODE TO FILL line to complete the function?
 image

Medium

Max Code
Arrays
Solve
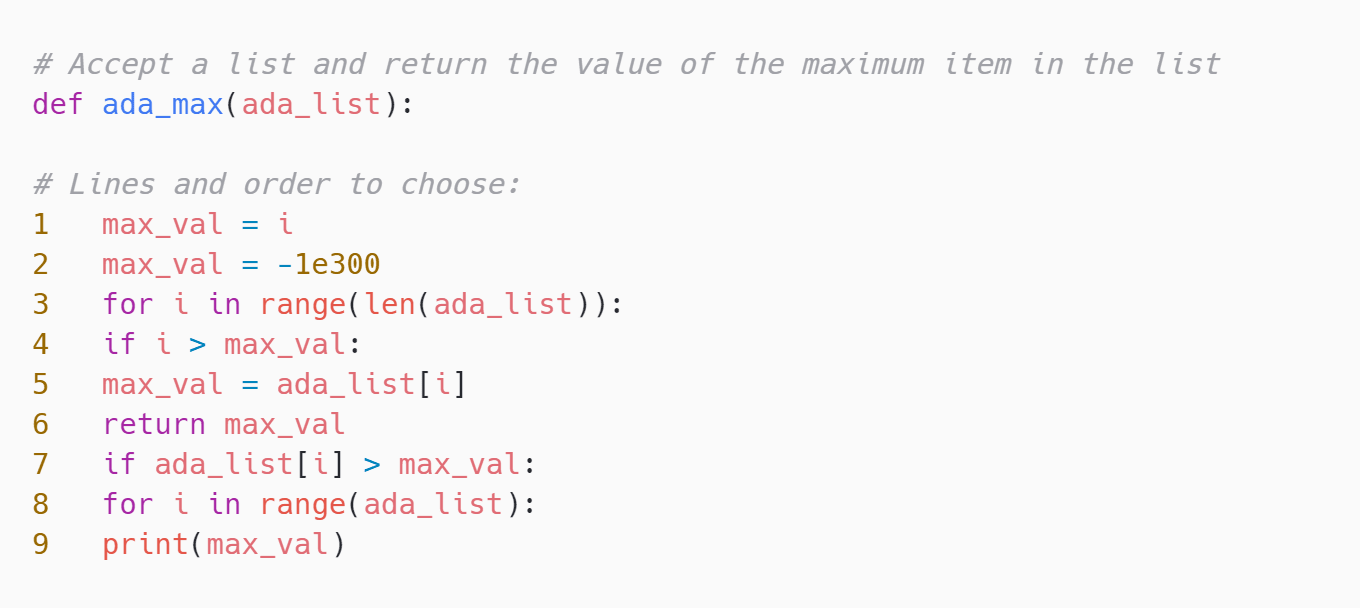
Below are code lines to create a Python function. Ignoring indentation, what lines should be used and in what order for the following function to be complete:
 image

Medium

Recursive Function
Recursion
Dictionary
Lists
Solve
Consider the following Python code:
 image
In the above code, recursive_search is a function that takes a dictionary (data) and a target key (target) as arguments. It searches for the target key within the dictionary, which could potentially have nested dictionaries and lists as values, and returns the value associated with the target key. If the target key is not found, it returns None.

nested_dict is a dictionary that contains multiple levels of nested dictionaries and lists. The recursive_search function is then called with nested_dict as the data and 'target_key' as the target.

What will the output be after executing the above code?

Medium

Stacking problem
Stack
Linkedlist
Solve
What does the below function ‘fun’ does?
 image
A: Sum of digits of the number passed to fun.
B: Number of digits of the number passed to fun.
C: 0 if the number passed to fun is divisible by 10. 1 otherwise.
D: Sum of all digits number passed to fun except for the last digit.

Medium

Multi Select
JOIN
GROUP BY
Solve
Consider the following SQL table:
 image
How many rows does the following SQL query return?
 image

Medium

nth highest sales
Nested queries
User Defined Functions
Solve
Consider the following SQL table:
 image
Which of the following SQL commands will find the ‘nth highest Sales’ if it exists (returns null otherwise)?
 image

Medium

Select & IN
Nested queries
Solve
Consider the following SQL table:
 image
Which of the following SQL queries would return the year when neither a football or cricket winner was chosen?
 image

Medium

Sorting Ubers
Nested queries
Join
Comparison operators
Solve
Consider the following SQL table:
 image
What will be the first two tuples resulting from the following SQL command?
 image

Hard

With, AVG & SUM
MAX() MIN()
Aggregate functions
Solve
Consider the following SQL table:
 image
How many tuples does the following query return?
 image

Easy

Registration Queue
Logic
Queues
Solve
We want to register students for the next semester. All students have a receipt which shows the amount pending for the previous semester. A positive amount (or zero) represents that the student has paid extra fees, and a negative amount represents that they have pending fees to be paid. The students are in a queue for the registration. We want to arrange the students in a way such that the students who have a positive amount on the receipt get registered first as compared to the students who have a negative amount. We are given a queue in the form of an array containing the pending amount.
For example, if the initial queue is [20, 70, -40, 30, -10], then the final queue will be [20, 70, 30, -40, -10]. Note that the sequence of students should not be changed while arranging them unless required to meet the condition.
⚠️⚠️⚠️ Note:
- The first line of the input is the length of the array. The second line contains all the elements of the array.
- The input is already parsed into an array of "strings" and passed to a function. You will need to convert string to integer/number type inside the function.
- You need to "print" the final result (not return it) to pass the test cases.

For the example discussed above, the input will be:
5
20 70 -40 30 -10

Your code needs to print the following to the standard output:
20 70 30 -40 -10

Medium

Visitors Count
Strings
Logic
Solve
A manager hires a staff member to keep a record of the number of men, women, and children visiting the museum daily. The staff will note W if any women visit, M for men, and C for children. You need to write code that takes the string that represents the visits and prints the count of men, woman and children. The sequencing should be in decreasing order. 
Example:

Input:
WWMMWWCCC

Expected Output: 
4W3C2M

Explanation: 
‘W’ has the highest count, then ‘C’, then ‘M’. 
⚠️⚠️⚠️ Note:
- The input is already parsed and passed to a function.
- You need to "print" the final result (not return it) to pass the test cases.
- If the input is- “MMW”, then the expected output is "2M1W" since there is no ‘C’.
- If any of them have the same count, the output should follow this order - M, W, C.
🧐 Question🔧 Skill

Medium

Data Filtering
Report Development
M Language
Data Visualization

2 mins

Power BI
Solve

Medium

Many-to-one error
Data Modeling

2 mins

Power BI
Solve

Medium

Power Query Functions
Power Query

2 mins

Power BI
Solve

Medium

Calculated Properties
Data Analysis

3 mins

Tableau
Solve

Medium

Change display icon

2 mins

Tableau
Solve

Easy

Pie Chart
Data Analysis
Charts

3 mins

Tableau
Solve

Medium

Applying Functions
Data frames
Functions
Math

3 mins

R
Solve

Medium

Dataframe Transform

3 mins

R
Solve

Medium

Matrix Manipulation
Matrices
Lists

3 mins

R
Solve

Medium

ZeroDivisionError and IndexError
Exceptions

2 mins

Python
Solve

Medium

Session
File Handling
Dictionary

2 mins

Python
Solve

Medium

Max Code
Arrays

2 mins

Python
Solve

Medium

Recursive Function
Recursion
Dictionary
Lists

3 mins

Python
Solve

Medium

Stacking problem
Stack
Linkedlist

4 mins

Python
Solve

Medium

Multi Select
JOIN
GROUP BY

2 mins

SQL
Solve

Medium

nth highest sales
Nested queries
User Defined Functions

3 mins

SQL
Solve

Medium

Select & IN
Nested queries

3 mins

SQL
Solve

Medium

Sorting Ubers
Nested queries
Join
Comparison operators

3 mins

SQL
Solve

Hard

With, AVG & SUM
MAX() MIN()
Aggregate functions

2 mins

SQL
Solve

Easy

Registration Queue
Logic
Queues

30 mins

Coding
Solve

Medium

Visitors Count
Strings
Logic

30 mins

Coding
Solve
🧐 Question🔧 Skill💪 Difficulty⌛ Time
Data Filtering
Report Development
M Language
Data Visualization
Power BI
Medium2 mins
Solve
Many-to-one error
Data Modeling
Power BI
Medium2 mins
Solve
Power Query Functions
Power Query
Power BI
Medium2 mins
Solve
Calculated Properties
Data Analysis
Tableau
Medium3 mins
Solve
Change display icon
Tableau
Medium2 mins
Solve
Pie Chart
Data Analysis
Charts
Tableau
Easy3 mins
Solve
Applying Functions
Data frames
Functions
Math
R
Medium3 mins
Solve
Dataframe Transform
R
Medium3 mins
Solve
Matrix Manipulation
Matrices
Lists
R
Medium3 mins
Solve
ZeroDivisionError and IndexError
Exceptions
Python
Medium2 mins
Solve
Session
File Handling
Dictionary
Python
Medium2 mins
Solve
Max Code
Arrays
Python
Medium2 mins
Solve
Recursive Function
Recursion
Dictionary
Lists
Python
Medium3 mins
Solve
Stacking problem
Stack
Linkedlist
Python
Medium4 mins
Solve
Multi Select
JOIN
GROUP BY
SQL
Medium2 mins
Solve
nth highest sales
Nested queries
User Defined Functions
SQL
Medium3 mins
Solve
Select & IN
Nested queries
SQL
Medium3 mins
Solve
Sorting Ubers
Nested queries
Join
Comparison operators
SQL
Medium3 mins
Solve
With, AVG & SUM
MAX() MIN()
Aggregate functions
SQL
Hard2 mins
Solve
Registration Queue
Logic
Queues
Coding
Easy30 minsSolve
Visitors Count
Strings
Logic
Coding
Medium30 minsSolve

Test candidates on core BI Developer Hiring Test topics

Connecting to data sources in Power BI: This skill involves connecting to various data sources such as databases, spreadsheets, or web services in Power BI. It allows users to import data from different sources and use them for creating visualizations and reports. This skill is important in the test as it assesses the candidate's ability to work with different data sources and integrate them into Power BI.

Data wrangling and transformations in Power BI: With this skill, candidates can clean and transform raw data to make it suitable for further analysis in Power BI. They can perform tasks like removing unnecessary columns, merging data, and creating calculated columns. This skill is crucial to ensure the accuracy and quality of the data used in Power BI reports and visualizations.

DAX formulas: DAX (Data Analysis Expressions) is a formula language used in Power BI for creating custom calculations and aggregations. This skill measures a candidate's proficiency in writing DAX formulas to perform calculations on data, create new measures, and build complex calculations. It is essential to evaluate this skill in the test to assess the candidate's ability to manipulate and analyze data effectively in Power BI.

Connecting with data from multiple sources: This skill evaluates a candidate's capability to connect and integrate data from multiple sources in one visualisation tool, such as Tableau. It measures the candidate's ability to combine and merge data from different databases or file formats and analyze them collectively. This skill is important to ensure the candidate can work with complex data scenarios and create comprehensive dashboards and reports in Tableau.

Creating dashboards and actions in Tableau: This skill assesses a candidate's proficiency in using Tableau to design interactive dashboards that allow users to explore data visually and perform actions like filtering, sorting, and drilling down. It evaluates the candidate's ability to present data in a compelling and user-friendly way, providing insightful visualizations and meaningful interactions.

Managing Tableau worksheets and workbooks: With this skill, candidates can effectively organize and manage visualizations in Tableau worksheets and workbooks. It measures the candidate's ability to arrange and format visualizations, create hierarchies, and manage data connections. This skill is important as it ensures the candidate can efficiently navigate and maintain Tableau projects, improving productivity and collaboration.

Filtering and analyzing Tableau data: This skill evaluates a candidate's ability to filter and analyze data in Tableau using various techniques such as applying filters, creating calculated fields, and performing aggregations. It assesses the candidate's capability to derive meaningful insights from data and present them through visualizations. This skill is important to gauge the candidate's analytical skills and their understanding of data exploration in Tableau.

Vectors and Dataframes in R: This skill involves working with vectors and data frames in R, which are fundamental data structures used to store and manipulate data. Vectors are one-dimensional arrays, while data frames are multidimensional structures that can hold different types of data. This skill is essential in the test as it measures a candidate's ability to perform data operations and analysis using these key data structures in R.

String Manipulation in R: This skill evaluates a candidate's capability to manipulate strings in R, such as extracting substrings, replacing characters, or splitting strings. String manipulation is important for data cleaning, text processing, and feature engineering tasks in R. This skill is assessed in the test to gauge the candidate's proficiency in handling and manipulating textual data using appropriate R functions and techniques.

Analytics with R: This skill measures a candidate's ability to apply statistical and analytical techniques using R. It assesses the candidate's knowledge of various R packages and functions for data analysis, regression, clustering, and visualization. Analytics with R is a significant skill to have in a BI developer, as it enables them to derive insights, build models, and make data-driven decisions using R.

Python Syntax: This skill evaluates a candidate's understanding of the syntax and structure of the Python programming language. It assesses their knowledge of variables, data types, control flow statements, loops, functions, and other core concepts of Python. Python Syntax is a fundamental skill to measure in the test as it forms the building blocks of writing Python code for data manipulation, analysis, and visualization tasks.

Python OOPs: This skill assesses a candidate's proficiency in object-oriented programming (OOP) using Python. It evaluates their knowledge and ability to define and use classes, objects, inheritance, polymorphism, and encapsulation. Python OOPs is an important skill to measure in the test as it demonstrates the candidate's understanding of the principles of OOP and their ability to write modular and reusable code in Python.

SQL CRUD Operations: This skill measures a candidate's proficiency in performing CRUD (Create, Read, Update, Delete) operations in SQL, which are fundamental database operations. It assesses their ability to insert, retrieve, update, and delete data from relational databases using SQL queries. SQL CRUD Operations is an essential skill to evaluate in the test as it demonstrates the candidate's ability to interact with databases and manipulate data using SQL.

SQL Joins and Indexes: This skill evaluates a candidate's knowledge and understanding of SQL joins, which are used to combine data from multiple tables based on common columns. It also assesses their proficiency in working with indexes, which improve the performance of SQL queries. SQL Joins and Indexes are important skills to measure in the test as they demonstrate the candidate's ability to retrieve and manipulate data from complex relational database structures.

Python Programming: This skill assesses a candidate's proficiency in programming with Python, covering topics such as data manipulation, analysis, visualization, and automation. It measures their ability to write Python code to solve business problems, handle data processing tasks, and build applications. Python Programming is a crucial skill to evaluate in the test as it showcases the candidate's ability to leverage Python's versatility and power in various aspects of BI development.

Get started for free
Preview questions

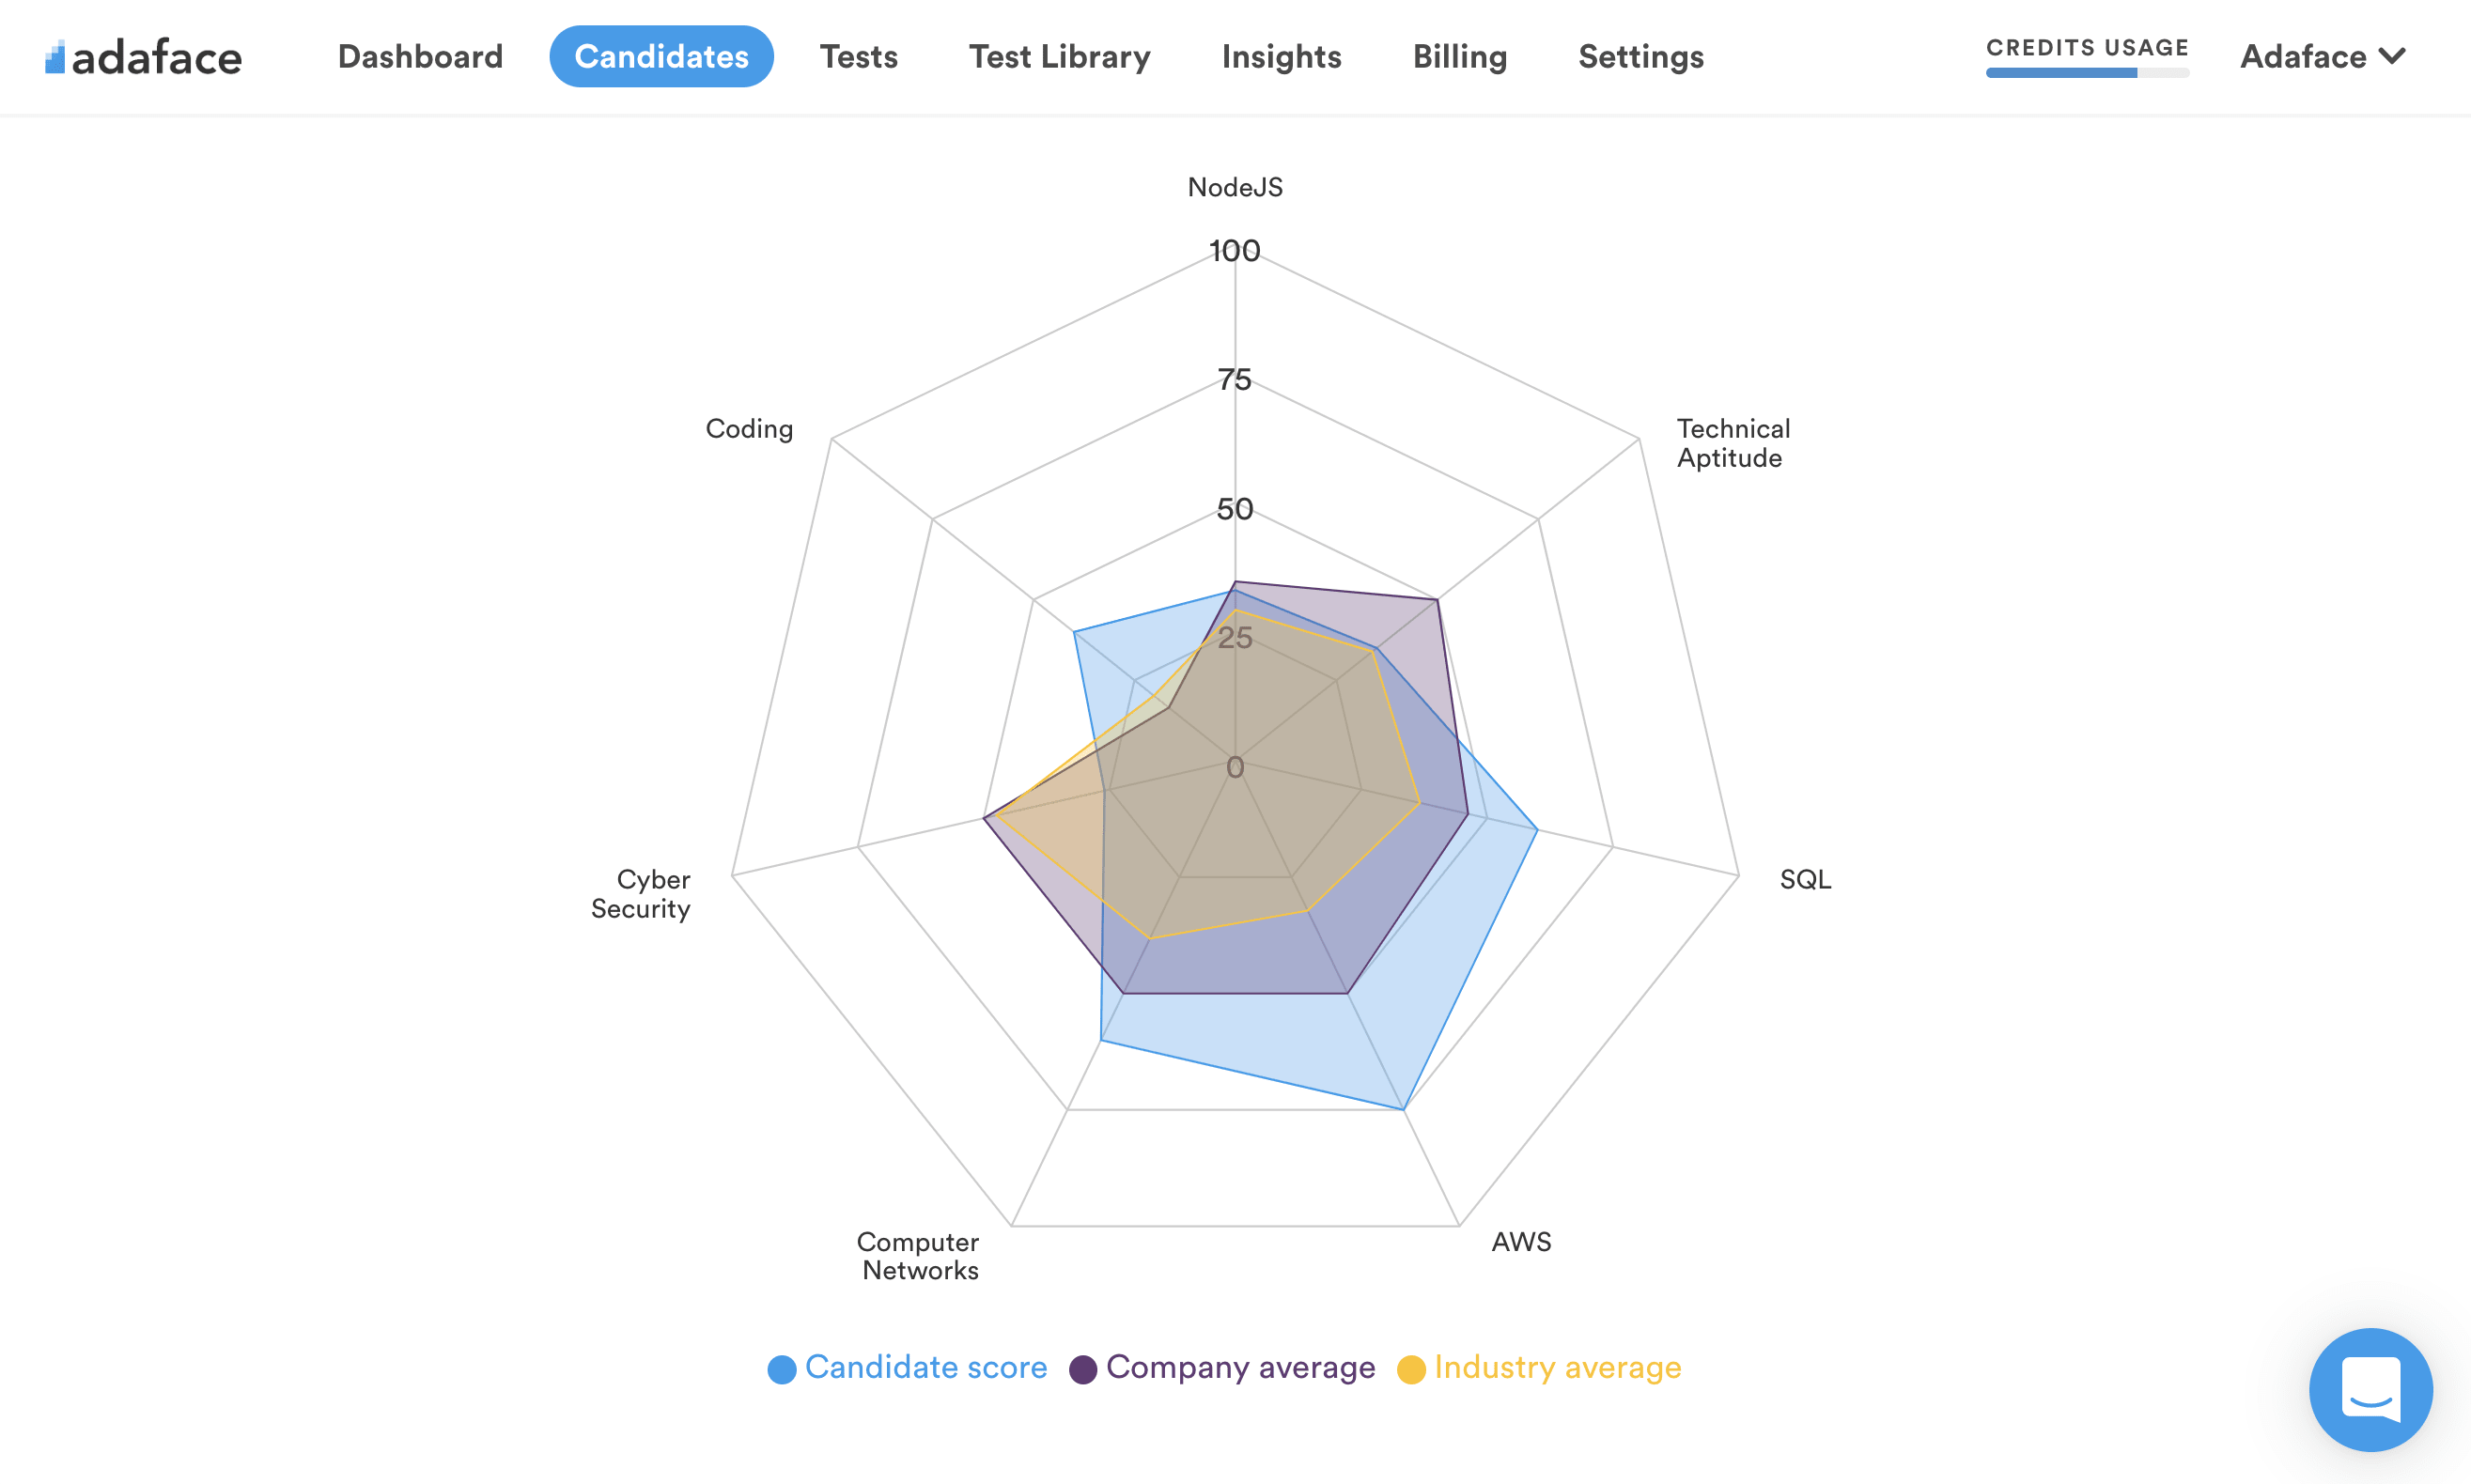
Make informed decisions with actionable reports and benchmarks

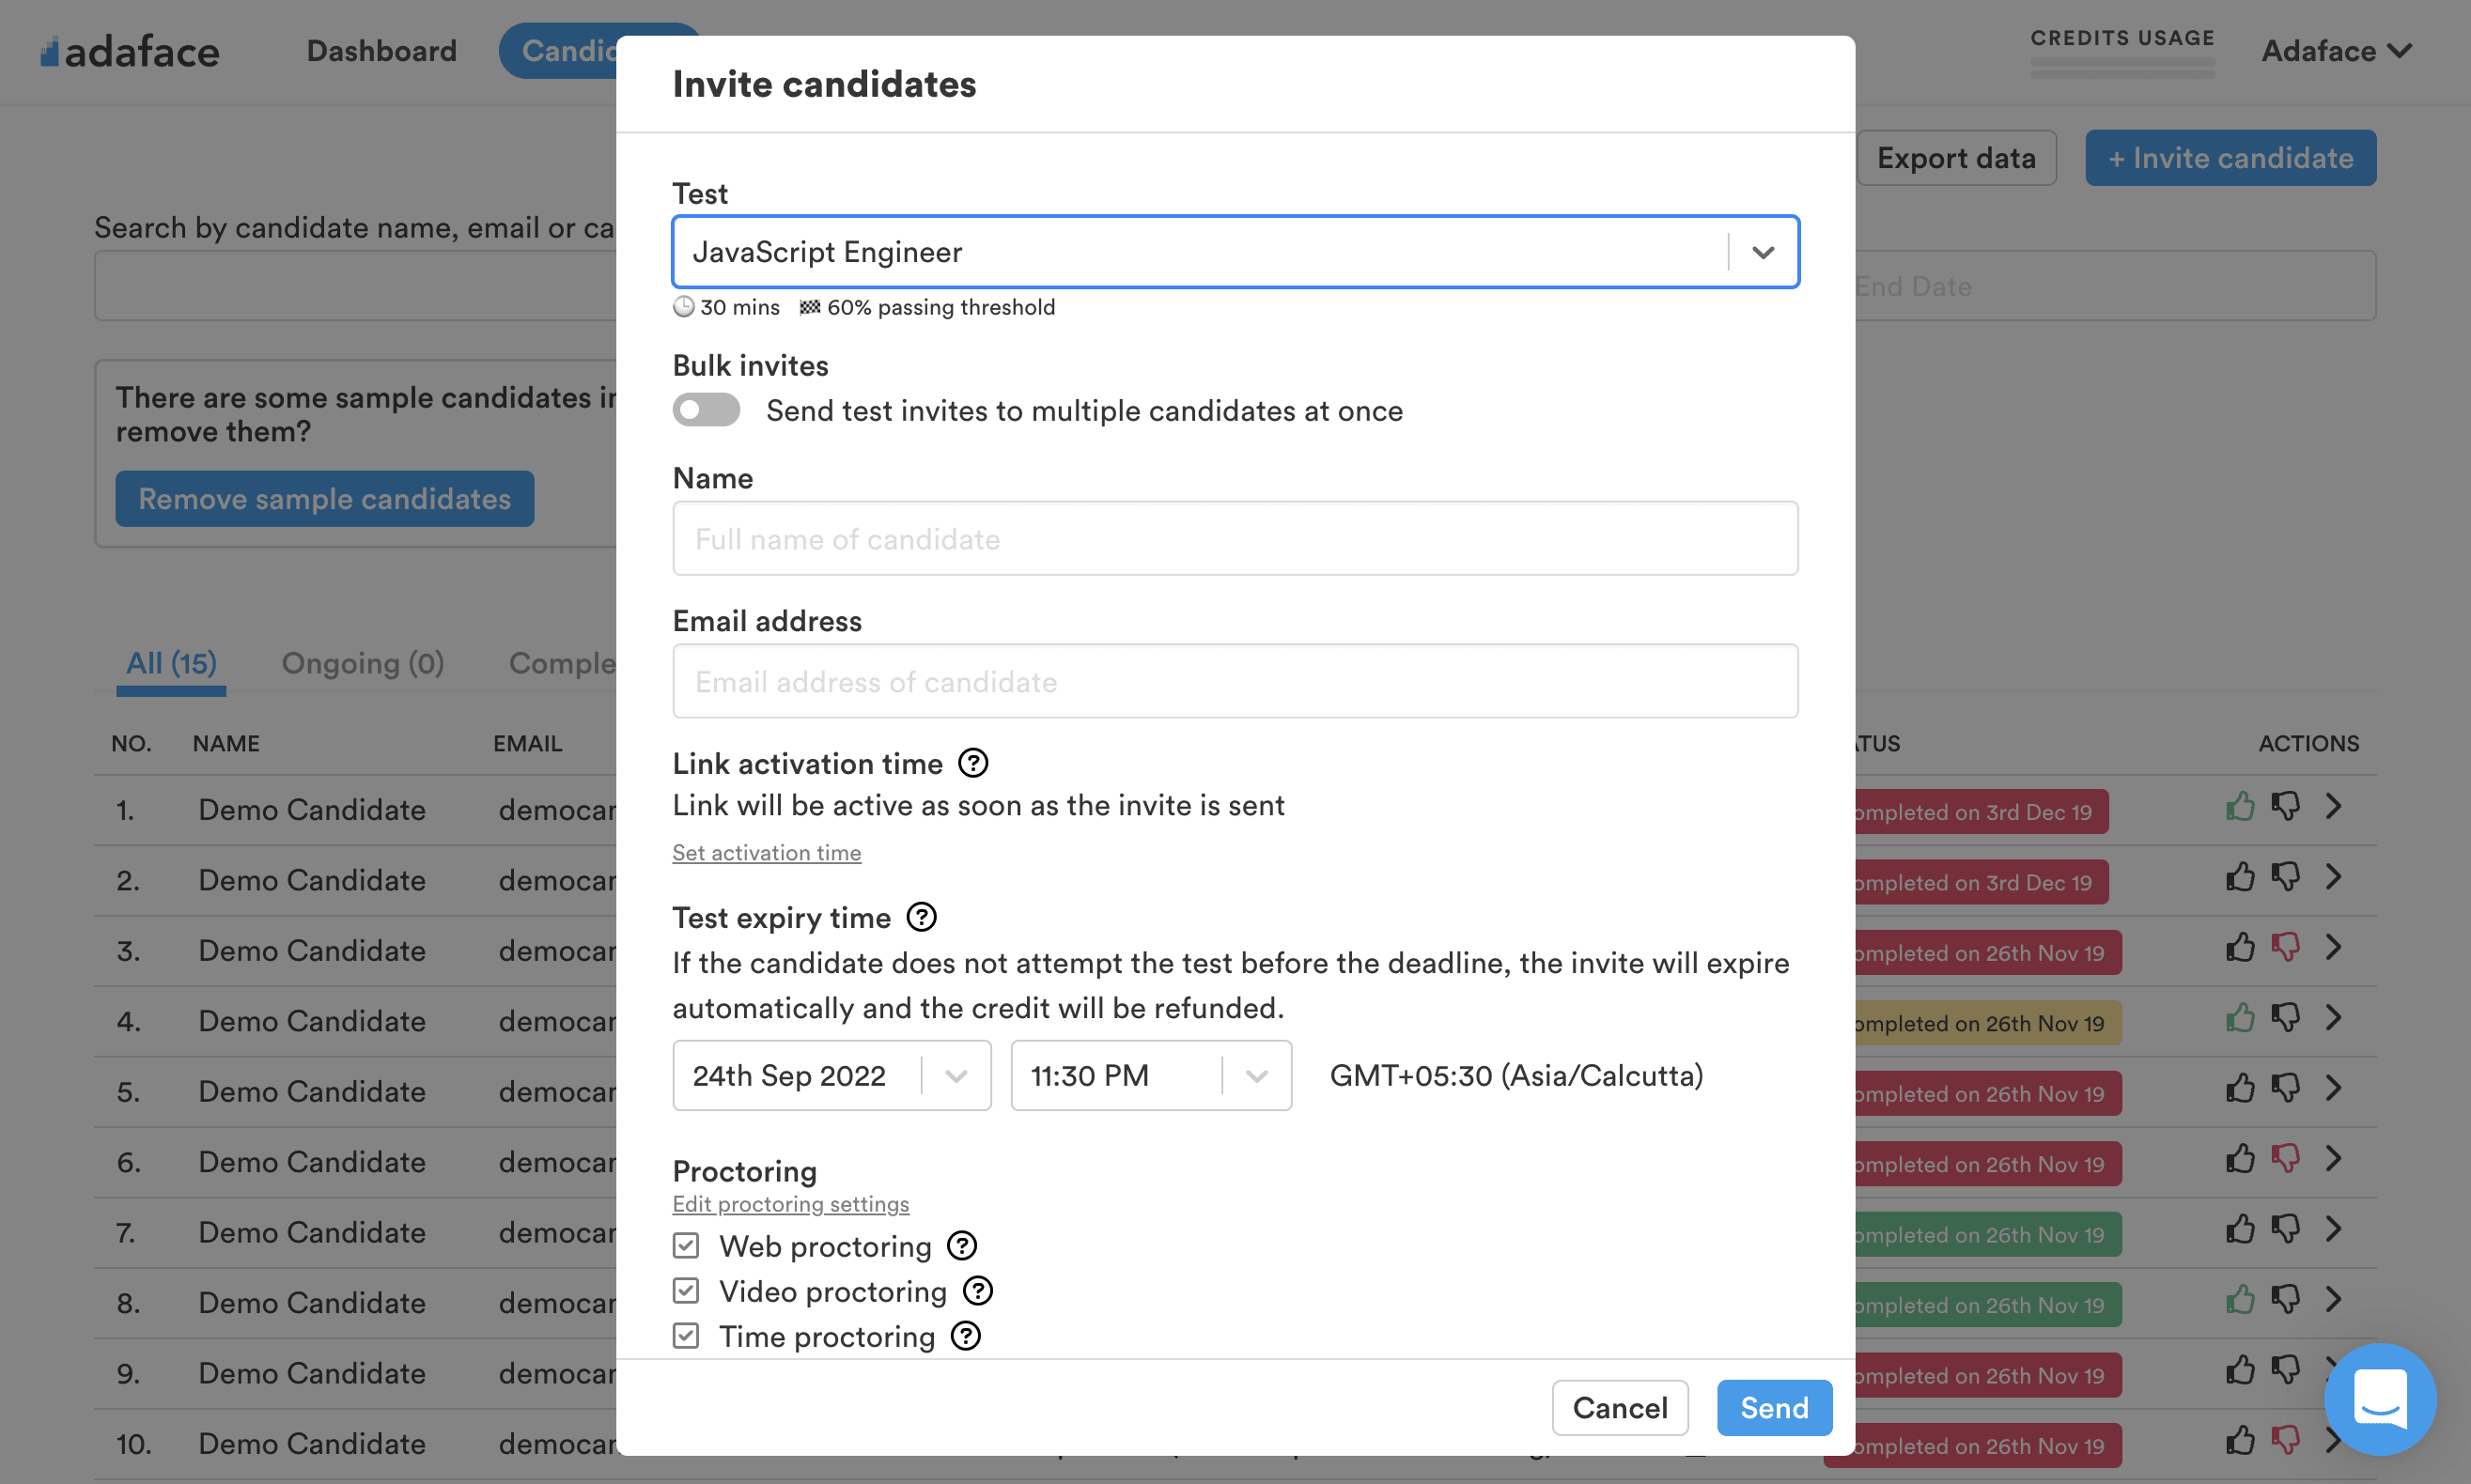
View sample scorecard

Screen candidates in 3 easy steps

Pick a test from over 500+ tests

The Adaface test library features 500+ tests to enable you to test candidates on all popular skills- everything from programming languages, software frameworks, devops, logical reasoning, abstract reasoning, critical thinking, fluid intelligence, content marketing, talent acquisition, customer service, accounting, product management, sales and more.

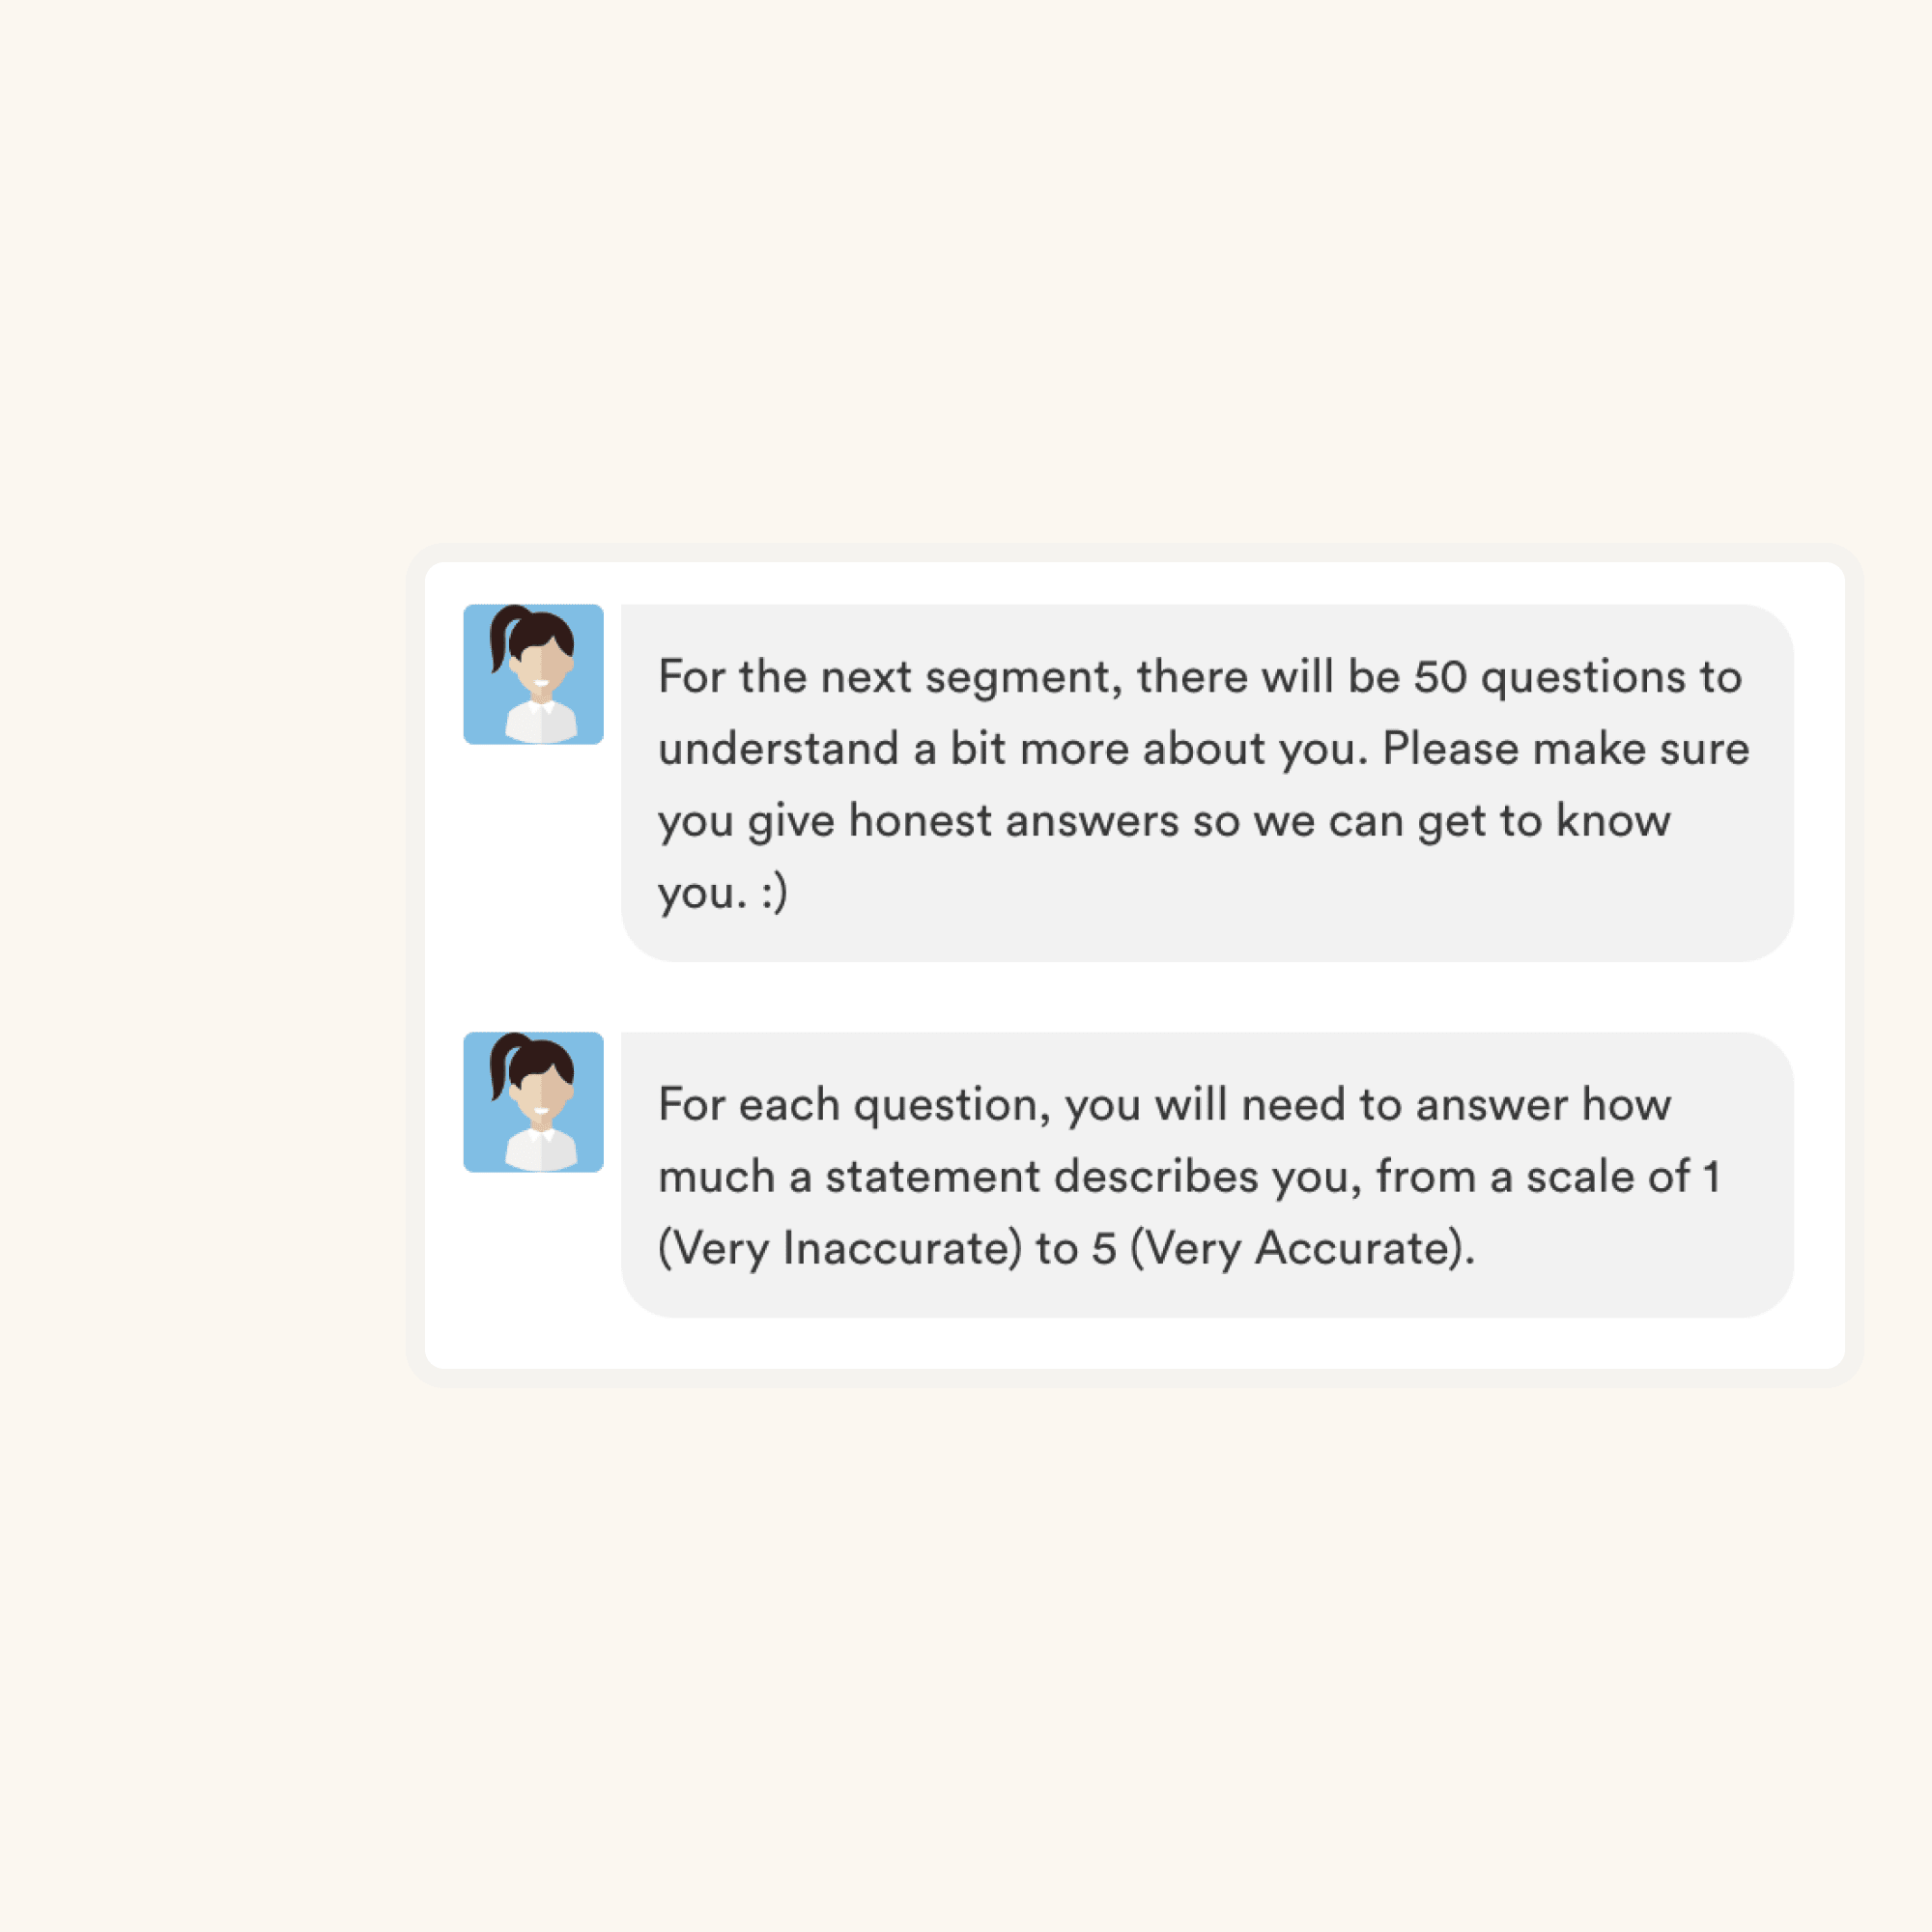
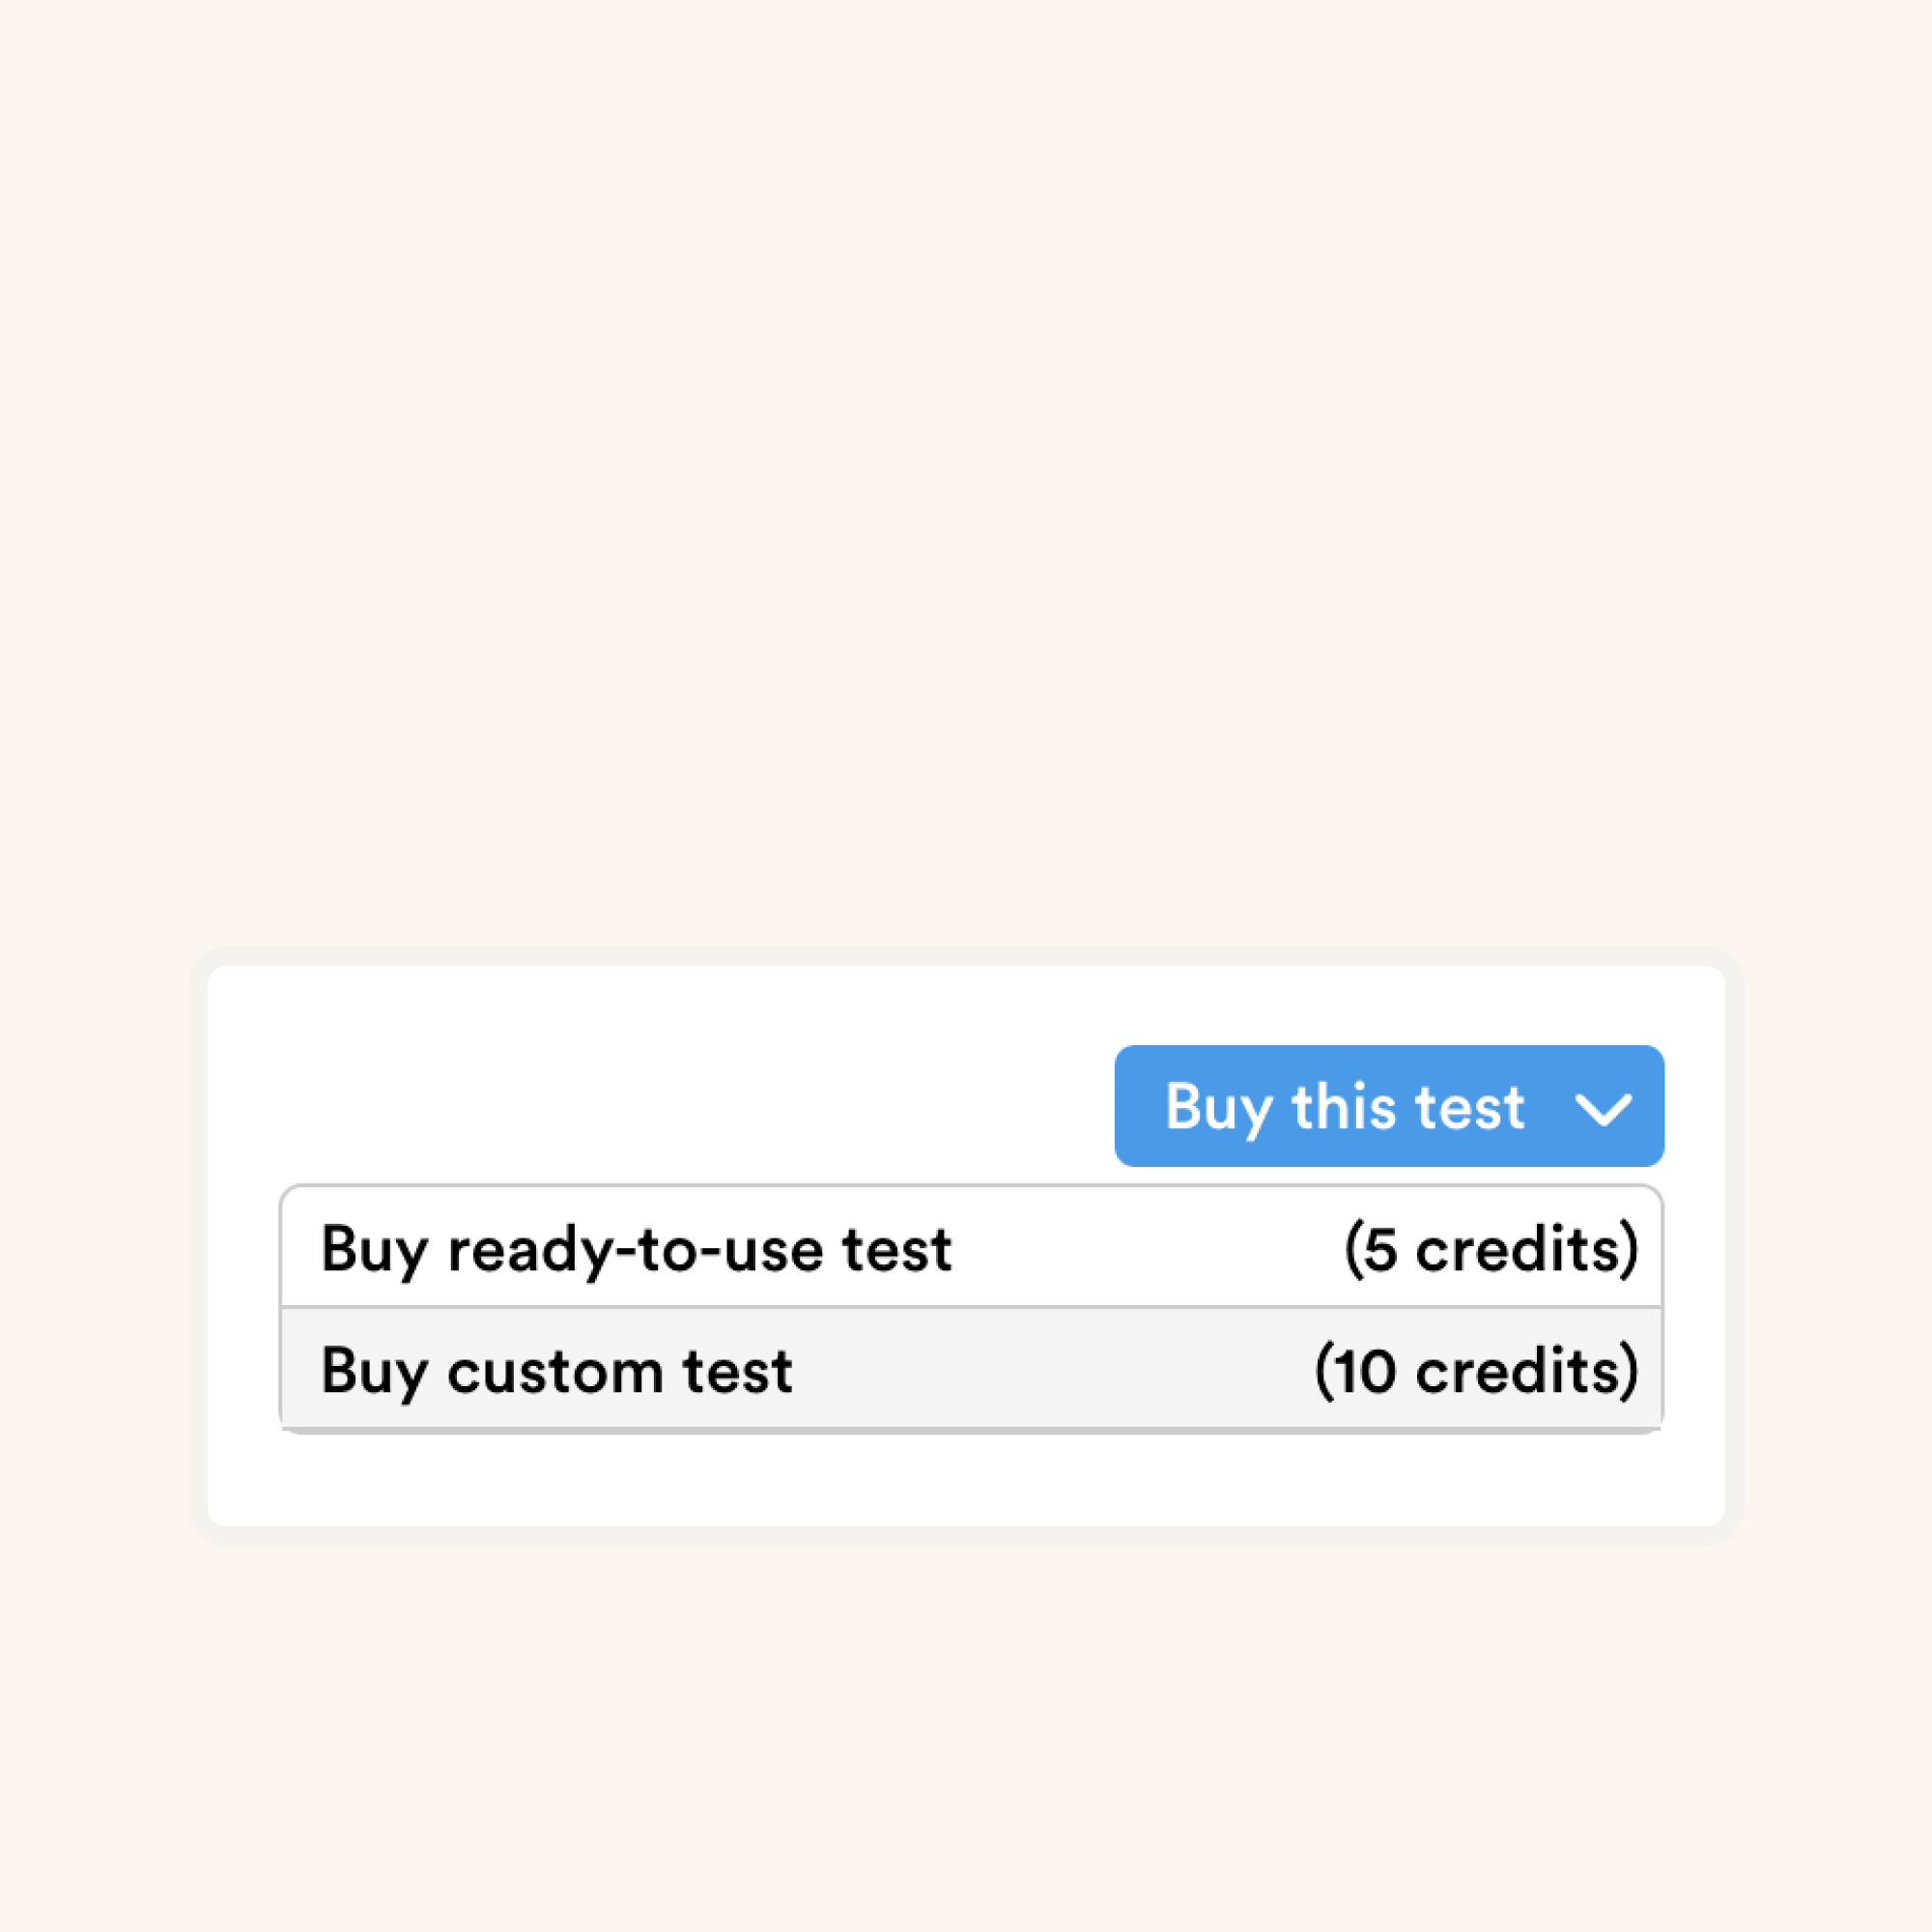
Invite your candidates with 2-clicks

Make informed hiring decisions

Get started for free
Preview questions

Try the most advanced candidate assessment platform

ChatGPT Protection

Non-googleable Questions

Web Proctoring

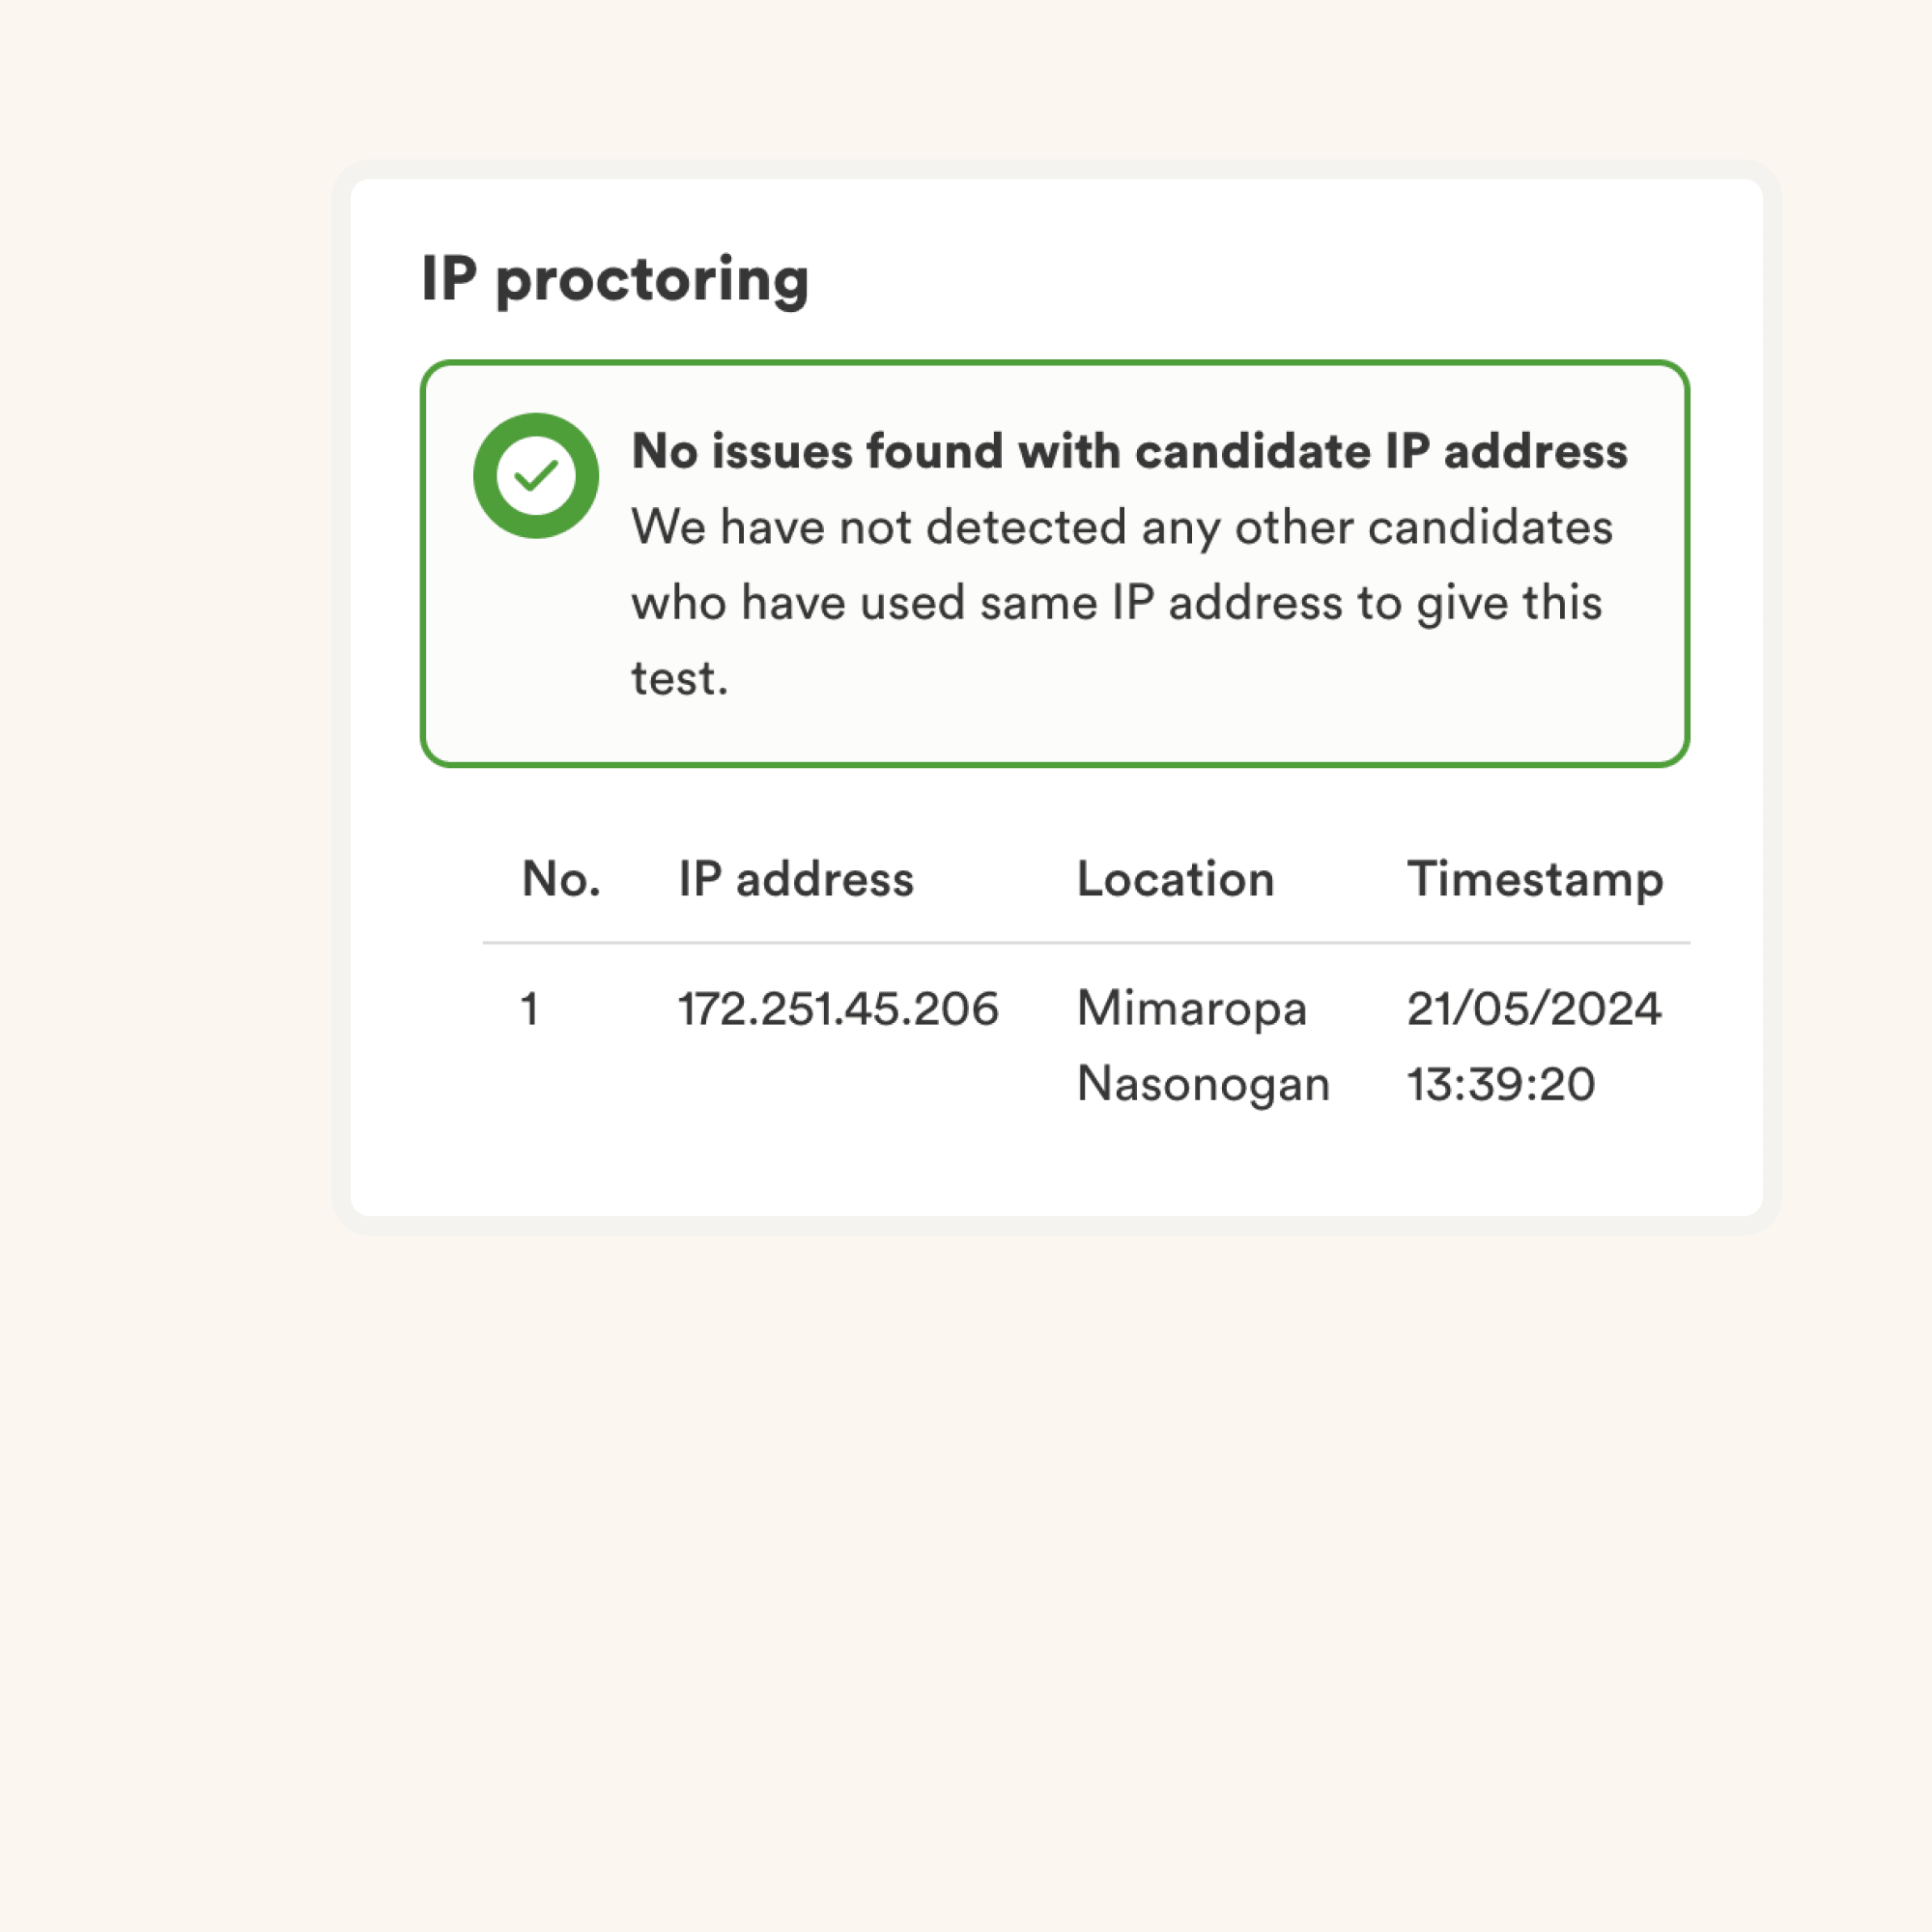
IP Proctoring

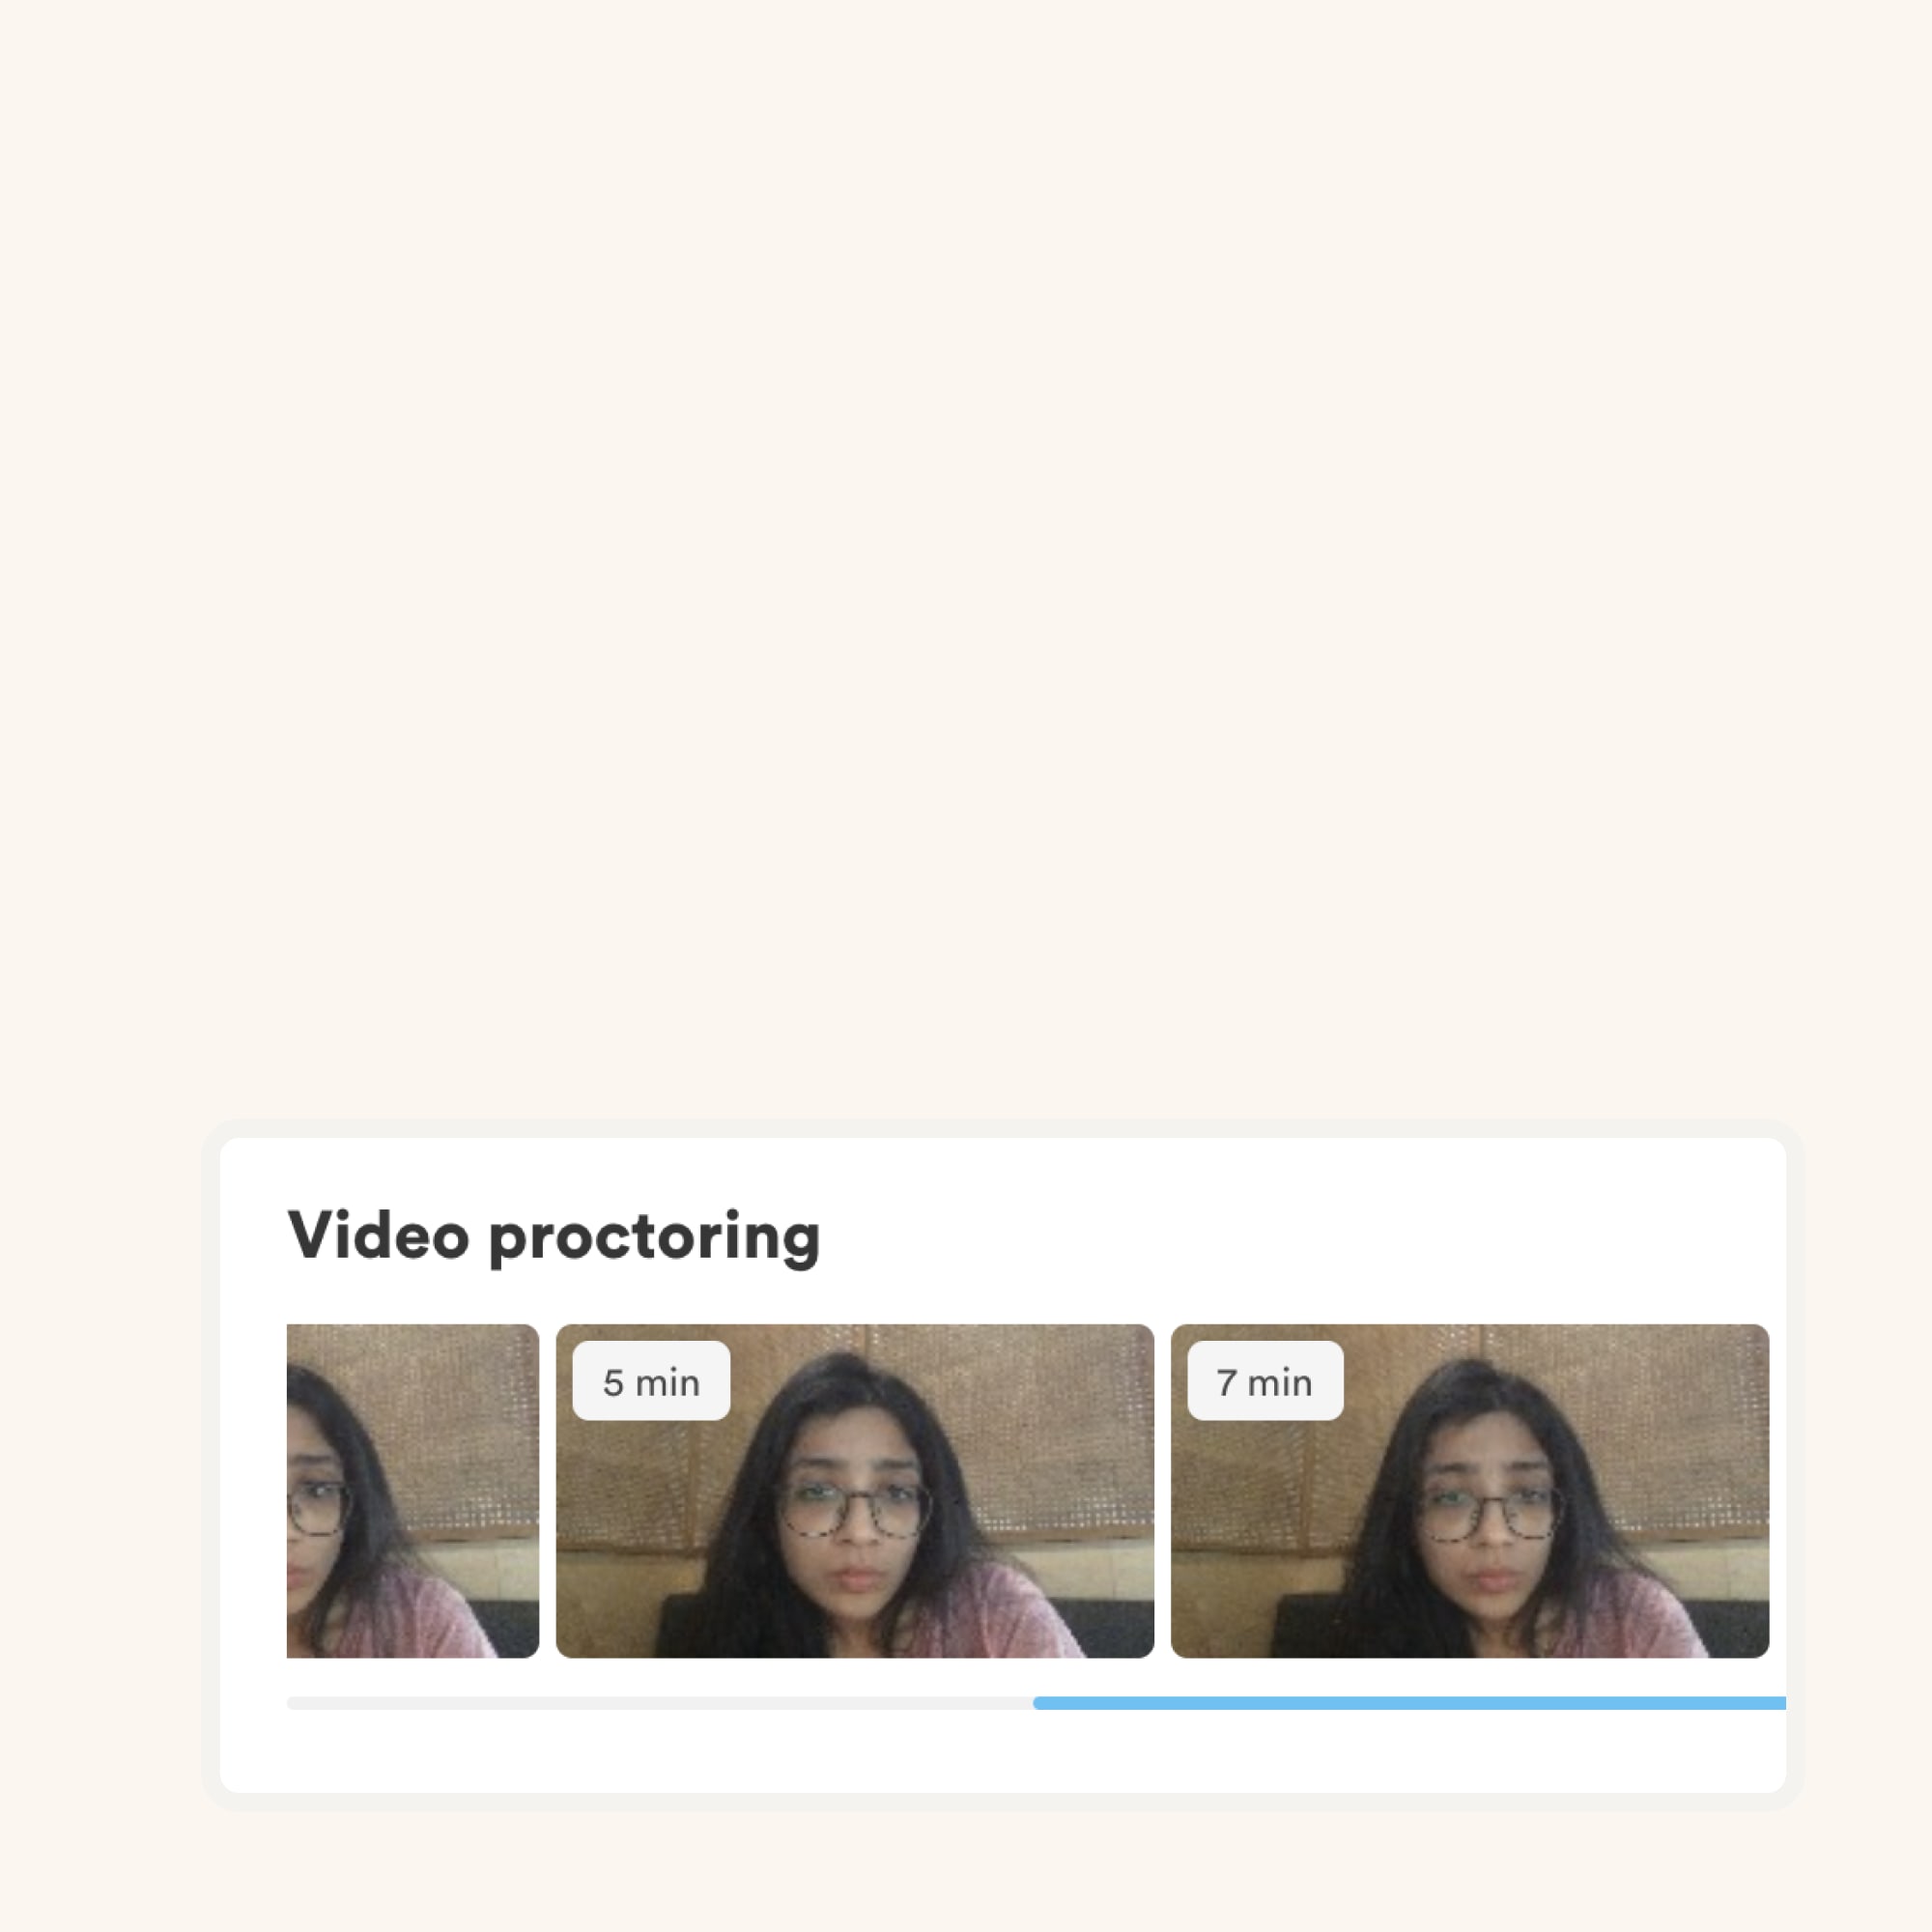
Webcam Proctoring

MCQ Questions

Coding Questions

Typing Questions

Personality Questions

Custom Questions

Ready-to-use Tests

Custom Tests

Custom Branding

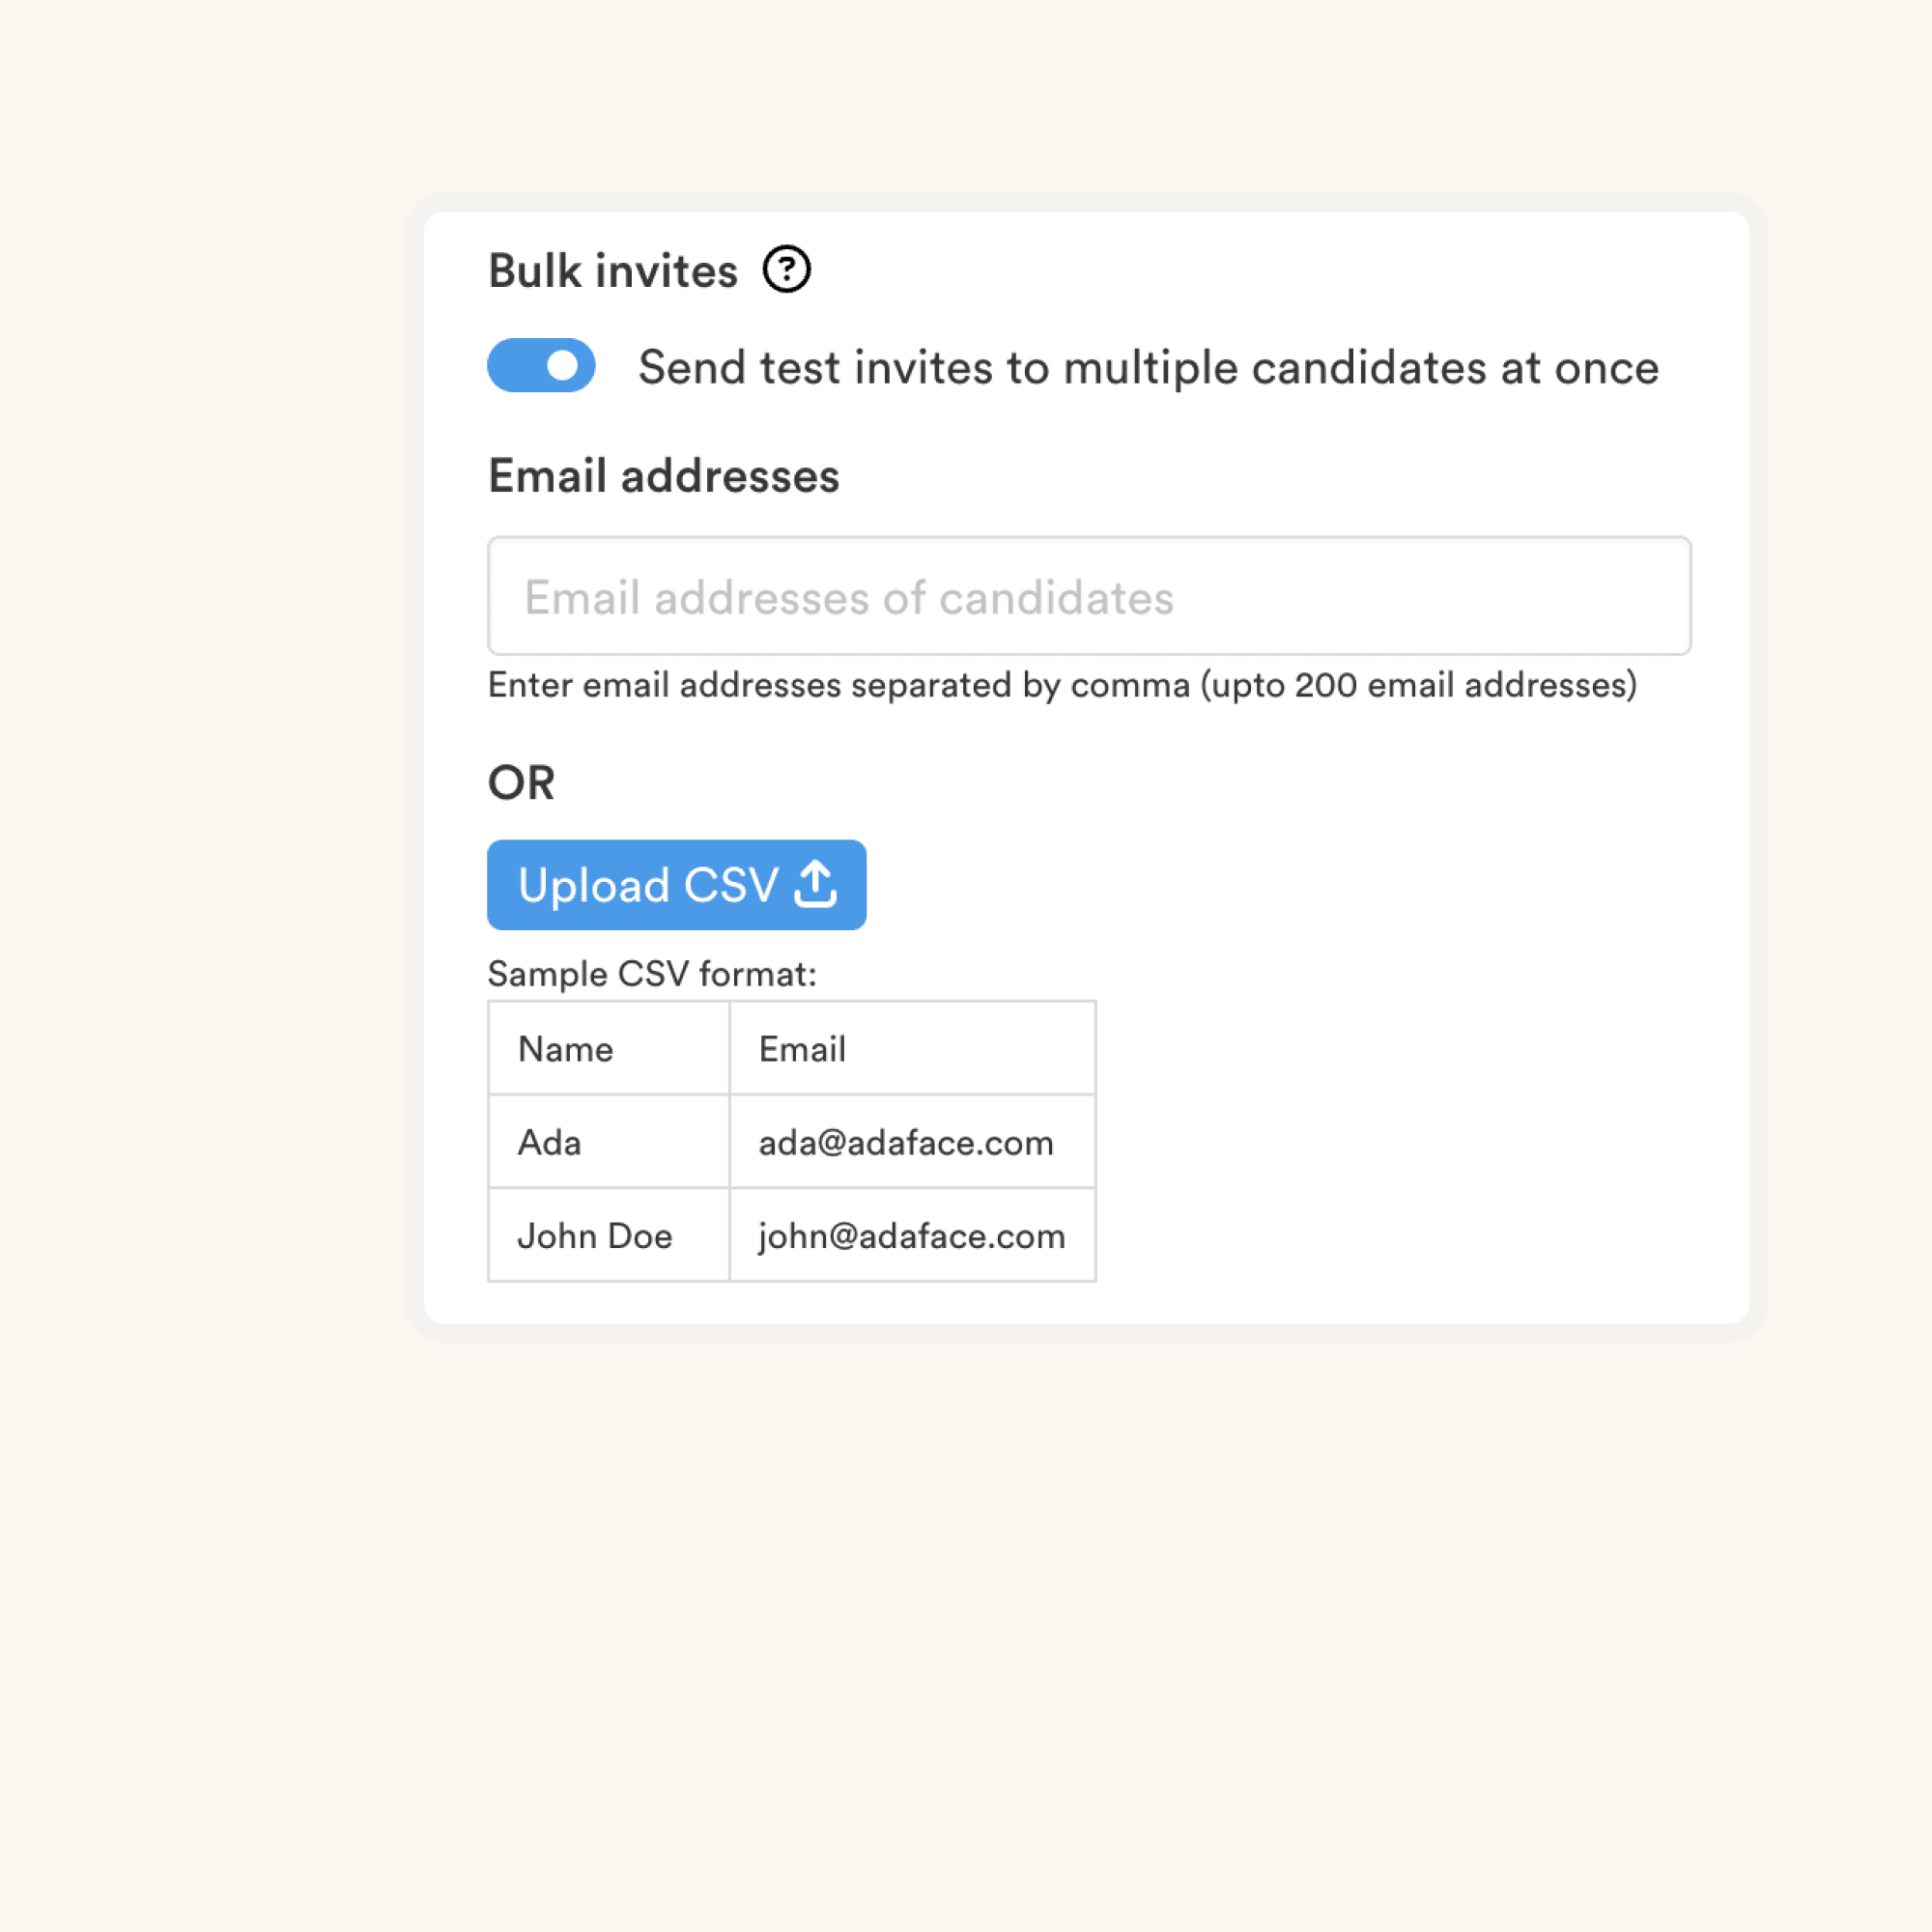
Bulk Invites

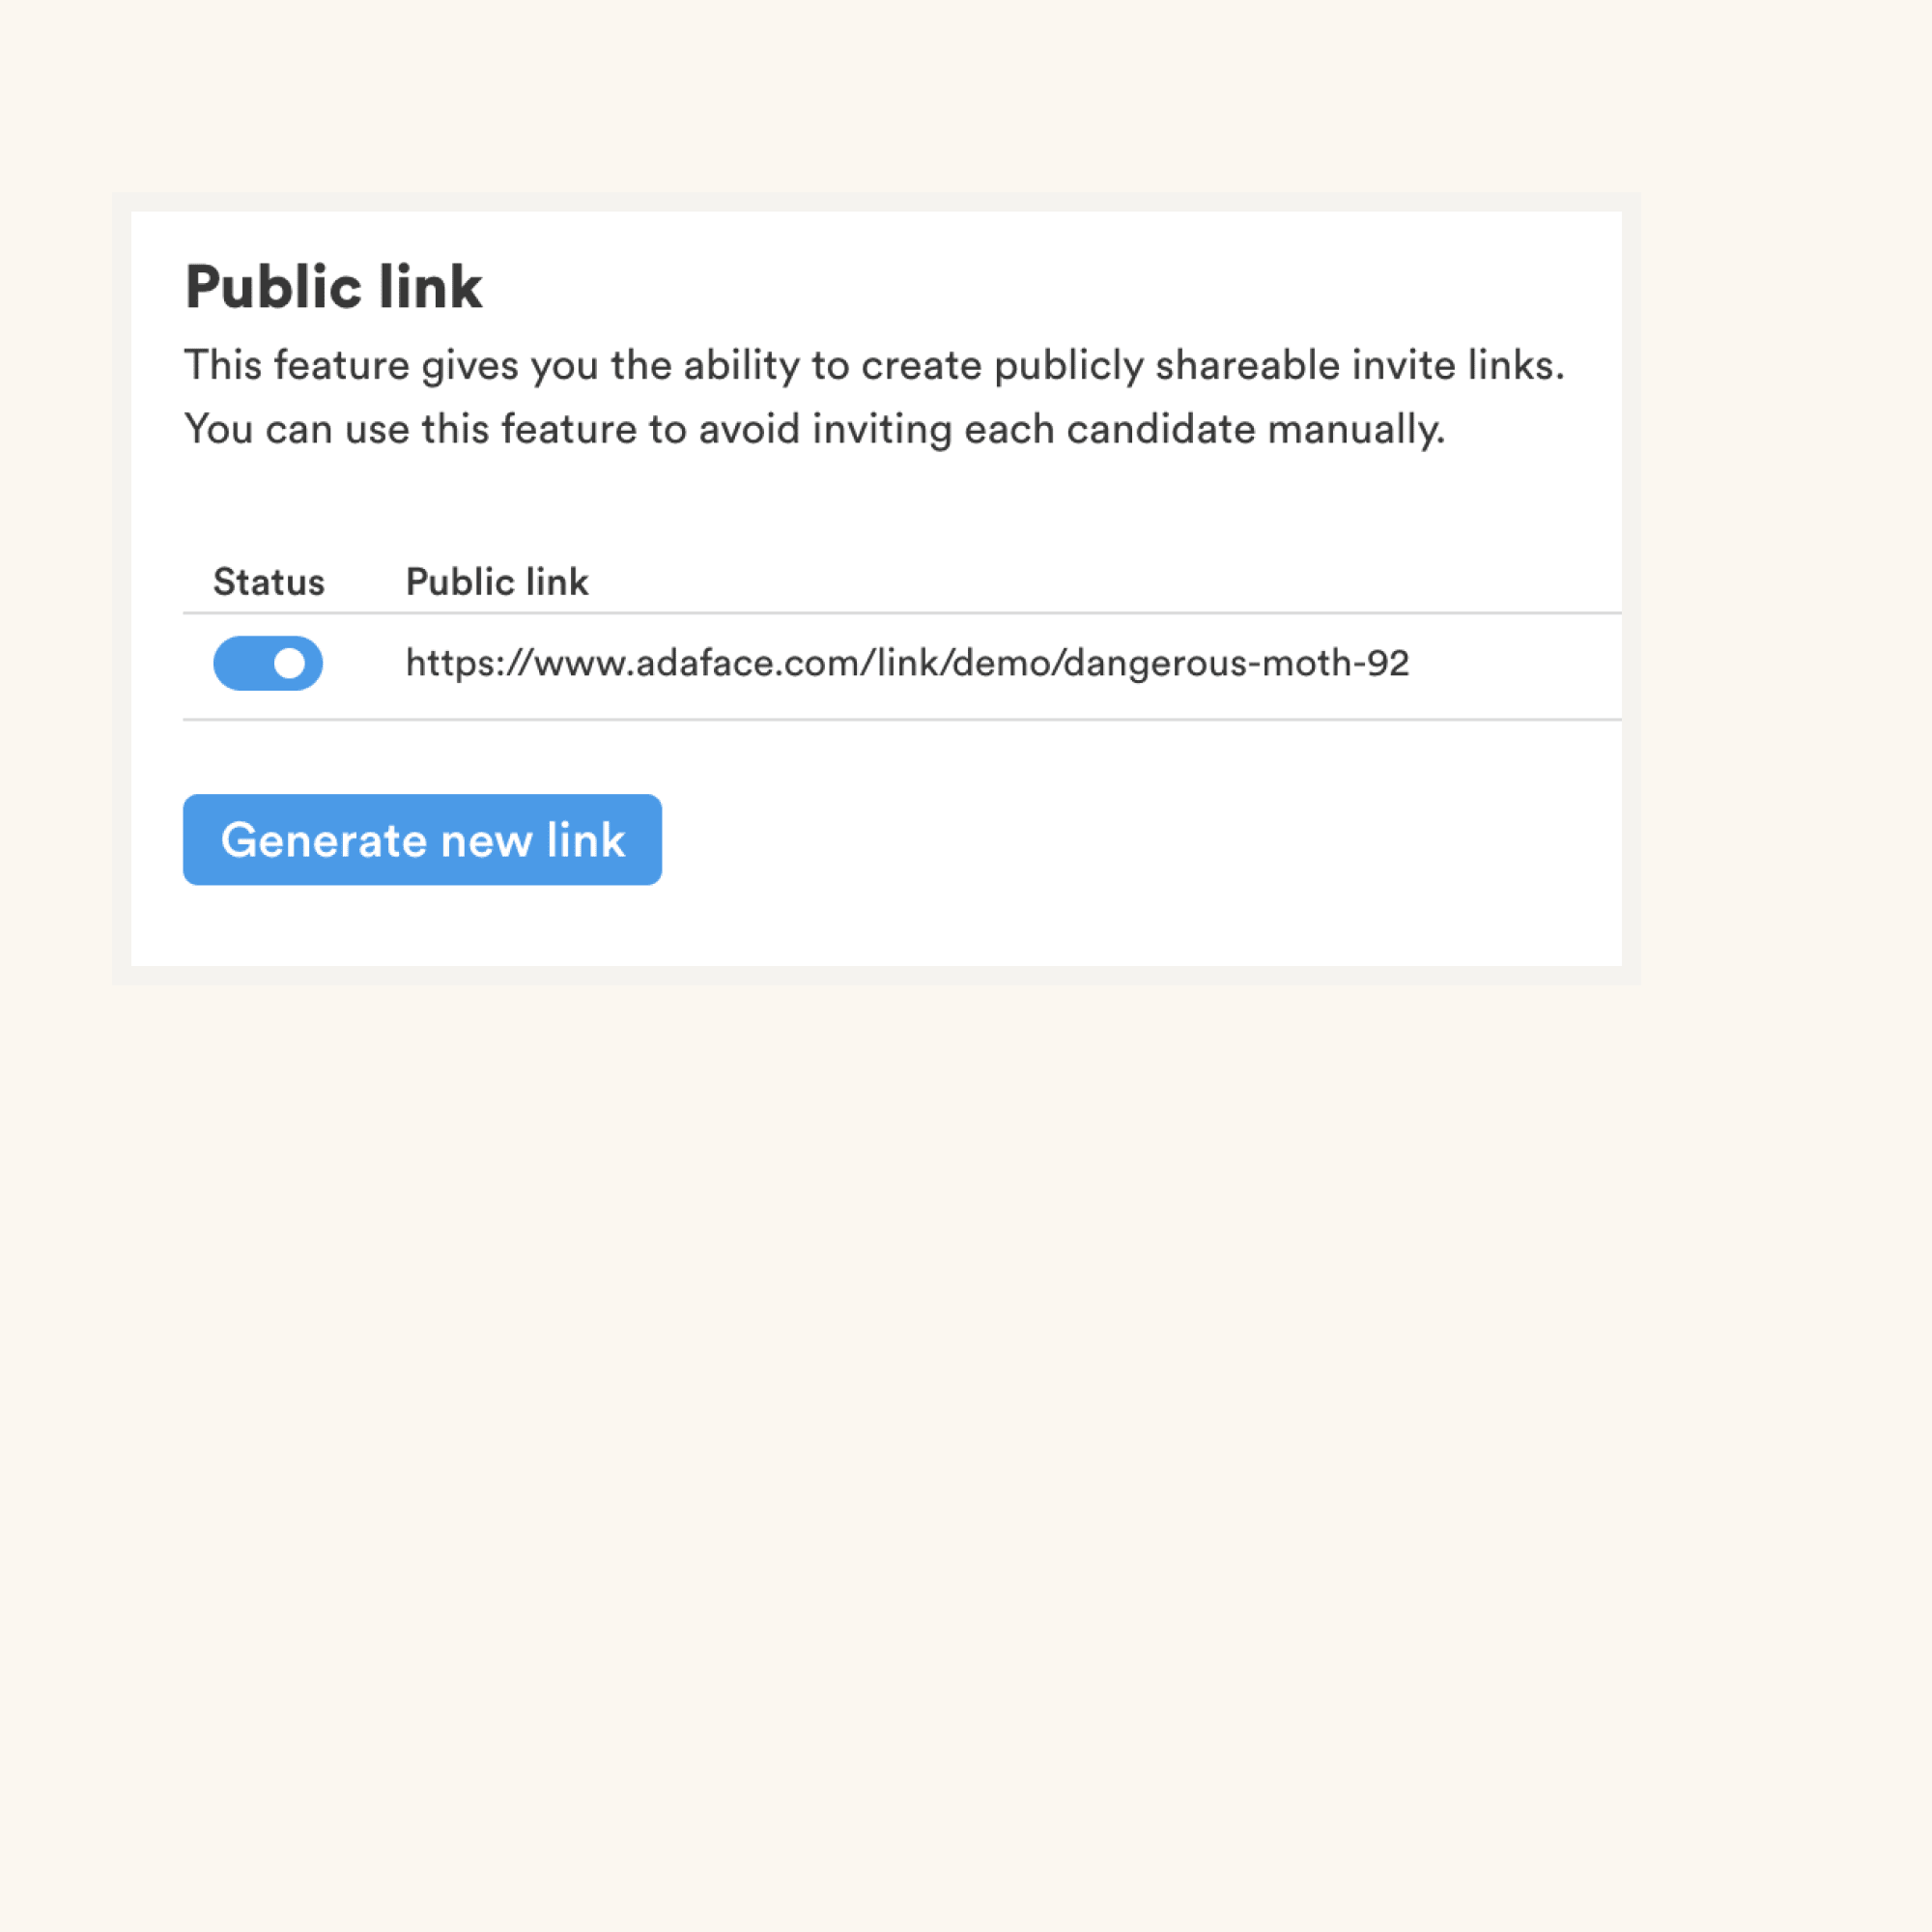
Public Links

ATS Integrations

Multiple Question Sets

Custom API integrations

Role-based Access

Priority Support

GDPR Compliance


Pick a plan based on your hiring needs

The most advanced candidate screening platform.
14-day free trial. No credit card required.

From
$15
per month (paid annually)
love bonito

With Adaface, we were able to optimise our initial screening process by upwards of 75%, freeing up precious time for both hiring managers and our talent acquisition team alike!

Brandon Lee, Head of People, Love, Bonito

Brandon
love bonito

It's very easy to share assessments with candidates and for candidates to use. We get good feedback from candidates about completing the tests. Adaface are very responsive and friendly to deal with.

Kirsty Wood, Human Resources, WillyWeather

Brandon
love bonito

We were able to close 106 positions in a record time of 45 days! Adaface enables us to conduct aptitude and psychometric assessments seamlessly. My hiring managers have never been happier with the quality of candidates shortlisted.

Amit Kataria, CHRO, Hanu

Brandon
love bonito

We evaluated several of their competitors and found Adaface to be the most compelling. Great library of questions that are designed to test for fit rather than memorization of algorithms.

Swayam Narain, CTO, Affable

Brandon

Have questions about the BI Developer Hiring Test?

What roles can I use the BI Developer Assessment Test for?

Here are few roles for which we recommend this test:

  • BI Developer
  • Data Analyst
  • Data Engineer
  • Business Analyst
  • Database Administrator
  • Data Warehouse Manager
  • ETL Developer
Can I combine BI Developer Test with SQL Online Test questions?

Yes, recruiters can request a single custom test with multiple skills. For more details on SQL assessment, check the SQL Online Test.

How to use the BI Developer Test in my hiring process?

We recommend using our assessment software as a pre-screening tool at the beginning of your recruitment process. You can add a link to the assessment in your job post or directly invite candidates by email.

What are the main Business Intelligence tests?
Do you have any anti-cheating or proctoring features in place?

We have the following anti-cheating features in place:

  • Non-googleable questions
  • IP proctoring
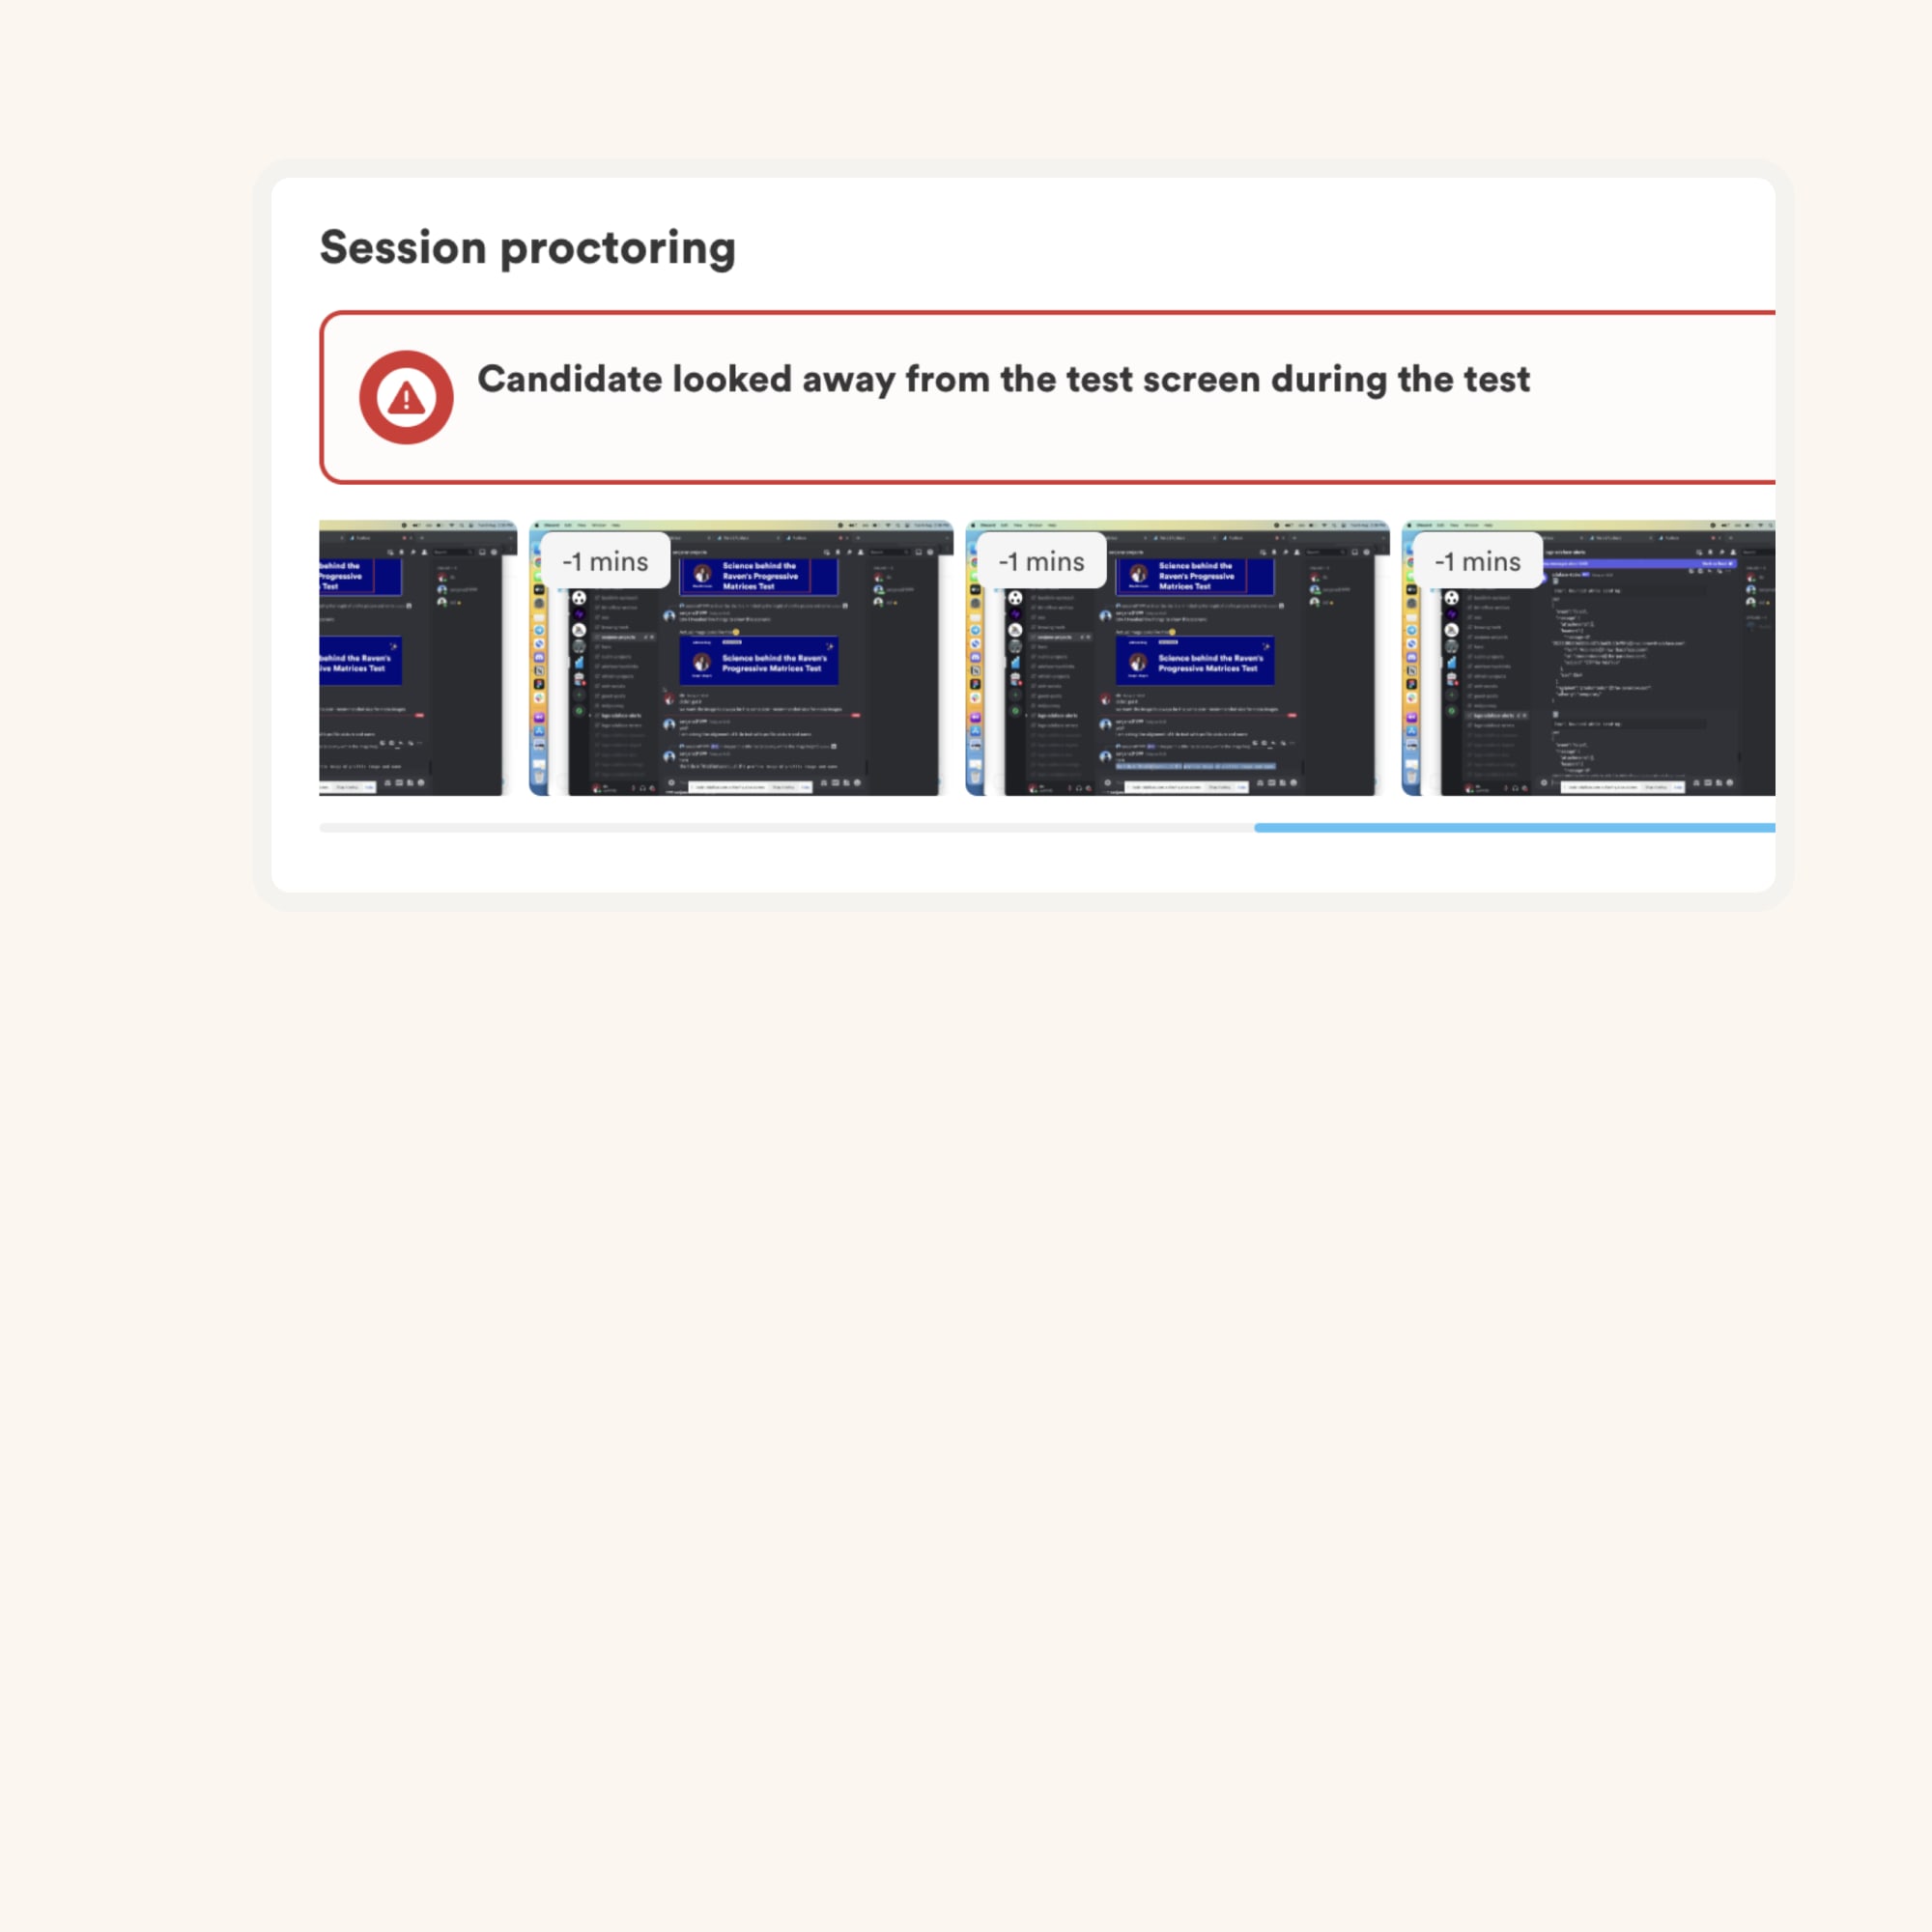
  • Screen proctoring
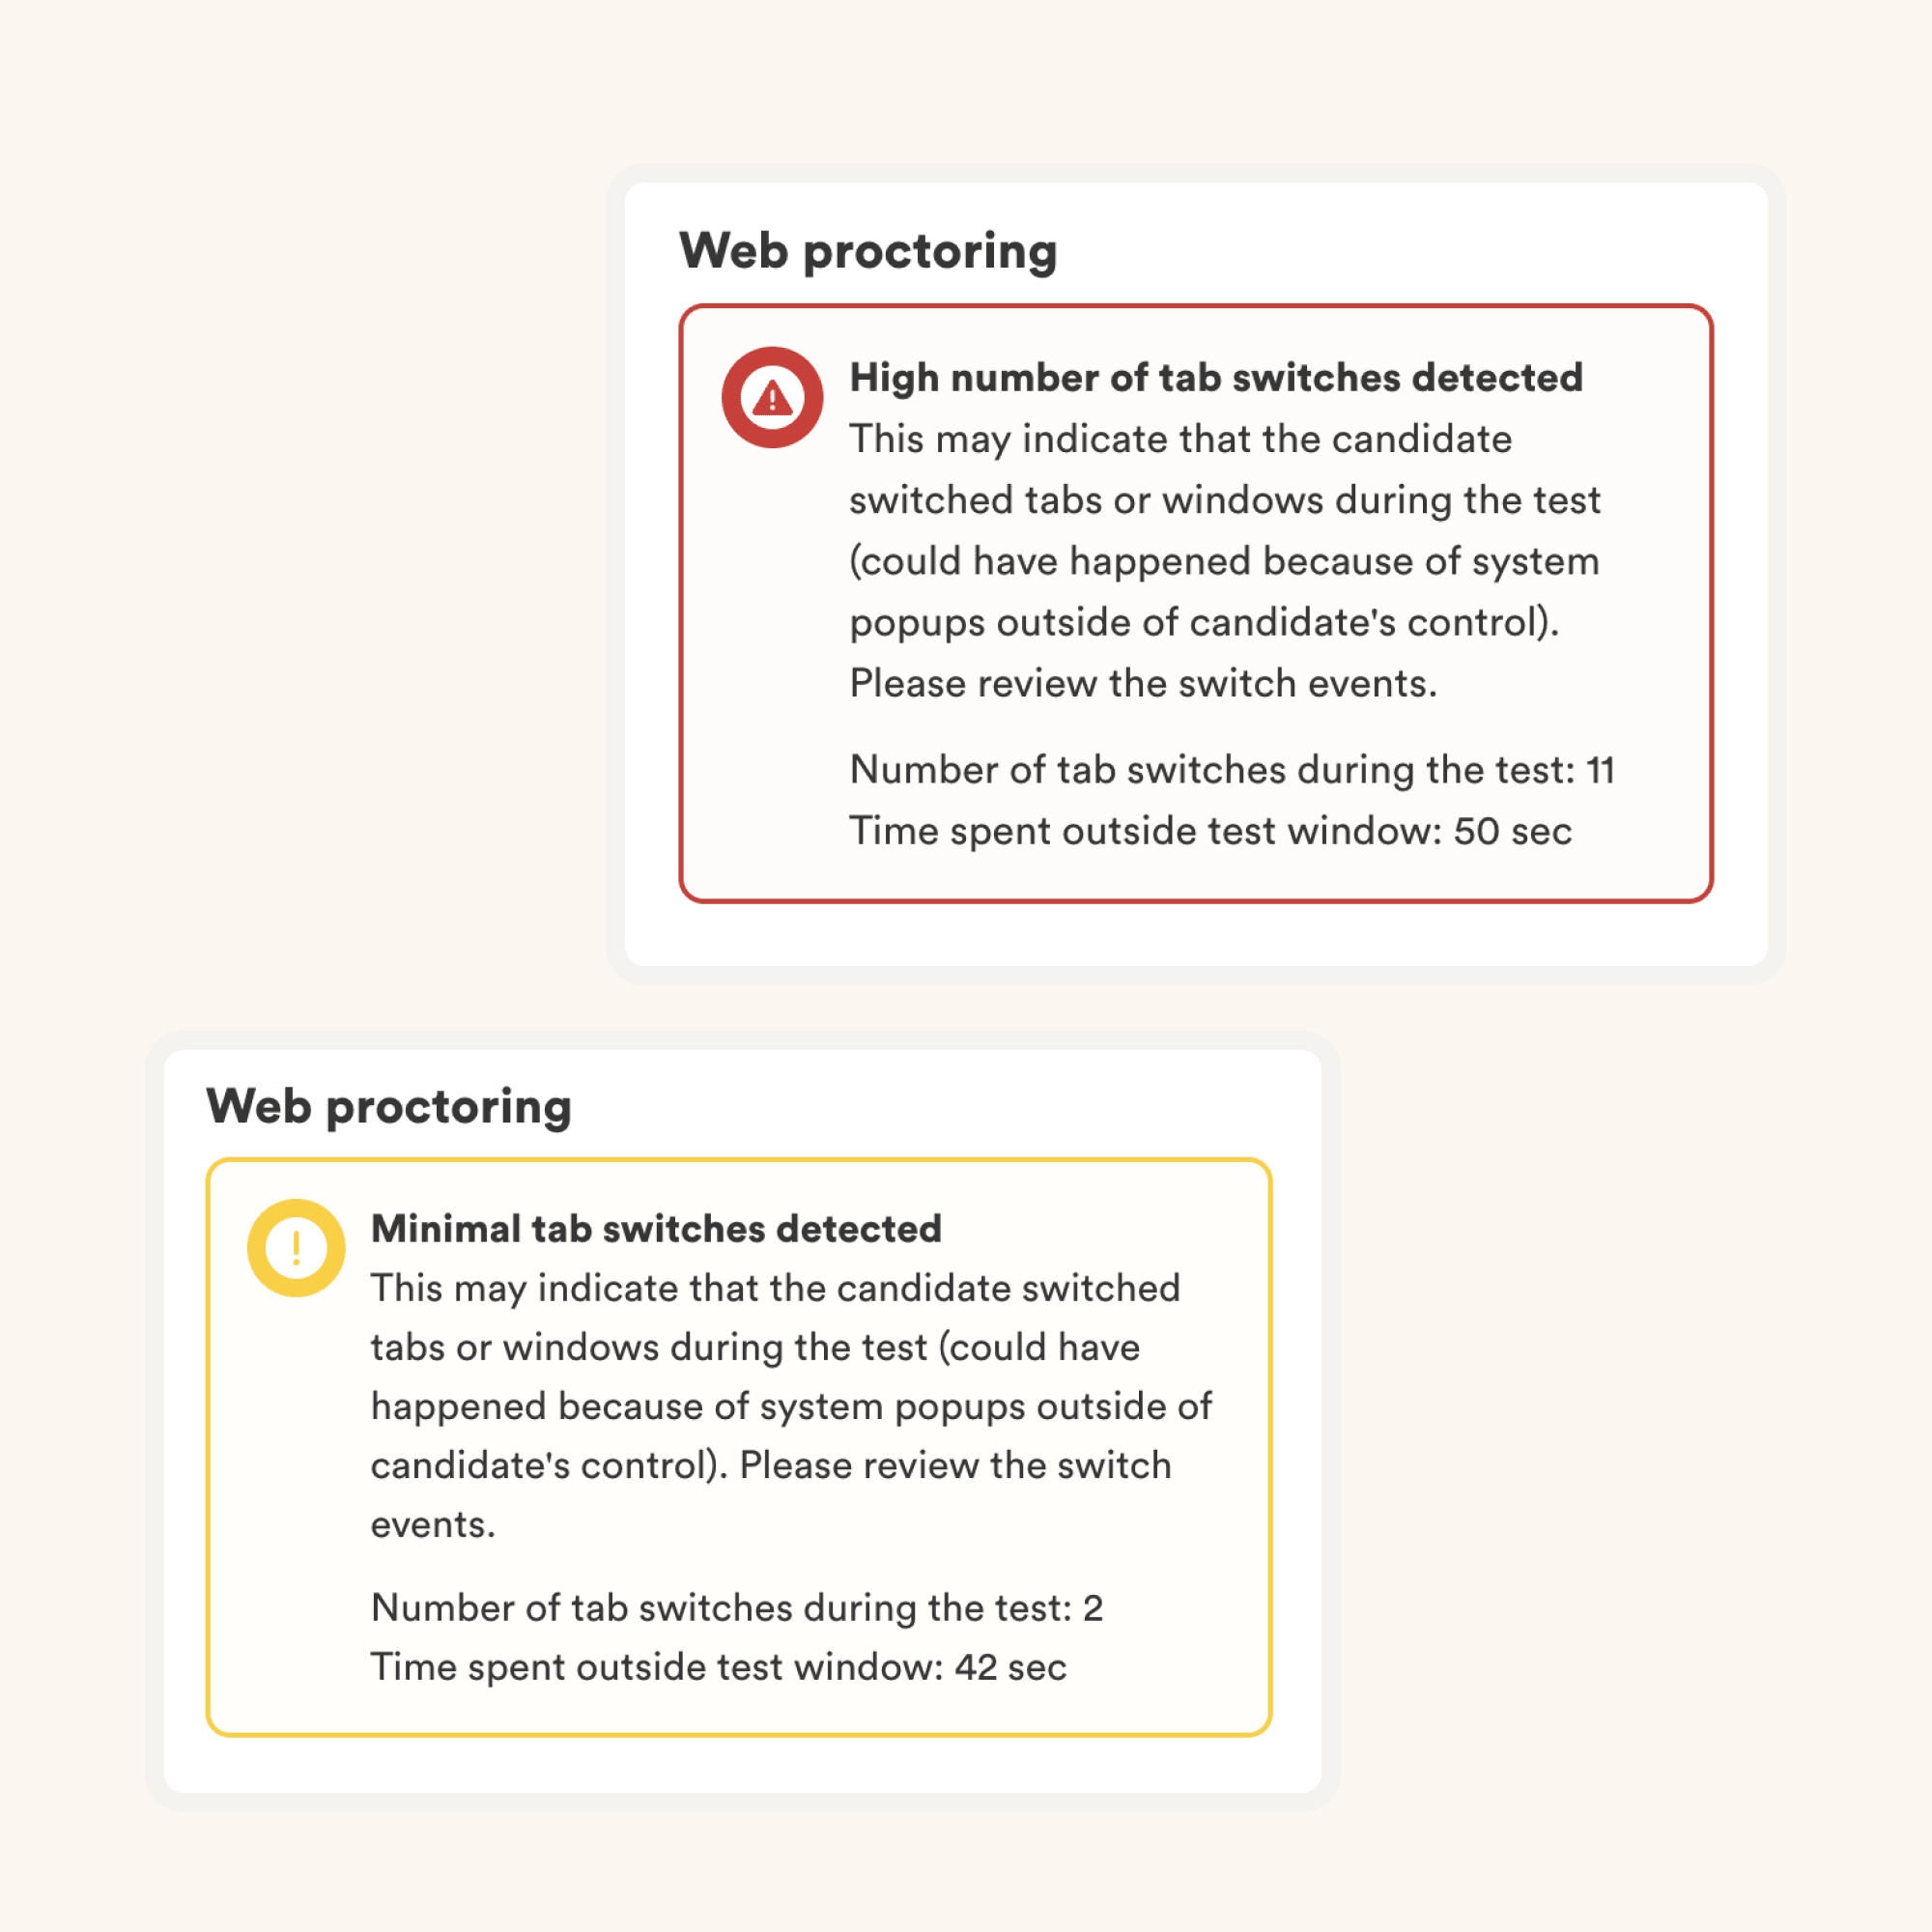
  • Web proctoring
  • Webcam proctoring
  • Plagiarism detection
  • Secure browser
  • Copy paste protection

Read more about the proctoring features.

What experience level can I use this test for?

Each Adaface assessment is customized to your job description/ ideal candidate persona (our subject matter experts will pick the right questions for your assessment from our library of 10000+ questions). This assessment can be customized for any experience level.

I'm a candidate. Can I try a practice test?

No. Unfortunately, we do not support practice tests at the moment. However, you can use our sample questions for practice.

Can I get a free trial?

Yes, you can sign up for free and preview this test.

What is the BI Developer Test?

The BI Developer Test assesses candidates' skills in Business Intelligence tools and languages. It's used by recruiters to measure proficiency in Power BI, Tableau, R, Python, and SQL.

What topics are evaluated in the BI Developer Test?

The test evaluates skills like Power BI data wrangling, Tableau dashboards, Python programming, R analytics, and SQL CRUD operations and joins.

Can I test Python and SQL together in a test?

Yes, you can. We offer a combined test for Python & SQL. It's recommended for assessing both programming and database skills in one go.

Can I combine multiple skills into one custom assessment?

Yes, absolutely. Custom assessments are set up based on your job description, and will include questions on all must-have skills you specify. Here's a quick guide on how you can request a custom test.

How do I interpret test scores?

The primary thing to keep in mind is that an assessment is an elimination tool, not a selection tool. A skills assessment is optimized to help you eliminate candidates who are not technically qualified for the role, it is not optimized to help you find the best candidate for the role. So the ideal way to use an assessment is to decide a threshold score (typically 55%, we help you benchmark) and invite all candidates who score above the threshold for the next rounds of interview.

Does every candidate get the same questions?

Yes, it makes it much easier for you to compare candidates. Options for MCQ questions and the order of questions are randomized. We have anti-cheating/ proctoring features in place. In our enterprise plan, we also have the option to create multiple versions of the same assessment with questions of similar difficulty levels.

What is the cost of using this test?

You can check out our pricing plans.

I just moved to a paid plan. How can I request a custom assessment?

Here is a quick guide on how to request a custom assessment on Adaface.

customers across world
Join 1200+ companies in 80+ countries.
Try the most candidate friendly skills assessment tool today.
g2 badges
Ready to use the Adaface BI Developer Test?
logo
40 min tests.
No trick questions.
Accurate shortlisting.
Terms Privacy Trust Guide
ada
Ada
● Online
Previous
Score: NA
Next
✖️